


Register for a Free Live Training
The Hot Stocks Outlook uses VantagePoint’s market forecasts that are up to 87.4% accurate, demonstrating how traders can improve their timing and direction. In this week’s video, VantagePoint Software reviews forecasts for SPDR SPY($SPY), Costco ($COST), Walt Disney ($DIS), Boston Scientific ($BSX), Eastman Chemical ($EMN), Cummins ($CMI), 3M ($MMM)
SPDR SPY ETF ($SPY)
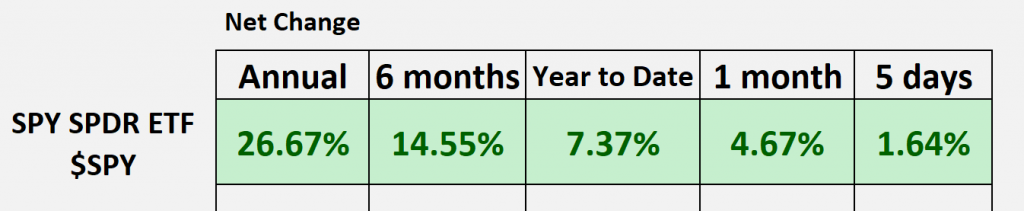
Hello again, Traders, and welcome back to the hot stocks outlook for February 23rd, 2024. Hope you all had a nice week out there in the financial markets. As always, we’ve got plenty to cover here in this week’s hot stocks Outlook and a very exciting week having Nvidia earnings and the broader markets move higher throughout the week. So let’s take a look at that SPY ETF to get a sense of where these markets have been over these given blocks of time.
Here, we’re pushing up close towards 8% on the year-to-date mark now, SPDR SPY ETF ($SPY). Obviously, we’ve seen a very nice week even without that Monday trading from the Monday holiday. So before we go ahead and jump into these individual predictive forecasts from Vantage Point, make sure you go ahead and click on that link in the description below. What you can do is get a live demonstration and learn all of the specifics about how these predictive tools can help you make much better trading decisions based on the markets and style of trading that you’re doing.
And so what we’re going to do is we’ll take a look at Costco here, we’ve got Walt Disney, 3M, we’ll revisit BSX which we looked at last week so we can look at those short-term predicted highs and lows there, then we’ve got Eastman Chemical, and lastly, Cummins here. So a lot to look at but all in the same sort of vein of how is Vantage Point’s predictive forecast getting us ahead of these moves.
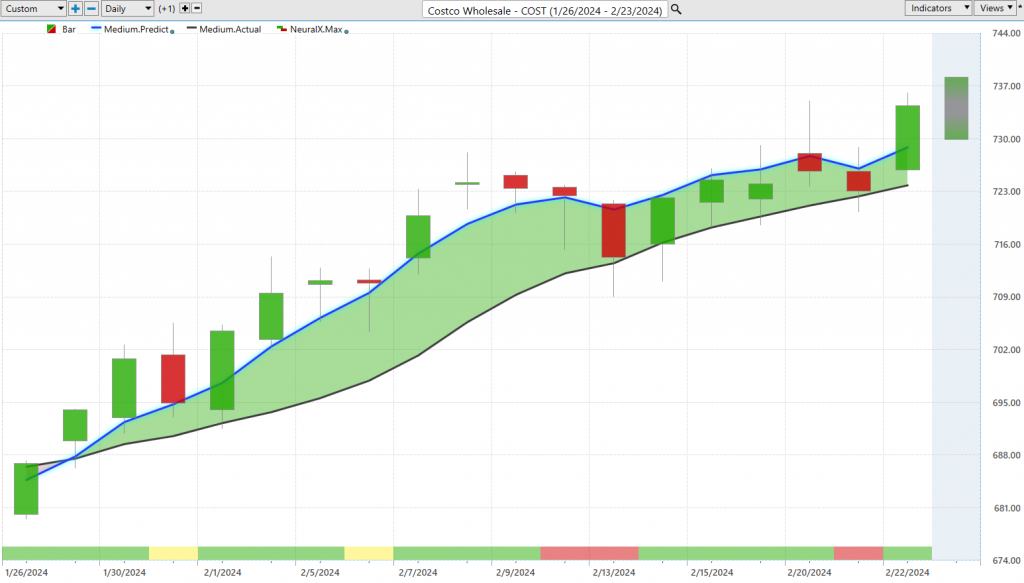
What we have here with Costco (COST) is daily price action. Each one of these candles that you see on the chart that’s representing a full and complete trading day. And so it is right up against all that price data, what you’re going to notice is there is a black line and also a blue line value. And so what that black line value is, is what we referred to as the actual simple moving average. And that’s exactly what it is, it’s a simple moving average looking back at the previous 10 closes. And what that’ll do is I’ll add all those closes together, divide by 10, and it plots that value to give us a measure of where market prices have already been, right, more as a baseline letting us know what’s already occurred in the past. And many predictive indicators like that or non-predictive indicators, we should say, do exactly that, they just gather the information from the past and have no predictive capability here. And so what we want to do is actually compare that black line, we can think that as a price value, and compare this to this proprietary predicted moving average. And so for that blue line to get plotted on the chart, this is where Vantage Point’s technology of artificial neural networks are performing what we’d call intermarket analysis, specifically on Costco. And so what that means is it’s going to look at dozens of markets that are known to drive and influence specifically Costco stock. And so this can be things like that broader Market ETF, the Spy or the S&P futures as well as of course the NASDAQ futures. It’s also going to look at broader markets like the dollar Index or Global interest rates, and it even has the ability to look in those individual ETF groups or individual stocks and identify some of those important Market relationships. And by analyzing those relationships, well, we’re able to pull out very important price clues that are used to generate these highly predictive forecasts. And so what we’re able to do is whenever we see that blue line cross above the black line, it’s essentially forecasting that average prices are expected to move higher and you therefore would expect the trend to go higher. And this is what we look at each week as we look at these different predictive indicators and predictive forecasts. And so we can see that since that blue line crossed above the black line, Costco stock specifically is up about 6.4%. But that’s not the entirety of these predictive forecasts, right? We’re also given this indicator at the bottom of the bar that goes from green to red and back to green, this is the Vantage Point predicted neural index, and it’s tuned to solve a different problem for Traders. And that problem is short-term strength or weakness over just a couple of trading periods, really two trading days moving forward.
Lastly, you’re given a predicted high and a predicted low range. And so you’re given the overall trend direction, short-term strength or weakness, predicted highs and predicted lows, and all of these indicators are tuned to solve these very specific trading problems that may come up throughout your trading day and week. And so what we’re able to do here is look at the entirety of these forecasts and what we’re going to do is get a situation where okay the overall trend is up but every day you’re presented with these predicted high and low ranges before the trading day occurs. So what we’ll do is the actual trading day will fill in here, it won’t change what those predictions are. And so what we’re seeing is how accurate all of these predictions were the day before the trading day. So you had all of these levels before that candle appears and this is what allows traders to be ahead of the market, establish good positions and also maybe more importantly manage those positions as time moves forward. So as this Market moves up about six/ 7% you’re able to pull more and more out of it with some of that short-term trading and adding to the market.
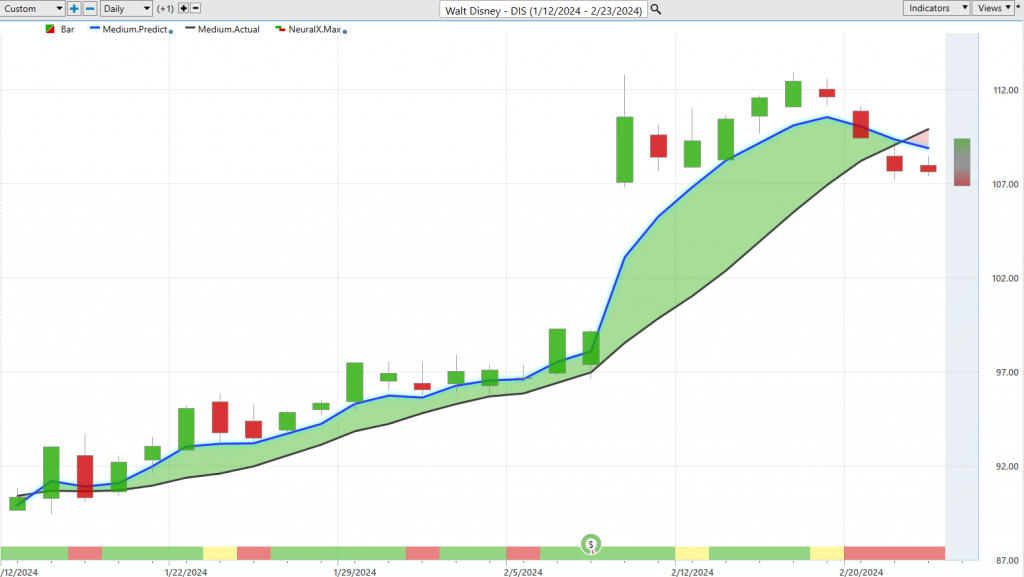
Now here’s Walt Disney ($DIS) and this has been an interesting one because the stock was so beaten down but we started to see the blue line cross above the black line signaling that the overall trend is now up in Disney. Right in the middle of this mess we have earnings and we’ve seen a lot of that especially the past few weeks here. We have in Nvidia a lot of the tech earnings getting a lot of attention but this is why this is so important is you see that weeks before the earnings there’s multiple opportunities for Traders to establish a position at extremely advantageous prices before we start to get that advance. And what’s really great about vantage point is even after all this volatility comes into play right after an earnings event which you know the technology here doesn’t know it doesn’t know that there’s earnings there but it’s able to look at not only what happen in Disney but all these other Market relationships that affect Disney and get those predicted forecasts right back on track. So you see here that the very next day we’re moving down to these predicted lows tapping up against the predicted highs and those ranges again doing an excellent job of indicating how Traders should manage that opportunity. Now most recently we’ve actually seen this cross over to the downside here in Disney and so there’s plenty of opportunities throughout the market for Traders to get involved where we see a lot of bullishness in these forecasts but here you see about a 21% rally and that’s about it right 21% over 25 trading days and there’s much better places to get some exposure in the marketplace, a really nice move there at Disney just over a very short period of time, it’s about a month on the calendar a 20% rally.
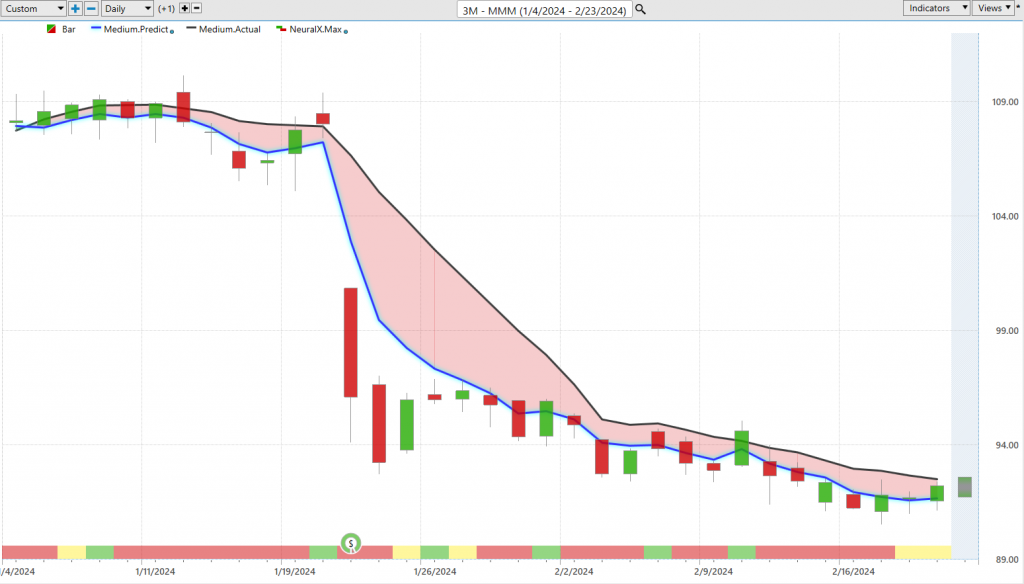
Now here’s almost 3M ($MMM) the exact opposite big company 3M well here you see this Blue Line crossing below the black line again earnings right in the middle of that but look how this forecast has been pretty spot-on day after day after day and again through earnings so even as that huge volatility Catalyst comes in shakes around prices we’ve had a 15% decline over the past 33 trading days but a bunch of numerous opportunities where these predicted highs and lows have been guiding you day-to-day as the market moves forward but if you understand hey if you want to get some short positions maybe hedge some in the portfolio try to do that toward these predicted highs and as long as that blue line remains below the black line well we should expect the market to continue lower and again look at all this volatility around earnings and look how quickly the software looks at those in Market relationships generates those short-term predictive forecasts and offers all of this guidance moving forward for the Trader to to even add to those short positions at some of these prices so this is what’s very important is understanding also which markets are in downtrend because as markets start to shift and we’re you know running some of these nightly scans with Vantage points features like the intelliscan we can identify where these fresh shifts are happening whether to the downside or new opportunities to the upside so this has been really important in like Tesla and Apple you know haven’t really performed all that well compared to many Boston Scientific ($BSX) of those other stocks they’re extremely strong and and reaching new highs here.
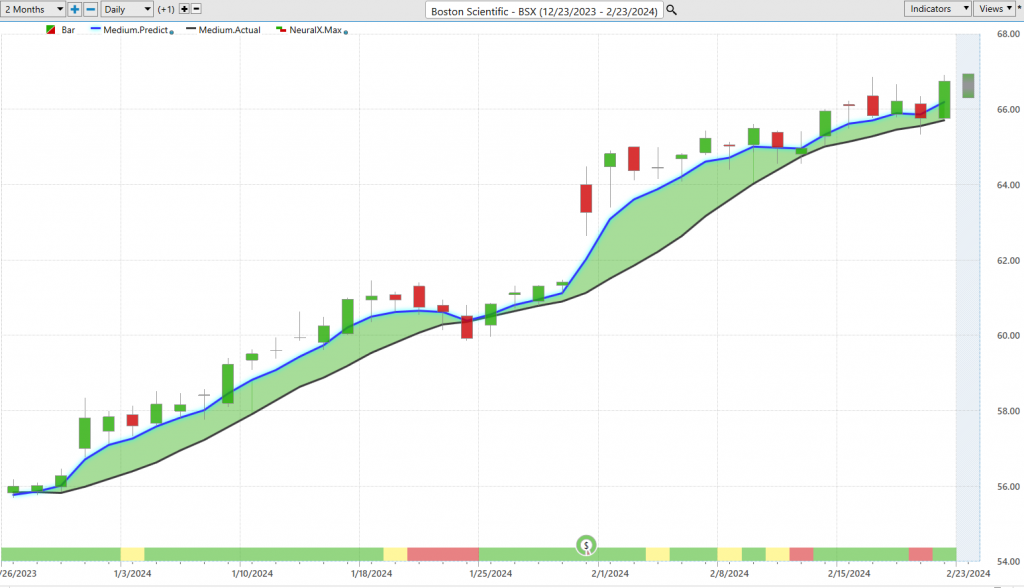
So here’s Boston Scientific and I actually wanted to bring this through because we looked at this opportunity last week and clearly we can see blue line over Blackline a lot of strength as far as those predicted forecasts and really what I want to do here is just update this right and say okay well if you have the Vantage Point predictive indicators and you understand that BSX is in an uptrend well how should we use some of those shorter-term predictive indicators to manage the opportunity and so we have about a 19% rally over the past 39 trading days but what’s interesting about this with this abbreviated week that we have well how have the short-term forecasts been guiding you well this is actually Tuesday Wednesday Thursday and you see here going into the week what’s it telling you look down towards these predicted lows to you know take on a position and look up towards these predicted highs to take some off and you actually see this quite a bit is you’re moving right up to that previous predicted high right so even when it looks like things are a little bit off all that’s happening is it’s getting ahead of this and saying expect the market to trade up here expect the range to potentially trade down here but the overall trend is very much still bullish so even just this week if we wanted to take a look uh just at this move from predicted low to predicted high it’s another one and a half 1.8% move just in one single trading day so really nice opportunities both on the longer term Eastman Chemical ($EMN) but also these shorter-term windows.
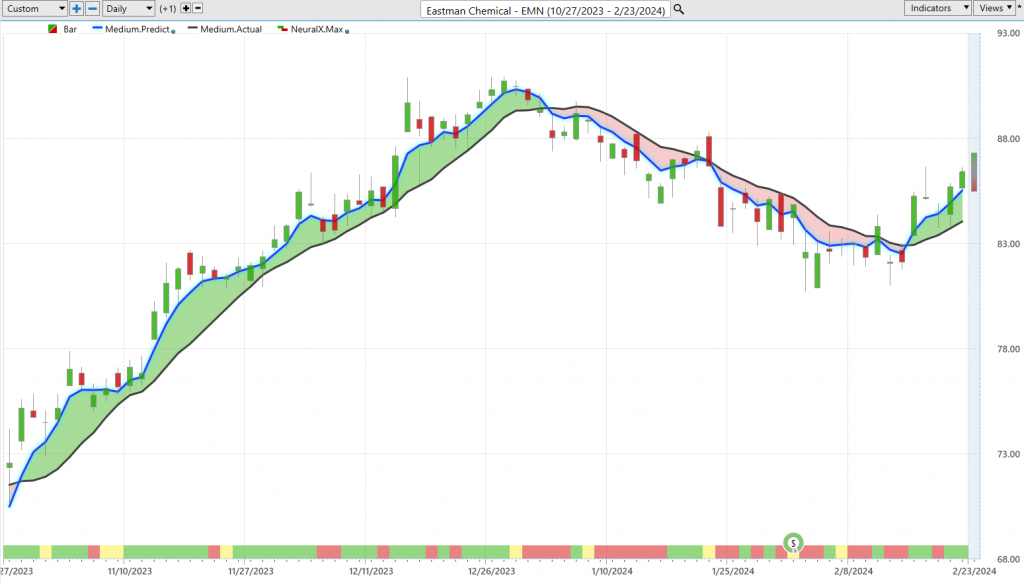
Eastman here I wanted to bring this in because this is an opportunity we looked at along with I believe Huntsman and a lot of the energy stocks earlier in the chart so there’s really excellent opportunities to go ahead and get long but this is sort of like 3M now right you get these crossovers to the downside you want to know when to avoid the stock but also we need to understand when those shifts are coming in right and have that confirmation from Vantage Point is okay now we can get re-involved and what I wanted to do here is again just highlight here’s where the market turns lower here’s where the market turns higher and we can look at those predicted high and low ranges so from this point forward it’s only giving you the indication like you want to short up towards these predicted highs and expect price declines until we start to see hey there’s that reversal well now this week you’d want to be a buyer from those predicted lows you’ve already seen a few dollar advance there in shares of Eastman Chemical and this may do quite well here as we’re seeing again some of the energy stocks and certainly the chemical side of this start to perk up here so just this past week here in Eastman from some of those previous predicted lows you’re already up about two and a half almost 3% just in the past few trading days.
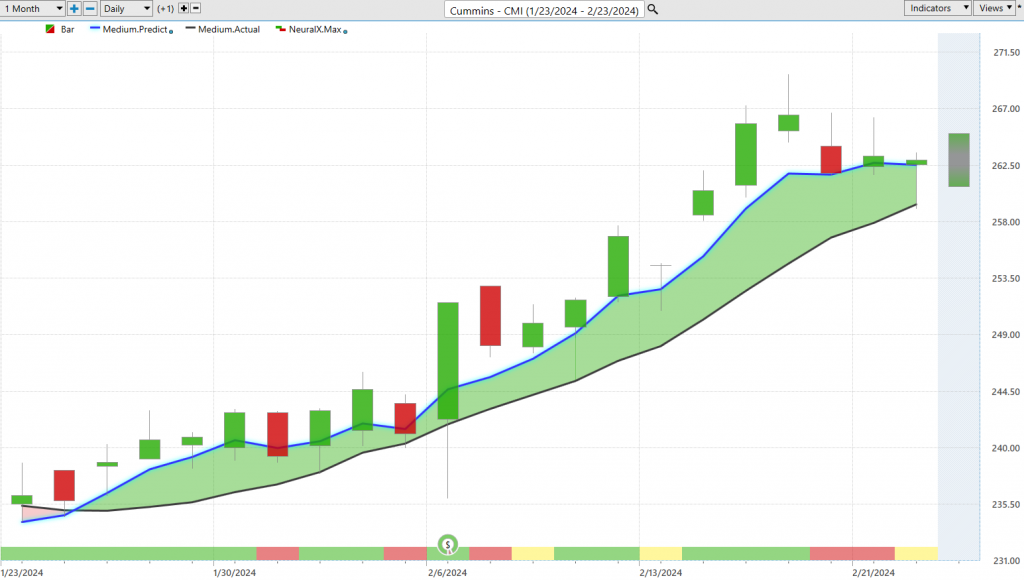
Lastly here Cummins ($CMI) shares of Cummins really straightforward example here Blue Line crossing above the black line we have earnings right here in the middle of all of this noise but despite that you know volatility around the earnings look how accurate all of these predictive indicators are so if there’s not a huge surprise necessarily around earnings you often get the market just trading within the predicted ranges you’d expect and actually I mean you see this you get that predicted trading range moving lower some volatility around the earnings but the trend is very much to the upside right if you want to get through that earnings announcement before you take on a position well again these predictive indicators will update and say okay now we can go ahead and get involved without all that noise is on the chart from earnings and again just a really nice move here from Cummins and still looking to move a little bit higher here so about a 10 and a half percent rally over just the past 20 trading days and of course as we see the spy and the cues and the broader markets moving higher there’s going to be some tremendous opportunities within the individual stocks but if you don’t have the right tools and you’re wrapped up in the wrong opportunities we’re going to end up wasting a lot of time not making a lot of money and probably getting very frustrated so once again this has been our hot stocks outlook for February 23rd 2024 thank you all for watching best of luck out there in the markets and bye for now.


