


Register for a Free Live Training
The Hot Stocks Outlook uses VantagePoint’s market forecasts that are up to 87.4% accurate, demonstrating how traders can improve their timing and direction. In this week’s video, VantagePoint Software reviews forecasts for Cameco ($CCJ), Bloom Energy($BE), Home Depot($HD), Boeing($BA), Imperial Metals ($IPMLF)
VantagePoint A.I. Hot Stocks Outlook for January 16, 2026
Hello again, traders, and welcome back to the Hot Stocks Outlook for January 16th, 2026. Hope you all have had an excellent week out there in the financial markets. And as always, we are here to take a look at the most recent VantagePoint A.I. predictive forecast. So, if you have not already, be sure to go ahead and click the link down in the description below and get signed up for a live demonstration. Learn all the specifics about how these predictive indicators and technologies are helping traders navigate the financial markets and really make better trading decisions day in and day out.
And so we have some examples. We will refresh some of these charts from last week and see how the markets have updated those most recent predictions.
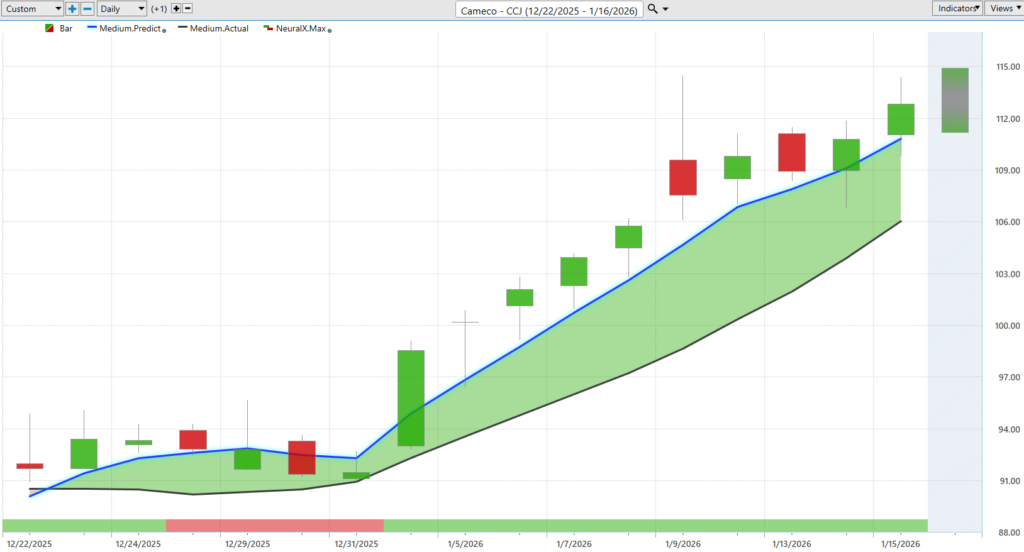
But a really good example here of how all of these predictive tools work together is shares of Cameco ($CCJ), or KCO or $CCJ. And like every week, what we are looking at here is daily bars and candles, where each one of these candles will represent a full and complete trading day. And it is right up against that price data that you are going to notice that there is a black line and also a blue line value.
And so what that black line value is is actually a simple moving average. And VantagePoint traders are able to use this really as our baseline, letting us know where prices have been. And so what this does is look at the previous 10 closed prices, add them all together, and then divide by that number, and we get that rolling measure.
Now, the issue is that all that data is really lagging. It has already occurred. There is no predictive capability there. It all comes from the past and also only comes from this singular target market, shares of $CCJ. And so what we are able to do is compare that value, what we might call a lagging moving average, to this blue line, proprietary predicted moving average.
And for this number, essentially a price that is going to get calculated and plotted on the chart every evening, well, for this to get generated, this is where that technology of artificial neural networks comes into play. But they are performing what we would call intermarket analysis. And so rather than just looking at past prices and plotting along the most recent moving average, what VantagePoint’s technology is doing is looking at other markets.
It is really using the data sets of dozens of other markets that are known to drive and influence future price of this specific stock, this target market, $CCJ. Now, that can be things like other individual stocks spread across the marketplace. That can also be ETF groups. But it even looks at things like commodity futures markets, things like currencies, things like interest rates in the bond market, as well as again global commodities where applicable, and may certainly be applicable in shares of something like $CCJ.
And so it takes this global approach, uses huge data sets, to then generate forward-looking predictions on where price is headed next. And so whenever we see that blue line cross above or below the black line, so in this case above, well, it is suggesting that average prices are expected to start trending higher.
And traders can actually utilize tools like the VantagePoint IntelliScan, which is actually going to scan and find where these predicted moving averages are moving above those actual moving averages and warning traders of fresh trends getting started. So we see once that forecast has come through, the market is up about 23 percent now in just the past 16 trading days. A very nice swing trade to the bullish side here.
But that is not the entirety of these predictive tools and indicators. And this is where things get really exciting to manage trades, but also potentially for shorter-term traders, to utilize tools like the VantagePoint predicted neural index, which is this bar that you see at the very bottom of the screen.
Well, this gets updated every single trading day, but it is forecasting strength or weakness over the next 48-hour period. So we can again just think of that as a couple of candles moving forward. And it gets this right with an extremely high level of accuracy, upwards of 85 to 86 percent across a very wide set of markets.
And really see how this works in combination with that predicted moving average. If the overall trend is bullish, you will get these periods where the neural index goes bearish. And again, it is warning you to expect weakness over the next couple of trading days. Again, it stays bearish. Expect weakness. Expect weakness.
So it is getting that calculation right on all of these days, warning the trader to expect the market to settle down a little bit. But notice that that blue line is still above the black line. And so once that neural index gets bullish again, we see all that momentum in the market.
And then again, swing traders can say, “Okay, well, this is where I want to go ahead and get more aggressive in the trade.” And now we have things like the predicted high and low that are provided as well.
So there are separate neural network technologies taking care of all these different problems, whether it be again that predicted moving average, the neural index at the bottom of the chart, and also picking out these intraday price levels of a predicted high and a predicted low.
And really see how this works. There are numerous opportunities here before this trend really starts kicking off and moving higher. But even after that volatility kicks into the marketplace, notice it is saying, okay, expect the market to trade down towards these predicted lows. If you are wanting to be a buyer in this market, you have a road map really guiding you of where you should be looking for opportunities.
And again, about a 26 percent move or so, a 22 percent move over the last 16 trading days. Obviously, a very strong trend here.
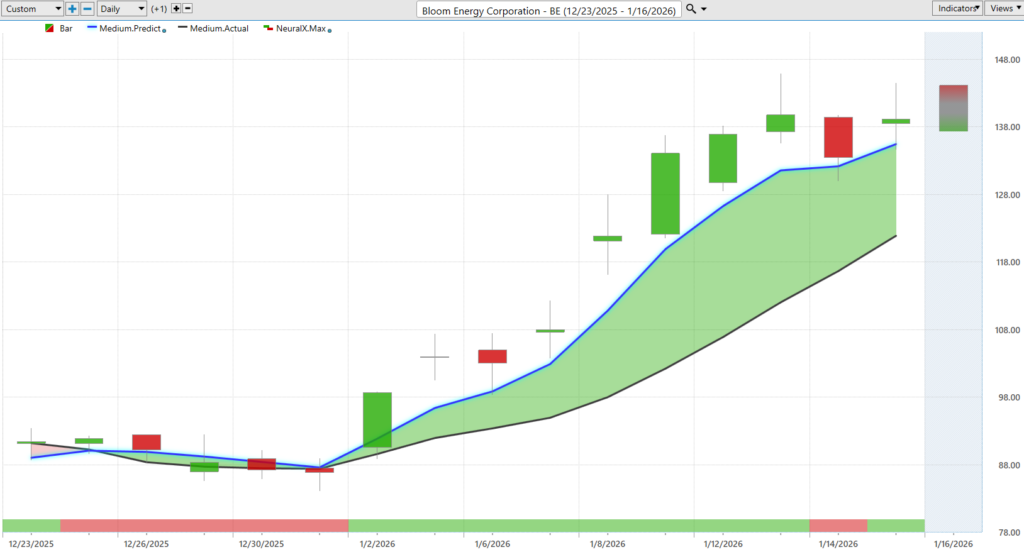
Now, we can move on to Bloom Energy Corporation ($BE). So we can take all those things that we just learned about how these predictive indicators and tools work and get a sense of the overall forecast.
Well, we actually see that that blue line crossed above the black line all the way back here. And so what that is indicating is that this market is starting to move into an uptrend. But notice the interesting price action. The neural index is bearish, and it is letting you know to expect some weakness over these couple of trading days.
But again, once that neural index gets bullish, then we see the momentum really kick in as we get the overall prediction, that predicted moving average creating some separation and the neural index, and we really see things kick off here.
Of course, we can again look at those daily predicted highs and lows and need to remember that these levels are provided before each and every trading day. So before we get any market or any trading here, this actually comes in at 6:00 p.m. the night before.
So before we get in any trading at 9:30 in the morning, well, we already have those levels ahead of time. So as traders come into the market, they understand, if I want to be a buyer, buy down towards these predicted lows for short-term trading opportunities or some entries to get involved in the trend.
And again, we see as this market really starts to move, we get the neural index bullish, the trend bullish, and very clear indications of where you want to be a buyer, down at these predicted lows. And we point out things like this week to week, where you see just a lot of bullish momentum.
But notice how this market trades. It trades right into that previous predicted low and then continues the uptrend. It actually fills this predicted low to that predicted high in pretty short order here, as the overall trend is very bullish here.
So here in Bloom Energy Corporation ($BE), just over the past couple of weeks now, we are seeing a move of about 57 percent in just the past 13 trading days.
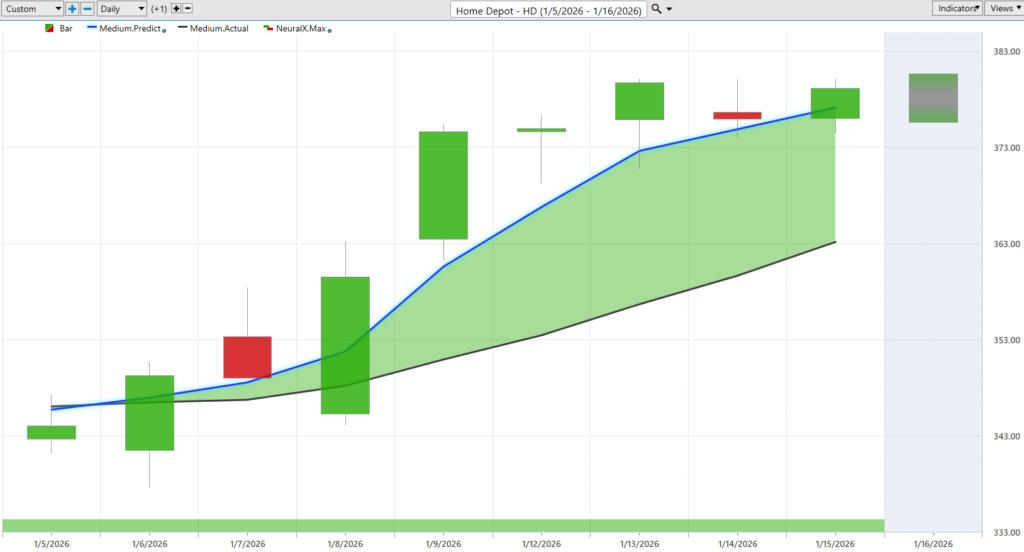
Next, we can move on to Home Depot ($HD). A much more recent crossover. This blue line is moving above the black line. And notice just all the strength here.
So it is pretty much a straightforward forecast. It is saying, look, everything is bullish here. The trend is moving to the bullish side. The neural index is very bullish.
And of course, traders have this road map that says, okay, well, we have a predicted high and a predicted low for every single trading day. We can use those levels to try to set apart some of these strategies and get involved in the market.
And again, you see this day where all the price action is on the bullish side of this range. Then we trade right into these predicted lows, the market gapping down and immediately starting to trend higher.
And even after we get that move, notice how these predicted ranges are going to keep adjusting and letting you know what to expect, whether it be on the low side of the intraday price action or on the upper side of things.
So again, just a little start to the move here. A lot of separation here between that blue line and the black line average. About a 9 percent rally in shares of Home Depot ($HD) just in the past six trading days.
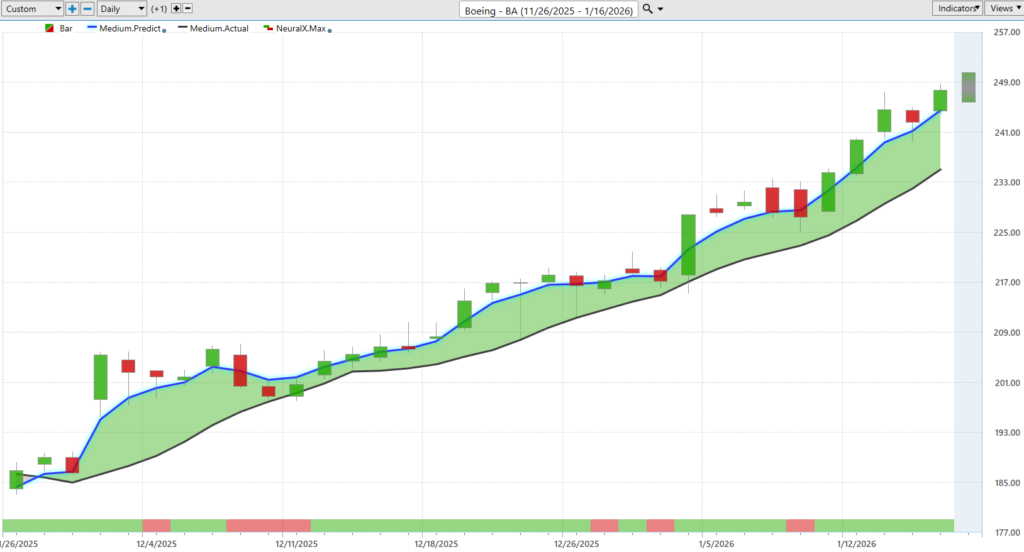
Now, here are a couple of markets that we have looked at over previous weeks, and I just wanted to bring these through to highlight that when you identify markets that are in a strong trend, I believe we actually brought this through after this trading day here, you can of course manage opportunities.
And when you have a tool that is really a road map that is going to say, okay, well, what should you expect from the subsequent price action, well, we can use those VantagePoint predicted levels.
And again, we see how this works really from a couple of weeks ago. A buy down towards these predicted lows, getting in before this really strong rally. We see the neural index gets bullish once again. We see that momentum.
And even just a couple of days ago, being Wednesday, moving down to the predicted low, pretty quickly moving up to that subsequent predicted high, and the overall trend again continuing here.
So even just for the past couple of weeks here in shares of Boeing ($BA), shares are up another 9 percent overall, with the trend up about 32 percent just in the past 32 trading days. So a very nice move there.
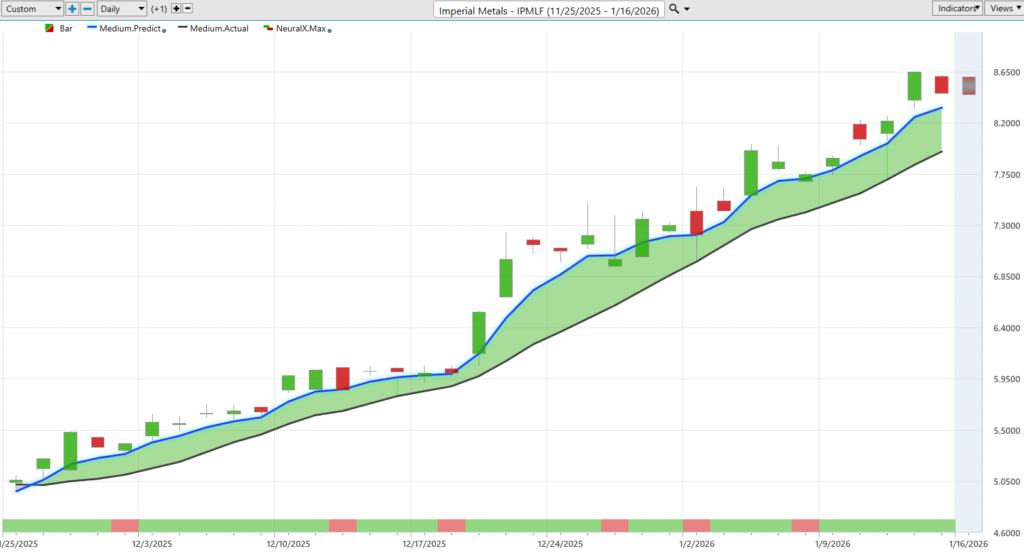
And lastly here, Imperial Metals ($IPMLF), just Imperial Metal. So another market that we brought through a couple of weeks ago. A little bit more spotty price action with some more gaps on the chart.
But you notice again over the past couple of weeks, be a buyer down at these predicted lows. And we see numerous opportunities to buy up the market and shares going higher.
So again, a couple of weeks here, seeing the market go up another 10 percent, but the overall trend now up about 65 percent. So as we see metals like copper, silver, platinum, all these markets doing extremely well, steel and aluminum stocks here, shares up about 65 percent in just the past 33 trading days.
So we will go ahead and leave it there for today. Once again, this has been the Hot Stocks Outlook for January 16th, 2026. Thank you all for watching. Best of luck out there, and bye for now.


