


Register for a Free Live Training
The Hot Stocks Outlook uses VantagePoint’s market forecasts that are up to 87.4% accurate, demonstrating how traders can improve their timing and direction. In this week’s video, VantagePoint Software reviews forecasts for Boeing ($BA), Imperial Metals ($IPMLF), Sea Limited ($SE), AMC Entertainment Holdings ($AMC), Scorpio Tankers ($STNG)
HOT STOCKS OUTLOOK INTRODUCTION — JANUARY 2, 2026
Hello again, traders, and welcome back to the Hot Stocks Outlook for January 2nd, 2026. Hope you all have had a nice New Year and, of course, are ready for the next year of trading. Uh, and so, of course, today we’re going to take a look at the most recent Vantage Point AI predictive forecast. So, if you haven’t already, be sure to go ahead and click the link down in the description below and get signed up for a live demonstration, and you can learn all the specifics about how these predictive indicators and technologies are helping traders make much better trading decisions out in the marketplace. Uh, and so we’ll go ahead and really highlight how all of these, uh, indicators and predictive tools work together. Uh, and we have some good examples, but a lot of sort of choppy price action around Christmas and then the New Year holiday, especially with these being right in the middle of the week.
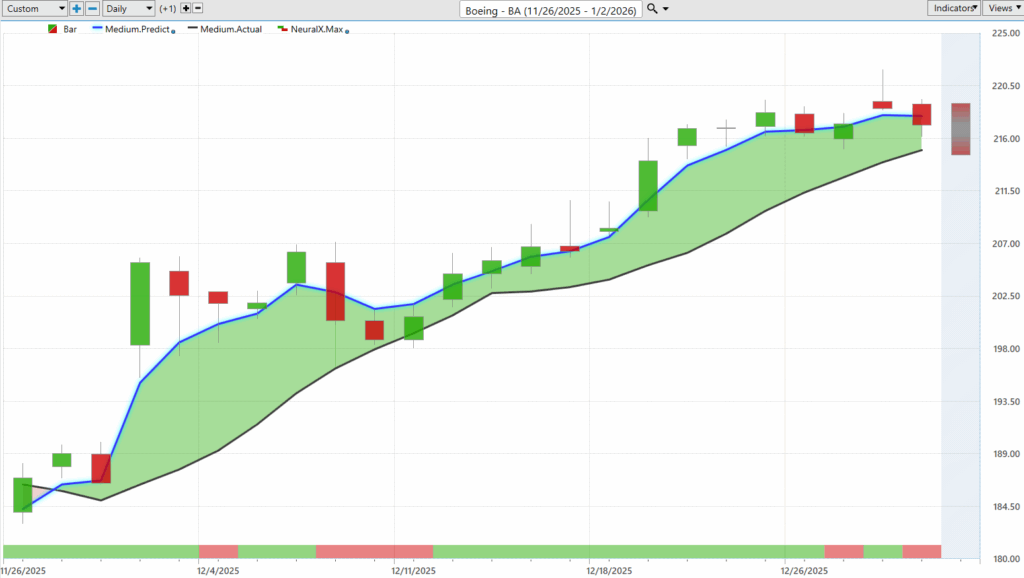
But we can start out here with Boeing. It’s a really great example of how all of this works together. And so what we’re looking at here is daily bars and candles, where each one of these trading days, or these candlesticks, would represent a full and complete trading day. And it’s right up against all that price data that the first indicators we want to take a look at is this black line and also the blue line value. And so the black line that you’re seeing on the chart there, this really acts as a Vantage Point user’s baseline. It’s actually a simple moving average, very simple tool. It is just going to look at the previous 10 close prices, add those all together, and then divide by that number. The, uh, really the weakness with a lot of traditional technical analysis like this is that all the data comes from the past. So, it’s really just reconfiguring what’s already occurred, and it’s only able to analyze one market at a time. So, it’s really just dragging the data forward, reconfiguring that 10-day simple moving average, uh, and then getting dragged along by whatever the subsequent data is.
Whereas Vantage Point traders are able to compare that baseline value to this proprietary predicted moving average. And so, for this number, essentially this price to get calculated and plotted on the chart every evening. Well, this is where the technology of artificial neural networks come into play. And they’re performing what we would call intermarket analysis. And so what that means is that rather than just looking at past prices for a single market, Vantage Point’s artificial intelligence and neural networks are looking at dozens of other markets that are known to drive and influence the future prices in this specific target market. And so that can be things like ETF groups that maybe wrap up a bunch of defense contractors in the defense space. Um, this can be individual stocks, but this really goes global. It’ll look at things like global currencies, major global indices, uh, interest rates, and even potentially commodities where applicable, whether that be gold, silver, commodity markets, and it takes that into account specifically for, again, that target market, and uses that data, that information, to produce predictions on where price is headed next.
And so whenever we see this blue line cross above the black line, what’s suggesting that these average prices are going to start moving higher and traders may want to look and take a long position. Uh, so we see here, as far as shares of Boeing goes, since that blue line crossed above the black line, have shares up about 16% over the past 23 trading days. And again, as long as that blue line remains above the black line, and often when there’s a lot of separation, that indicates a very strong trend. And so, uh, this really helps traders identify the overall trend direction, but that’s not the entirety of these predictive tools and indicators.
If we look at the very bottom of the chart, you’ll see this bar that goes from green to red, back to green. Uh, and this gets updated every single trading day, but it’s solving a different problem for the trader, and that’s very short-term strength or weakness over the next 48 hours. And this has a very high level of accuracy associated with it. So, upwards of 80-plus percent on a very wide range of markets, and that’s consistent. So it gets this right about 85, almost eight or nine times out of 10. And we can combine that with the predicted moving average to get an anticipation on, hey, when’s there’s likely to be some short-term price weakness potentially within the uptrend. So you see here the neural index goes bearish. We get, uh, really a couple days of strength, but then settle back in again. Neural index bearish, couple days of weakness here, but that blue line remains above the black line, and that’s very important.
Again, we see that neural index going bearish after this little up day. Uh, and we see we’ve really just kind of run sideways here for the past few trading days, but overall the trend still bullish here. And so, nice move so far out of, uh, Boeing, but that’s, again, not the entirety of these predictive tools. You’re also provided a predicted high and a predicted low range. So, this is where things get very exciting for, uh, position and short-term day traders.
Whether you want to add to a position or take advantage of that short-term price action within the day. But we see here we can look back and say, well, how accurate are all of these predictions against the actual market data? And so, this is where traders can actually utilize tools like the Intelliscan, identify, hey, where are these markets in strong uptrends, and where should I be looking for these opportunities to buy at these Vantage Point predicted low levels? Um, each week we often see these situations like this where all the price data on the previous day, uh, is on the bullish side of things, and sure enough the next trading day moves right down to that previous predicted low.
So it’s offering you some very valuable levels to have on your radar to do some of that short-term trading and trade management here. Uh, and again, nice move again over the past few weeks here in shares of Boeing. We’ve also seen Lockheed and BAE, a lot of these defense contractors, actually perform quite well. Uh, we’ve also spent a lot of time around silver and the metals markets. And here’s another example how we see a lot of strength in this sector of the marketplace. A lot of these predicted moving averages very bullish throughout the metal and mining space.
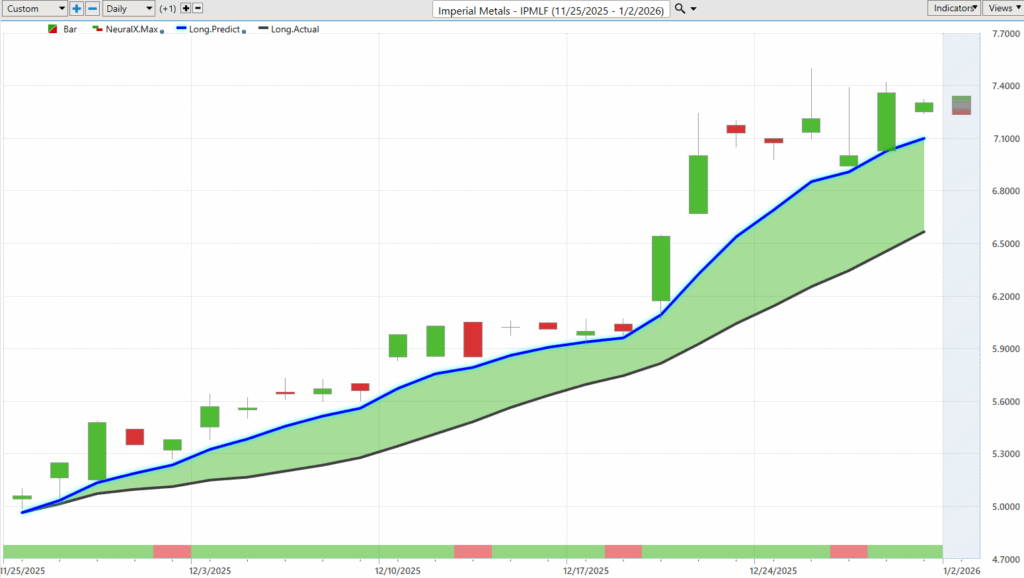
And so here in Imperial Metals, we can take the same approach with that blue line crossing above the black line. Uh, neural index bullish. Here you see we get these little dips of sideways price action when the neural index goes bearish. But these predicted highs and lows really guide the trader moving forward. So you really understand, hey, where do I want to be a buyer in this market if I want to participate.
And you see getting numerous opportunities on the bullish side here to buy, take profits on long positions. Um, you know, potentially if you have an order waiting down here, you’re going to get filled at the open, and then you see the market immediately, uh, continuing that uptrend there. So about 1, 2, 3, 4, 5, 6, 7, 8, 9, 10, almost 10 opportunities, uh, just over the past few weeks where, again, the silver metal mining, uh, space has done very well. Uh, previous Hot Stocks Outlook, we look at, you know, Alcoa, uh, Reliant Steel and aluminum, SLV, the silver market itself. Uh, here we see a 40% rally in just the past 23 trading days.
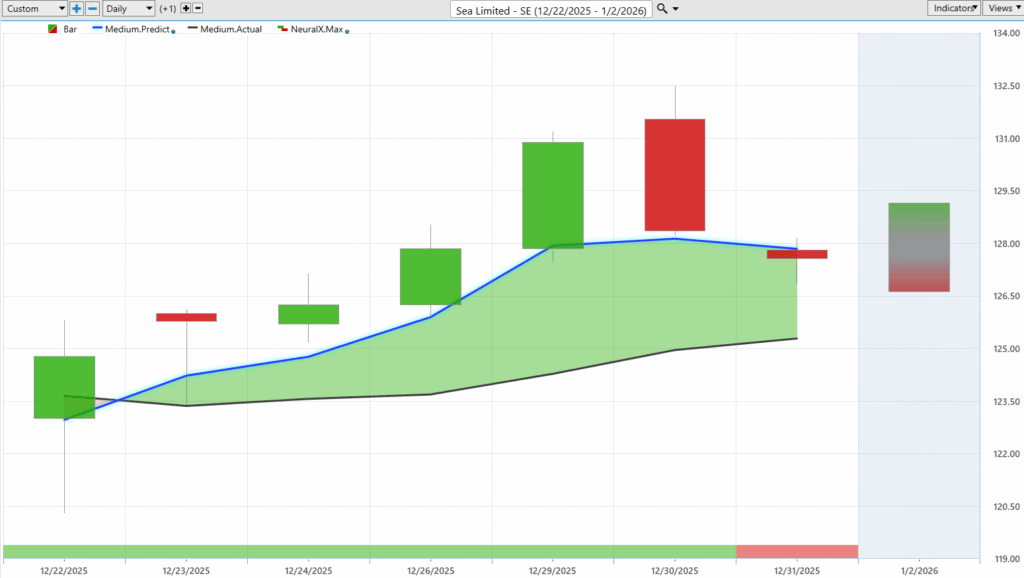
So, again, during that 40% rally, you know, a good eight and 10 positions, uh, moving on to the upside and continuing that uptrend. Uh, now here’s a new opportunity and notice a lot of strength in some of the international stocks. So here’s $SE. Uh, we see about five, six trading days ago getting that blue line crossing above the black line, uh, neural index very bullish here, and a lot of separation between that blue line and the predicted moving average and the actual moving average. Uh, and more recently getting this consolidation, market moving back towards these predicted lows, and sure enough today we’re seeing a very strong move higher, uh, again here in SE.
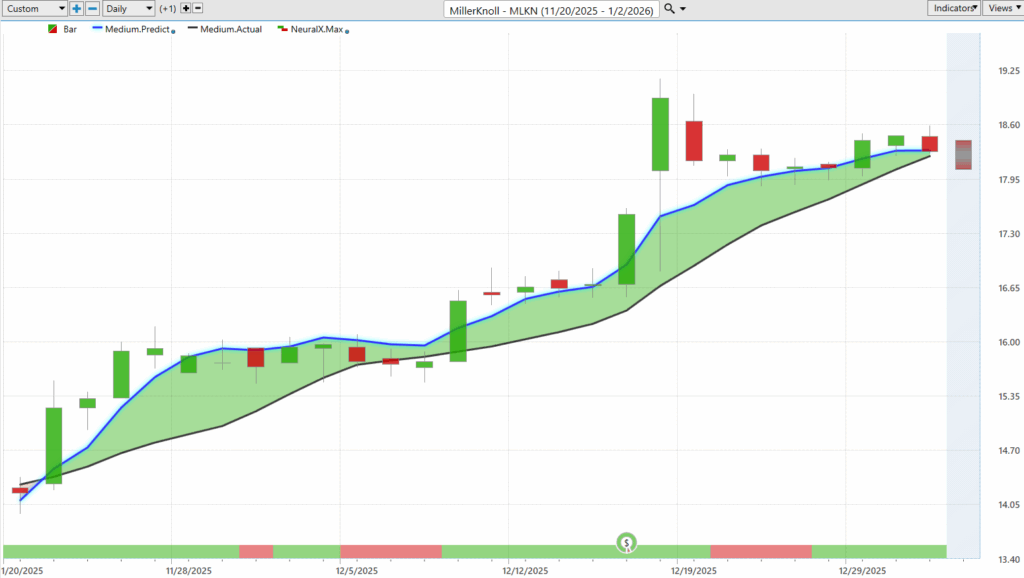
And just a lot of, again, the international stocks actually performing pretty well here. Um, here’s Miller Knoll, this actually being, you know, Herman Miller, uh, furniture, uh, distributor here. Blue line crossing above the black line, a really good example here of how the neural index works in combination with this, right? Neural index goes bearish. You’re getting sideways price action. So, you understand, don’t expect this momentum, um, currently in this market, but the overall trend is still bullish. We’re not seeing that blue line cross below the black line again. After we get this strong move after earnings, neural index goes bearish. But as it gets bullish again, shares start to pick up. The overall trend resumes.
Of course, traders can combine that with the Vantage Point predicted highs and lows and get a really nice road map here of, okay, well, when are we getting down to those very advantageous levels to take a position, uh, and exploit that bullish trend that’s playing out in the market. So, here in Miller Knoll, uh, seeing a very nice move here over the past few weeks, about a 22% rally over 26 trading days.
AMC Entertainment Holdings ($AMC)
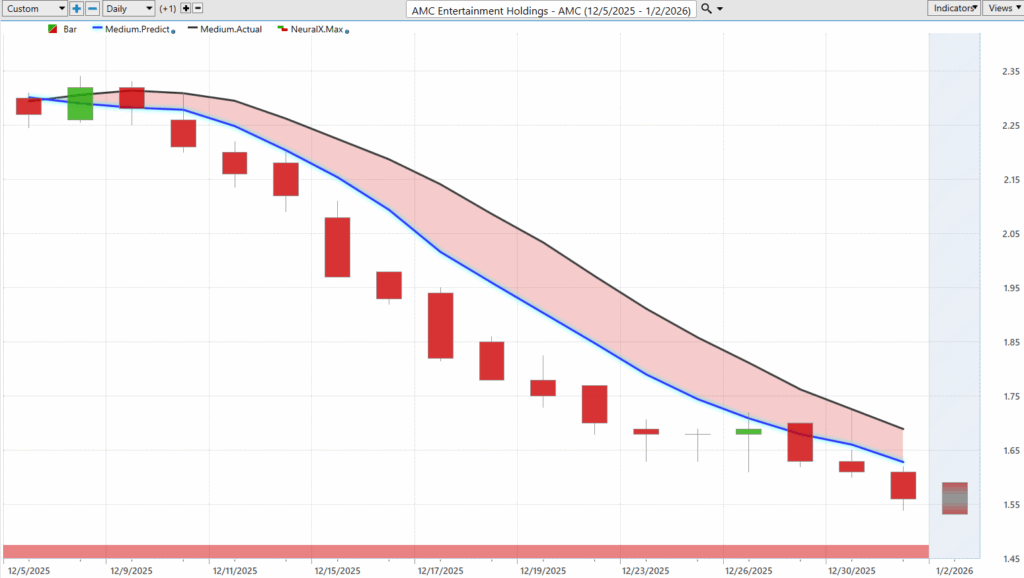
Um, and now we can just pivot to some of the weakness in the market. So, uh, here’s AMC Entertainment Holdings, and it doesn’t get much more bearish than this. Here you see this blue line crossing below the black line, neural index just saying expect this market to just keep going lower, day after day after day. Uh, and of course our predicted high and low ranges will also assist with that, saying, look, expect the range to start slanting lower here.
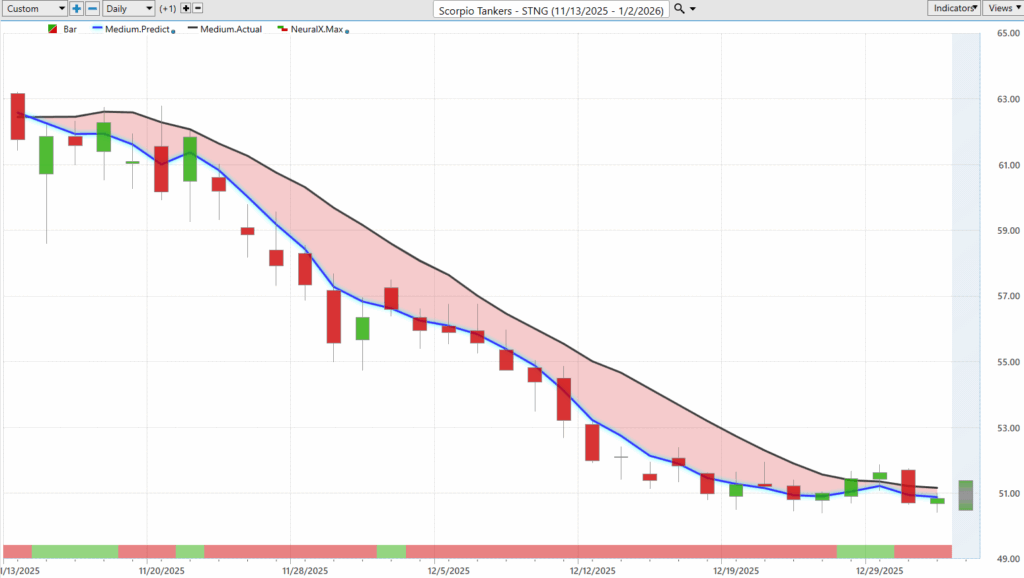
If we move up towards these predicted high levels, well, that’s an area to actually short, uh, and take profit on some short opportunities. Uh, you see this getting very, very beaten down here, down about a $150 a share, uh, after another 32% decline here just in the past 17 trading days. Also, energies have been quite weak, uh, both on the commodity side and these individual stocks, and here’s Scorpio tankers. Very similar situation here, and a good example of really the conflict between the indicators here, where we see the trend is going lower, but notice the neural index is bullish.
So it’s telling you expect that short-term strength over the next couple trading days. But as those couple trading days play out, you’re just seeing more separation between that overall trend. Neural index gets bearish, and we start to see things really decline, uh, as that neural index remains bearish and a lot of separation between that predicted and the actual moving average. Uh, and of course those predicted highs and lows letting you know, hey, if we get that strength over the subsequent trading days, you want to be shorting up at these predicted highs.
Uh, and certainly expecting this market to resume the downtrend lower. So, uh, again, we’ve gotten a mix of markets. We’ll see how things sort of settle out going into the new year, getting through some of the holiday disruption here. But here, about an 18% decline over the past 31 trade days. So, again, there’s really great features here within Vantage Point, um, within Vantage Point’s Intelliscan to actually help us identify, hey, where are these fresh crosses happening, where those new opportunities opening up, or you can potentially find those areas where there’s, again, that lot of separation and really strong trends in play, uh, to exploit and execute your trading strategies.
So, we’ll go ahead and leave it there for today. But once again, this has been the Hot Stocks Outlook for January 2nd, 2026. Thank you all for watching. Best of luck out there in the new year. Thanks again, and bye for now


