


Register for a Free Live Training
The Hot Stocks Outlook uses VantagePoint’s market forecasts that are up to 87.4% accurate, demonstrating how traders can improve their timing and direction. In this week’s video, VantagePoint Software reviews forecasts for ULTA Salon Cosmetics and Fragrance ($ULTA), Imperial Metals ($IPMLF), ACM Research ($ACMR), FedEx($FDX), Methanex ($MEOH), OKLO ($OKLO)
HOT STOCKS OUTLOOK INTRODUCTION — JANUARY 9, 2026
Hello again, traders, and welcome back to the Hot Stocks Outlook for January 9th, 2026. Hope you all have had an excellent week out there in the financial markets. And as always, we’re here to take a look at the most recent Vantage Point AI predictive forecast.
So, if you haven’t already, be sure to go ahead and click on the link down in the description below, and you can get signed up for a live demonstration, learn all the specifics about how these predictive indicators and technologies are helping traders make much better trading decisions out in the marketplace.
ULTA Salon Cosmetics and Fragrance ($ULTA)
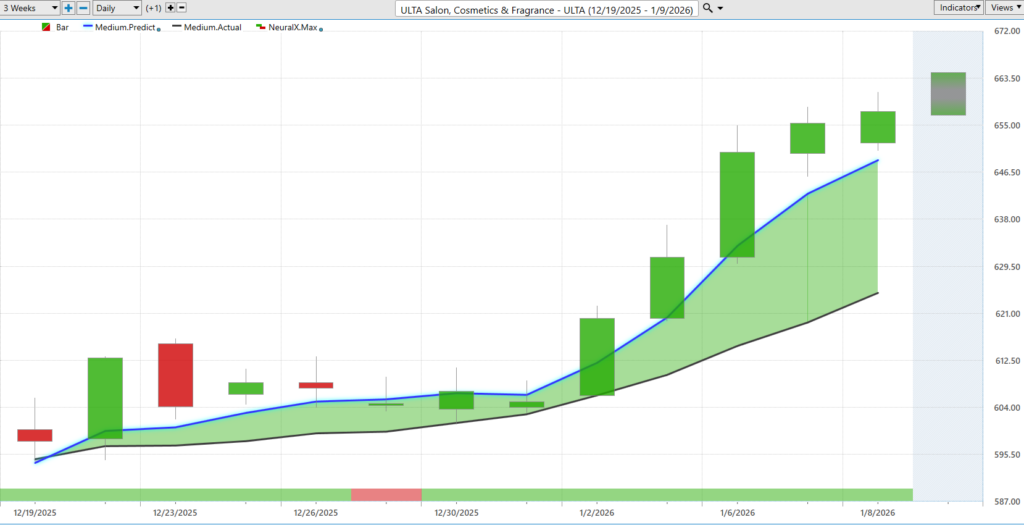
Now, uh, we have a lot of examples here. I’ll try to get to every single thing here, but, uh, really nice example of how all of these tools work collectively in shares of Ulta Salon and Cosmetics & Fragrance ($ULTA). And so, what we’re looking at here in Ulta is, as always, daily bars and candles. All of these predictions generated by these AI neural networks are working off of that end-of-day data.
And you’ll notice that against those daily bars and candles, there’s a black line and also a blue line value. And so, the black line value, well, that is actually a simple moving average. This is a very common technical analysis indicator, and this really acts as a baseline for Vantage Point traders.
But really, the weakness with traditional technical analysis like this is that all the data really just comes from the past and reconfigures what’s already known about the market. What’s already occurred has no predictive capability. Additionally, it’s only looking at one market in isolation. And the reality is markets share very important relationships from market to market, whether that be in between individual stocks or ETF groups or futures and commodities markets.
And so what Vantage Point’s able to do is use that black line as a baseline, but Vantage Point can take that and compare that to this proprietary predicted moving average, this blue line value on the chart. And for that number, which is essentially going to be a price that’ll get calculated and plotted on the chart every evening, well, that is generated via the artificial intelligence.
And it’s performing what we would call intermarket analysis. And so what that means is that rather than just looking at those past prices and what’s already occurred in Ulta, this is looking at dozens of markets that are known to drive and influence future prices. So this can be things like other individual stocks. This can be ETF groups potentially in the cosmetic and retail space, but this goes all the way down the line, really globally, looking at things like currencies, global interest rates, uh, and even particular commodities like silver, gold. You’ve seen a lot of moves in those markets, oil for energy stocks.
And it takes all of this into approach and really pulls out some very important price clues as to where prices are headed next. And it’s using all of that information to generate highly accurate predictions on price.
Now, when it comes to these predicted moving averages, well, this helps traders identify these trend shifts in the market. So whenever we see that blue line crossing above our baseline of the black line, well, it’s suggesting that, hey, these average prices are going to start moving higher, and traders may want to look to take a long position.
So we see here from that crossover coming through, market’s up about 9% just in the past 12 trading days. But things get very exciting from here because we really drill down on different problems that traders need to solve depending on your trading strategy and approach.
So when you look at the very bottom of the chart, you’ll see this bar, and every single day this is going to get updated. It could be green, could be red. And what it’s doing is predicting short-term strength or weakness in the market over really just the next 48 hours. So it has really a time component to it, looking ahead at really the next couple of trading candles.
And so you’ll notice that as the blue line cuts above that black line and the trend moves to the bullish side, neural index gets bullish here, and we get some sustained momentum, uh, and the market moving higher. But notice as the neural index goes bearish, well, what happens? We get a couple of days of weakness from that point. But even the next trading day, moving up to a green configuration, and within 48 hours, the market is accelerating into this uptrend.
So, really nice opportunity here. And lastly, what’s really exciting about this is you’re not only provided with the overall trend, an expectation of short-term strength or weakness in the market, but we’re also provided a predicted high and a predicted low. So now we’re down to intraday price levels on where we expect the market to trade.
Uh, and so this can help day traders as well as swing traders add to existing positions. Uh, and so when we look back and say, well, how accurate are all of these predictions against the actual market data? So we’re going to get a new trading day in Ulta. We’re going to see the actual market data fill in here, see how accurate these predicted highs and lows are.
But you see how this works, and it really provides a robust and rounded forecast to help traders know what to expect. Uh, so as that crossover moves to the bullish side, we say, okay, well, look down towards these Vantage Point predicted lows. Notice how the market closes down towards that predicted low. Uh, we move again. It actually tells you, look, expect the market to potentially trade lower, right? You wouldn’t want to have stop losses sitting up in this area.
Uh, but then it adjusts and says, hey, look, new predicted low down at these levels. You see three days in a row moving down towards that prediction and then starting to move higher. Uh, and more recently, as this momentum kicks into the market the last couple of days, again moving down towards that predicted low and immediately trading higher.
So really all the information one needs to say, okay, well, where are these trends shifting to the bullish side? We have features like the Vantage Point Intelliscan that will actually identify those fresh crossovers. And that’s where this software really excels, is not only helping you to manage the opportunity but potentially find new opportunities and new shifts in markets that are tradable.
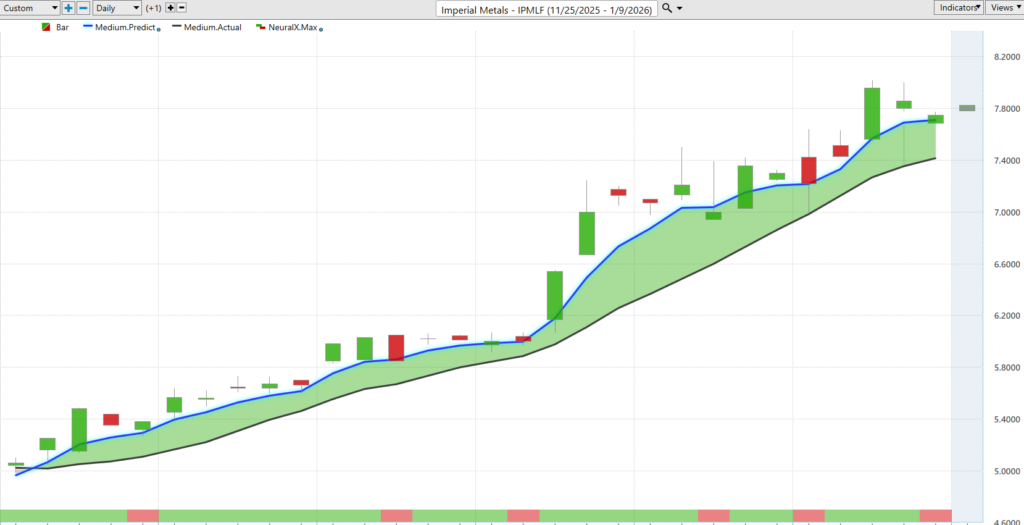
Now here’s Imperial Metals ($IPMLF). Just want to bring this through really quick because we talked a lot about Alcoa steel and aluminum stocks. Uh, well, here in Imperial Metals, if we go back the last four trading days, this is actually Friday from last week.
And so as we update those forecasts and say, “Okay, well, what’s occurred over the past, you know, four trading days, and this will be Friday coming into the next week,” uh, well, not only have we had a really strong trend, numerous opportunities where that predicted low is being hit and the market going higher, but just this past week, okay, well, there’s Monday moving down towards the predicted low, another close right at that level, and then the market pretty immediately starting to resume this uptrend over the next couple of trading days.
Just a really strong breakout market, up just 10% just during the week here, uh, getting started moving into, uh, this next trading week.
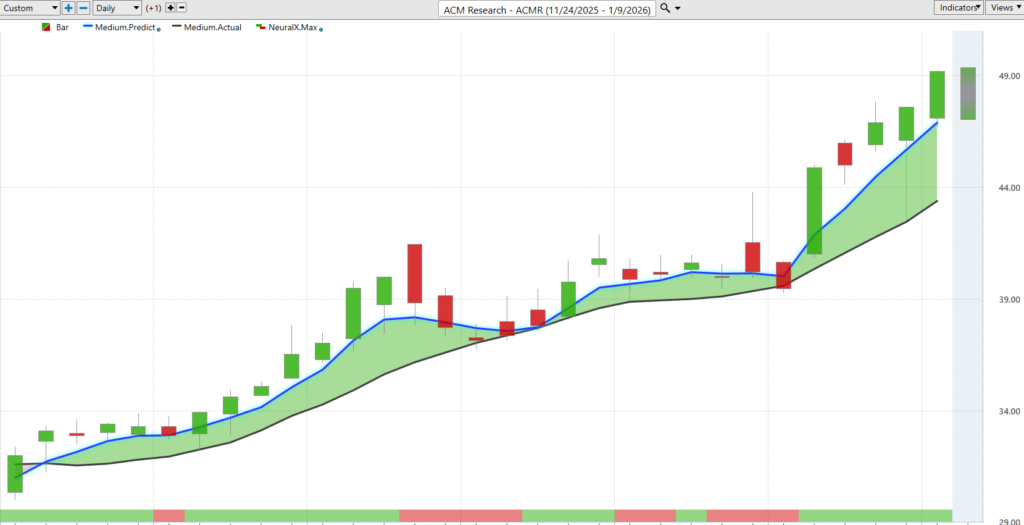
Um, ACM Research ($ACMR). Here’s ACM Research. So again, another great example of how all this works together. Notice the blue line crossing above the black line, indicating that trend shift.
And you’ll get these periods where the neural index, you see we get bearish here. There’s a little bit of a down day the next trading day. Uh, day after that, again, getting some weakness, and the market still trading at those recent closes. But again, that neural index very quickly saying, hey, there’s strength here, the trend is up.
Again, get this other period where we get a little sideways and drawdown price action, but the blue line never crosses below that black line. Again, neural index bearish, we get some sideways price action. But when we can take all of this and, of course, combine it with those predicted highs and lows, you have a very strong roadmap of, okay, well, if I’m going to be a buyer, if I’ve identified this opportunity, where do I want to come in and accumulate a position?
And you see really, with all this noise, look at those entries down at the bottom part of the daily ranges, uh, and the overall trend moving to the bullish side. So really nice opportunity here in ACM. Uh, this company does a lot around semiconductor manufacturing, but overall the trend now up 49%, almost 50%, uh, just in the past 29 or 30 trading days.
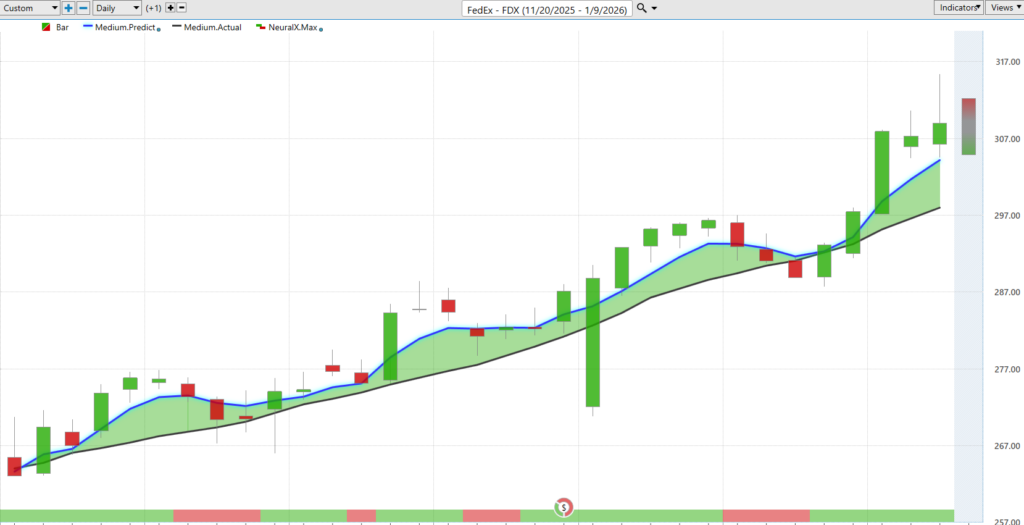
Uh, here’s shares of FedEx ($FDX). FedEx. And I like bringing through these examples around earnings because the Vantage Point software does a great job day-to-day analyzing its information and then forecasting those short-term forecasts, but it doesn’t know that, hey, there’s going to be earnings, potentially a lot of volatility around that earnings report, right?
A lot of volume can move in. There’s a lot of indecision. Uh, but notice how quickly the Vantage Point forecasts get back online. So we get this crossover. You see every single day saying, “Hey, look down towards these predicted lows. The market is in an uptrend.”
You get a lot of this noise around earnings, but once earnings is over, right back on track, saying expect the market to trade down towards these predicted levels, continue the uptrend. And again, even this week, moving down towards, uh, Monday’s predicted low, pretty much at the open, a gap down, uh, and really immediately trading higher here.
So really nice opportunity here in shares of FedEx, about 5% this week, a little bit more than that. If we go back towards, uh, last month, and we see the market’s up about 15%, almost 16% here, uh, just in the past 31 trading days, and clearly a lot of strength here, uh, recently here as the market starts breaking out to new highs.
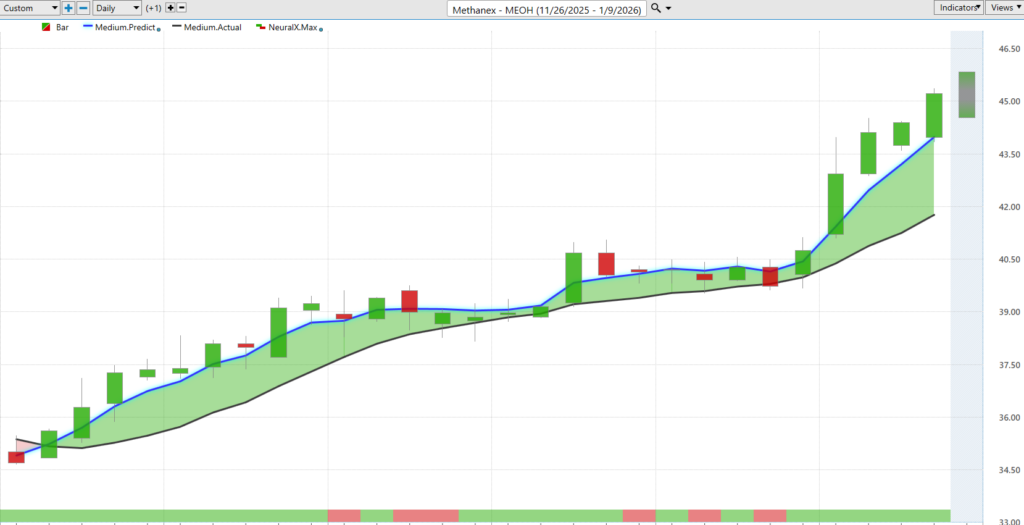
Uh, here’s Methanex Corporation ($MEOH). So again, Methanex, a very straightforward example: blue line over the black line. Notice these periods where the neural index goes bearish. And remember, this is just a 48-hour forecast.
And it gets this right with an extremely high level of accuracy, upwards of 85%, 86%, on whether that market’s likely to go higher or lower over the next 48 hours. And so it’s very helpful in the context of an existing trend to know, hey, expect some weakness, right?
You’ve had a really strong rally. That’s great. You potentially have a lot of unrealized gains there. But after this trading day, saying, hey, don’t expect this trend to resume. Expect things to settle down, at the very least go sideways and possibly lower over these subsequent 48-hour periods.
But as that neural index starts to get bullish, you see the overall trend, blue line still above the black line. And very clearly here, hey, you want to use those Vantage Point predicted lows, if anything, uh, to accumulate a position at lower prices.
And so you see here again, it’s day after day moving down towards these predicted lows. Uh, it’s not going to hit it every single day, especially when you get these really strong rallies. But you see how just before these rallies take off, multiple levels to accumulate, uh, a position here.
Uh, and Methanex here making a very, very strong move upwards of about 25% over about 27 trading days. Uh, and of course, multiple opportunities within that trend to buy at those predicted lows, uh, taking little pieces out of the market as the market goes higher.
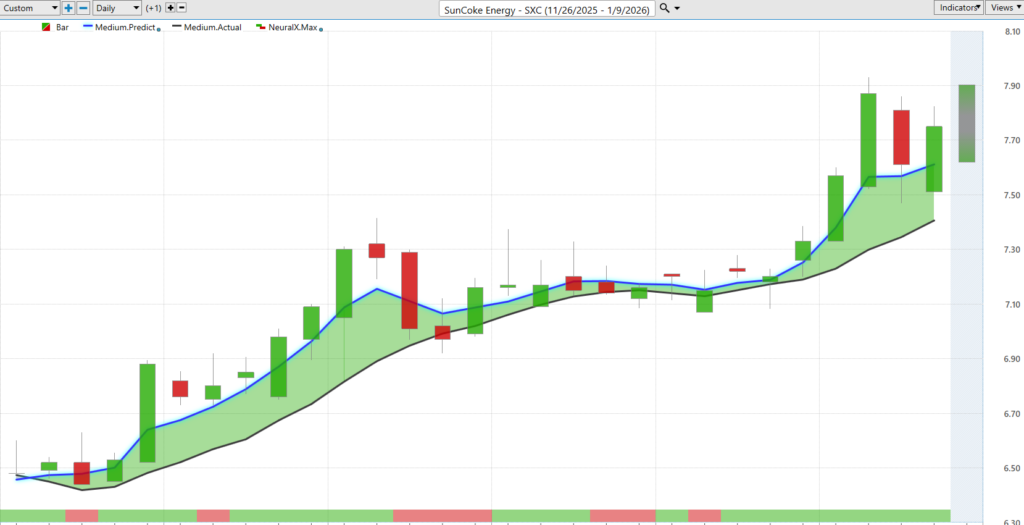
Um, now within some of the metal and, uh, steel and aluminum space, here’s SunCoke Energy ($SXC). SunCoke Energy. So they really deal in, uh, specialized coal for steel smelting.
Uh, here, same thing as we see in Alcoa, Imperial Metals, Reliant Steel, all these stocks in a sector doing really well. Uh, blue line above the black line here. Uh, you get a little noise around the neural index here, a little bit of a gap down going lower.
Um, and then same thing here, right? Here’s your gap down, market gapping lower, but the overall trend, that blue line, very much above the black line. Uh, again, we got our neural index bearish here, a couple of periods of just sideways price action.
But when we can take all of that and combine it with the Vantage Point predicted highs and lows, every single day you’ve got a roadmap moving forward of where you might want to be a buyer in a particular market and then an expectation.
So even see here as the neural index is still bullish, it’s telling you actually, hey, expect the predicted low to actually move lower here, right? We may have an expansion of the range there. Uh, and sure enough, the next trading day, again, expect things to go a little bit lower.
Uh, and even here, these things are very exciting. And when you get comfortable with the software, well, you see this quite a bit, where you see this predicted low value of 746 never gets hit. The market just continues higher, and the next trading day you move to 747, and then the trend continues, uh, towards the bullish side here, as this market clearly in a strong bullish trend.
A lot of strength recently from the neural index. Uh, and as we look back, the very cheaply priced stock gets a very large, uh, percentage appreciation of about 19% just in the past 27 trading days.
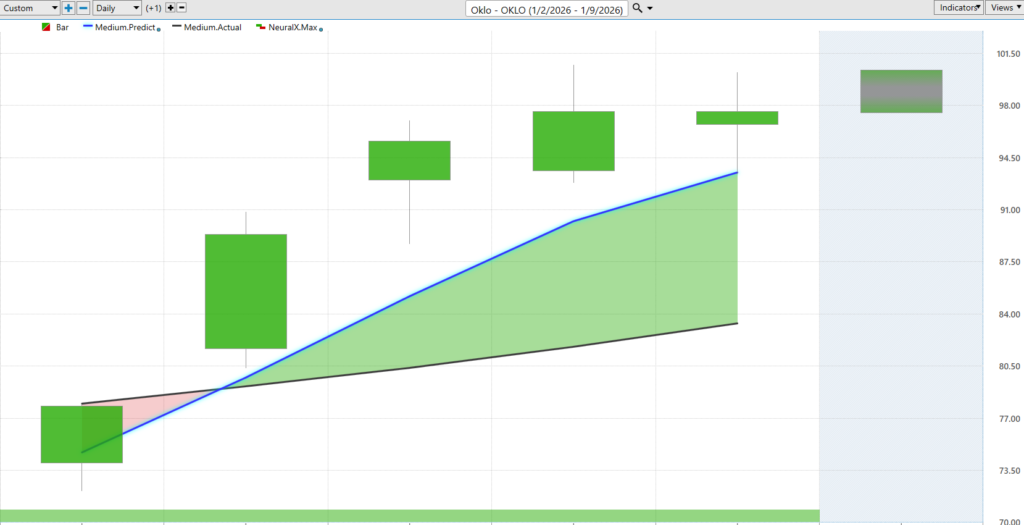
Uh, and lastly here, I know we have a lot of markets this week, but Oklo ($OKLO). A lot going on around nuclear energy. So, here’s shares of Oklo. Uh, there’s also shares like SMR, uh, the nuclear ETF, a lot of these looking very bullish.
And we see just this week, actually on Monday, saying, “Hey, blue line has crossed above the black line.” You see the neural index bullish every single one of these trading days. And then you’ve got that roadmap that says, “Okay, well, if you want to establish a position, ideally get in at these predicted lows.”
Even yesterday, uh, moving down, opening at the predicted low and really seeing a very strong move and continuation of trend here.
So, uh, we’ll go ahead and leave it there for today. Once again, this has been the Hot Stocks Outlook for January 9th, 2026. Thank you all for watching. Best of luck out there, and by for now.


