


The Hot Stocks Outlook uses VantagePoint’s market forecasts that are up to 87.4% accurate, demonstrating how traders can improve their timing and direction. In this week’s video, VantagePoint Software reviews forecasts for First Solar (FSLR), NVIDIA ($NVDA), Enphase Energy ($AENPH), Apple ($AAPL), Paypal ($PYPL) and Molson Coors ($TAP)
Register for a Free Live Training
Hello, again, traders. And welcome back to the Hot Stocks Outlook for July 2nd, 2021. Hope you all are having a excellent week out in the financial markets and as always plenty to cover here in today’s outlook. So we’re going to take a look at a lot of these popular stocks over the past month here. We’ve got Apple, Nvidia, PayPal. We’ve had a really nice move in the market there. We talked about some of the food producing stocks. We’ll also take a look at Molson Coors Brewing and really spin the focus over the past couple months here, this grouping of stocks that had turned up really in the mid point of May and have continued moving higher.
So I really encourage traders to go back and watch the video in the Hot Stocks Outlook from May 20th, where we really talked about these shifts that are happening in the market. Now you can really understand, okay, where should that attention and focus be as far as the portfolio.
But focusing in here on Apple. So what we have here is a really good example of how all of the forecasts work here within VantagePoint. So whether we’re forecasting for Apple or Nvidia, or the S&P 500 futures, it all works the same way. And all of this is working off of end-of-day data. So each one of these candles is representing a full and complete trading day. And you should think of the forecast as utilizing that end-of-day data and generating a new predictive forecast based off of that sort of timeframe.
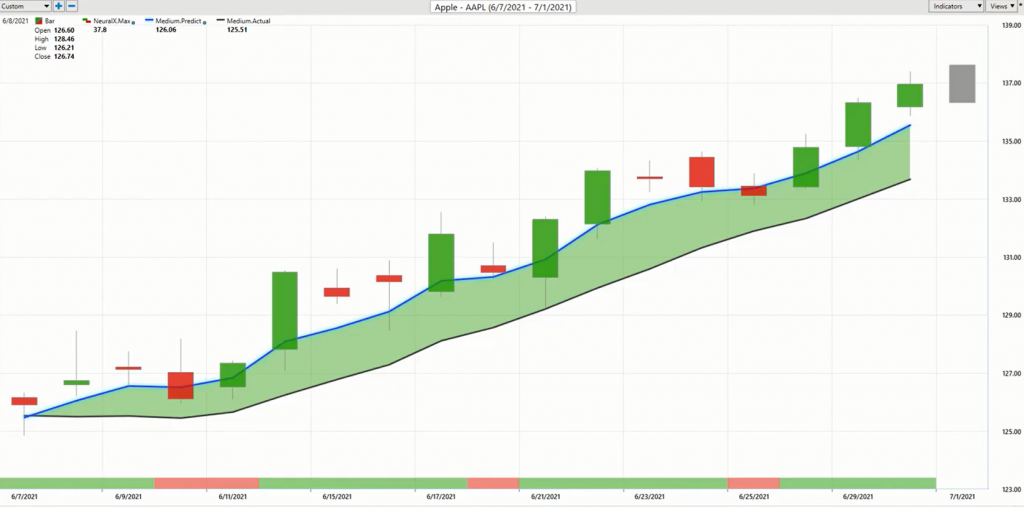
Now, right up against those daily candles, though, you’re going to notice that there’s a black line and also a blue line right up against that data. Now, the black line that you’re seeing there is a simple moving average or what we refer to as the actual simple moving average. And that’s a very common technical indicator in that it looks back, in this case over the past 10 closed prices, adds all those together, divides it by 10, and you get a good rolling measure of where market prices have been already over a given period of time. But see, the problem with that is that all the data is derived from the past. And so you’re really just looking at a summary of really smoothing out that price action, where have those average prices been?
But what we’re able to do with the technology found within VantagePoint is produce a predictive indicator. So, a forward-looking predicted moving average. And that’s what this blue line that you see right up against the chart is. But for that value to get calculated in sort of relationship to that actual moving average, VantagePoint has to perform, what’s called intermarket analysis, and it’s utilizing this technology of artificial neural networks to do it.
Now, this is very important to understand. Now Apple is a very popular stock, but it shares very important market relationships with other stocks, ETF groups, global commodities and futures markets. So these things are fairly obvious when we think of things like, the technology ETFs or individual stocks, perhaps like Nvidia or Intel or AMD. But you’ve also got things like global interest rates, the value of the dollar index or other major currencies, the value of crude oil and other major commodities. And what it’s able to do is understand these intermarket relationships, not only the big macro ones, but the subtle micro relationships that are happening as well, that affect short-term future price data.
And so what this is able to do is take that information, summarize all that and produce a actual prediction of where prices are expected to move going forward. So rather than having a tool, that’s just going to lag around, getting pulled around by the most recent close price, this is actually generating a true prediction of what’s going to happen in the future and uses that data to construct this average. So what that does is turn a lagging indicator into a forward-looking predictive tool. And whenever this blue line is crossing above the black line, it’s suggesting average prices are going to start moving higher, take your trading strategy and approach and act accordingly.
Now this isn’t the entirety of the forecast. We can think of this as a tool that’s designed to forecast average prices to help traders understand where is the bigger shifts moving in the market. But we also have this indicator at the bottom of the screen. And again, this is working off of end-of-day data. So you can think of the forecast as being the most recent green or red output, the very right-hand side of the chart. But what this indicator is doing and does with an extremely high level of accuracy, this is this 86% accurate really across all markets, a very high level on average, at least above 80%.
And so what this does is it’s able to look at very short term strength or weakness in the market, not average prices over a longer term window, but very short term. It’s actually tuned to be a 48-hour indicator so that every new forecast is looking ahead, 48 hours and determining that short-term strength or weakness. And that can help you with trade management, but also knowing that, hey, if you want to be long in the market and there’s short-term weakness, well, maybe look to buy on the dip, but if the overall trend is up, sits tight, use your additional levels to help you manage a situation. Now, what I mean by additional levels are you’re also provided every single trading day, a predicted high and a predicted low.
So let’s really wrap all this up as far as the overall forecast. You’ve got the overall trend direction, short-term strength or weakness over a 48-hour window, but then also predicted high intraday levels that adjust each and every trading day to help you know, what to expect in the market, even over that intraday timeframe. And so what you can see is once you get that view that says, okay, the overall trend is up. I want to start taking long positions, but you need to be adaptive with how you manage that opportunity. And this is where the software is extremely adaptive as well of letting you know, look, the overall trend is up. If you want to be a buyer, you want to be a buyer down towards these predicted lows.
And you can imagine a scenario where, look, the overall trend is up. Even if the Neural Index is bearish, it’s only bearish over the next 48-hour window and the overall trend is up. And intraday, you’ve got price levels that you should be looking towards, of course, if you want to be a buyer and exploit that overall trend. You see you have about six entries here as the market continues higher and pretty much within a day of those entries, the market is moving into a profitable position and then continuing.
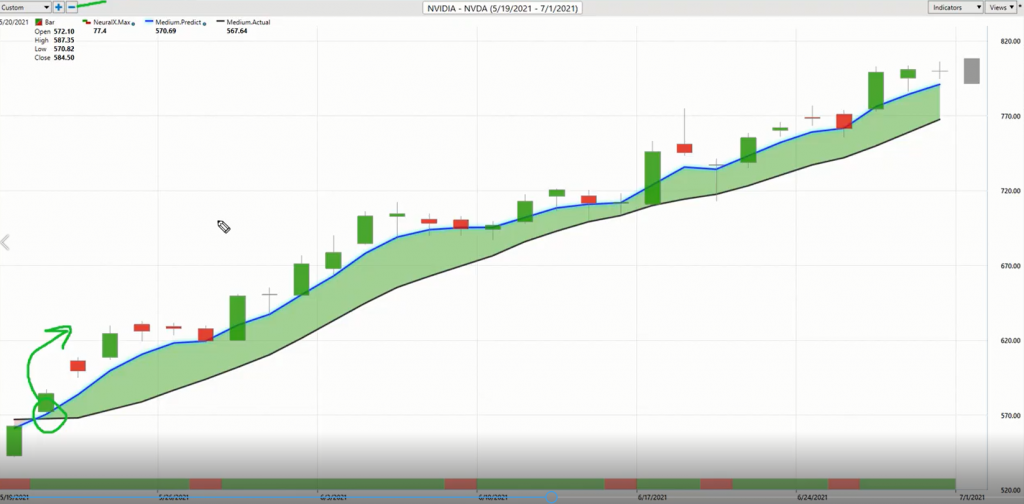
So as long as this blue line remains above the black line, the overall trend is up. And we have a lot of information, not just from Apple, but a lot of the other things that we’ve seen going on throughout the marketplace. You see here about an 8% rally, but six entries within that 8% to be a shorter term trader add to an existing position. A lot of ways a trader may manage these sort of opportunities here in Nvidia. So again, this sort of tech space doing very well. There’s very big, popular companies here. Well, how has it looked as far as trading and video shares over the past couple of months?
Well, very clearly you only want to be long. You see this Neural Index will go bearish five days out of the last 35 or so here. And then we’ve got that predicted low. So intraday, when you know, hey, if I want to get long in video shares, where do I really want to have limit orders, waiting to accept prices? And you see how you’re not going to hit that predicted low every single day, but you generally over a sort of weekly time period, get in on the lower part of the range. So that’s one, two, three, four, five, six, seven, eight entries as this market continues its uptrend. And you see things like this, and this is the stuff that really helps you understand, yeah, these tools are really picking up on things. Where you dip, you get this volatility, but look where the market closes. And then the next day you’re continuing higher here where, yeah, you get some volatility, but you’re closing in the range. Here, closing right at the low.
This is where day traders, if you’re only trading intraday and don’t recognize that, look, there’s a good entry right there, intraday, you’re not going to get much, but you want to be long here to really make money in this market as that overall trend continues. But you see here that it’s been very clear that if you want to get long, we know some areas that there is some strength in the market and you’ve got the help with those short-term forecasts that say, look, if you’re going to add to this position, do short-term trades, whatever you need to do, and video share’s up about 36% over the past 29 trading days, that equates to about a month and a half here on the calendar.
Over to PayPal, it’s the exact same thing. I mean, it’s very clear to say, okay, if you see the strength in these areas, if you want to get long in the market, find a place where that blue line is above the black line, where Neural Index is at least bullish or you’re looking for potential weakness to go ahead and get long if it’s bearish, but clearly here you want to be long. We can look at how accurate were all of those predicted highs and lows against the actual market data. And clearly if you’re going long, you’re focused on these predicted lows and taking profit at predicted highs, depending on your timeframe, right? If you’re short term, you may be taking profit up at these predicted highs and managing the situation.
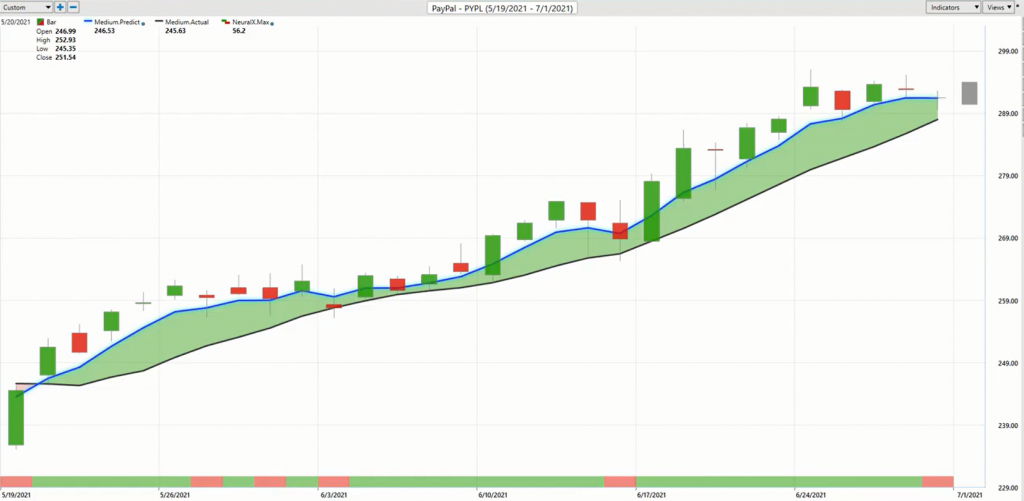
But very clearly here, you want to be long. And again, we can see one, two, three, four, five, six, seven, eight, nine, about 10 entries so far as this market continues higher here. So PayPal, another one of these really nice opportunities in the marketplace. And this is just generally. We’ve seen broadly there’s strength in many of these areas. We specifically talked about Enphase and for Solar here, but we also talked about specific weakness in the market. And specifically that’s been financials, food companies. We were looking at Tyson Foods and now the dollar’s really driven those lower.
Well, here’s Molson Coors. And you see a very similar situation of a blue line crossing the black line, a lot of weakness with the Neural Index. But what I just want to highlight here is we can see clearly this is an area where we knew you don’t want to be long, but even over these periods where the market is running sideways and not a lot is going on, you see Neural Index will get bullish here, bullish here. You get this sideways and higher highs over the next subsequent 48 hours of price action. But clearly, you only want to be short in a market like this and you see that yeah, nothing much is happening, but look how good these levels are doing as far as picking up these intraday price levels for you to take action, knowing, look, I only want to be short, but yeah, maybe we should cover some down here, short here, cover here. And it makes it much easier for you to manage that opportunity, improve your overall entry and still participate in the longer term move or longer-term trends.
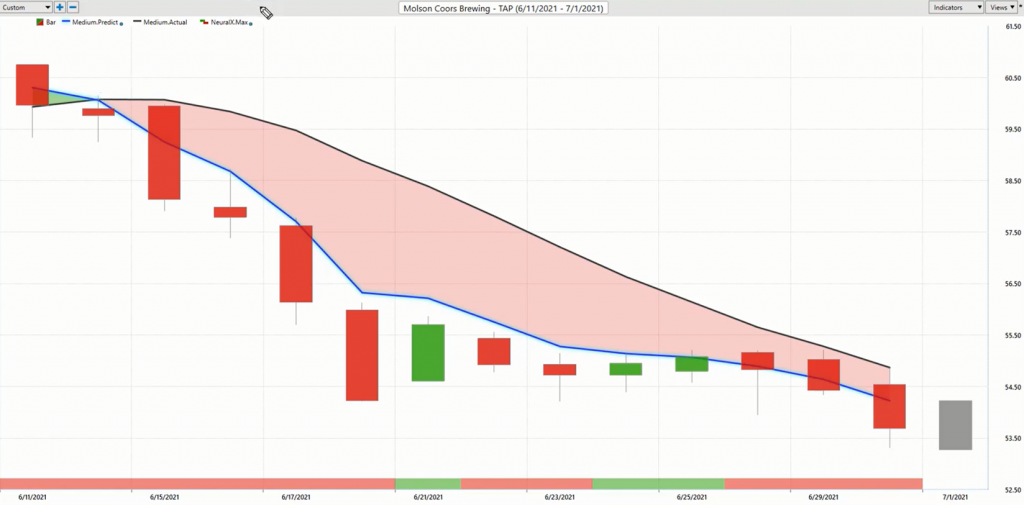
So again, back to this point of it hasn’t been hard to figure out where are the areas of weakness in the marketplace. And again, very clearly figuring out, well, where’s the strength coming in and where can we pay close attention?
So here’s Enphase Energy. This was just last week. We’ve gotten about a 13% rally in both Enphase and for Solar, which are the stocks that I went into a lot of detail all the way back in May 20th. And we’ve just walked this whole situation forward. If you remember, there’s a big drop off in the market on a Wednesday. By the Monday, everything’s coming to the upside as far as crossovers and trend. And the S&P has just remained in an uptrend since then.
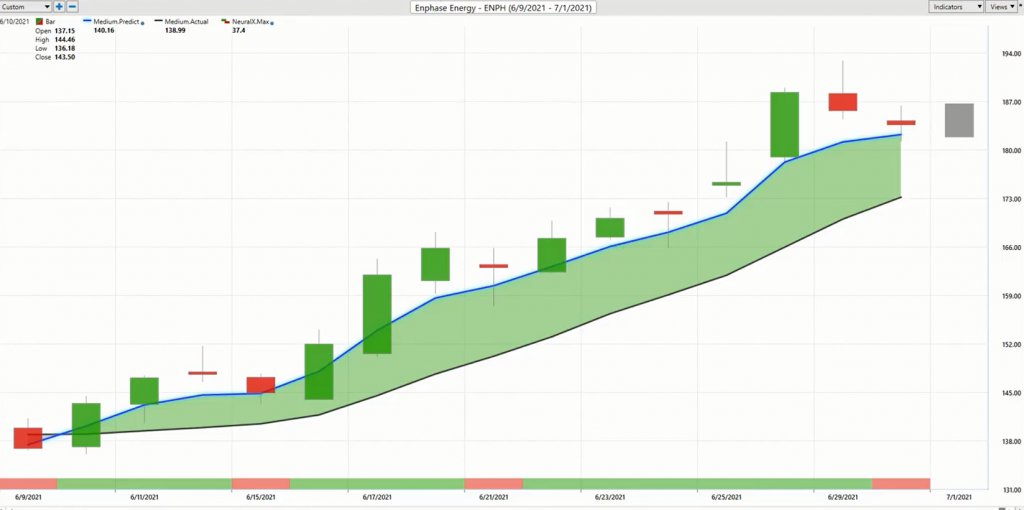
But here’s Enphase Energy just over really, since the last forecast. Here, you see predicted low being hit and getting about a 13% rally in shares, continuing on from these other entries from back here that we talked about last week and weeks before. So a really nice opportunity here, again, just trying to highlight this past week of saying, okay, even if we just say, okay, well, we identified areas of strength in the marketplace. How are those short-term forecast holding up? They’re holding up quite well as far as weekly entries, pretty excellent price to get involved. And we’ve seen things really expand to the upside.
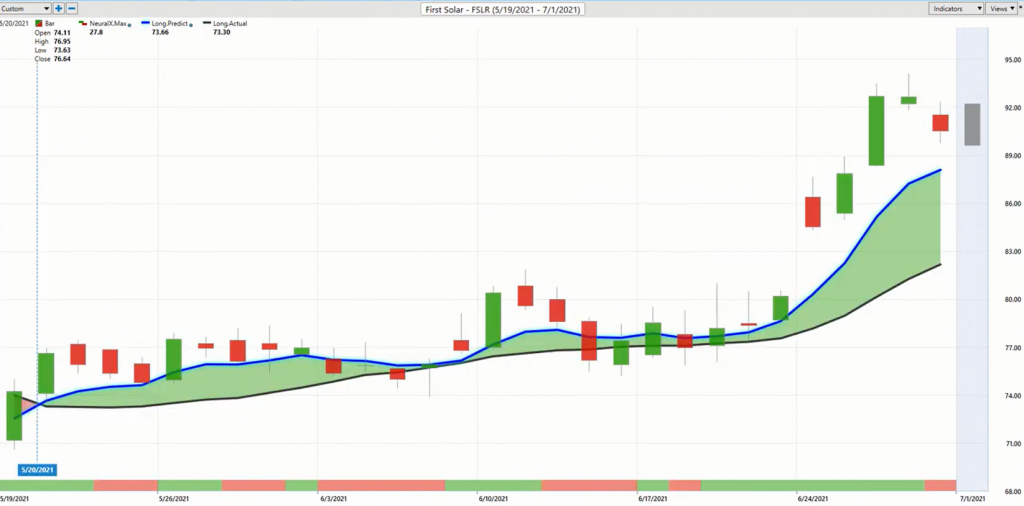
First Solar, we brought in this very long-term forecast from last week, and it just becomes very clear that this is very, very bullish. We started to see a lot of the short-term strength from the Neural Index and a lot of these markets that had turned higher and sure enough, you’re seeing gap ups and the trend really start to advance. And this is why we really spend so much time focusing on, where did these crossovers and trends start? Because if you can get in at the beginning of an opportunity, manage it with the help of those short-term predicted highs and lows, you get yourself in the right scenario where you have a position where you’ve been holding out for that longer term move. You know the overall trend. You’ve been able to take profits along the way, and then things really break out and really get you in a nice trending sort of situation with a lot of volatility that can work in your favor here.
And again, this is just the last week, 16% here, 13% here. And obviously some of these other markets, the trade management working quite well with some of these predictive indicators and levels that we get. So once again, this has been our Hot Stocks Outlook for July 2nd, 2021. Thank you all for watching. Best of luck out there. Thanks again. And bye for now.


