


Register for a Free Live Training
The Hot Stocks Outlook uses VantagePoint’s market forecasts that are up to 87.4% accurate, demonstrating how traders can improve their timing and direction. In this week’s video, VantagePoint Software reviews forecasts for Haemonetics ($HAE), First Solar ($FSLR), Cisco ($CSCO), Ventas ($VTR), Jfrog ($FROG)
VantagePoint AI Hot Stocks Outlook
June 5th, 2026
Hello again traders and welcome back to the hot stocks outlook for June 5th, 2026. I hope you all have had an excellent week out there in the financial markets. And as always, we are here to take a look at the most recent VantagePoint AI predictive forecast.
So, if you haven’t already, be sure to go ahead and click that link down in the description below and get signed up for a live demonstration where you can learn all the specifics about how these predictive technologies and artificial intelligence tools are helping traders make much better trading decisions out in the marketplace.
What we’re looking at here is daily price action. So all of the forecast work off of end-of-day data, which means each one of these candles that we see here will represent a full and complete trading day. Right up against that price data, you’ll first notice there is a black line and also a blue line value.
What the black line is, is actually a simple moving average. This is a very common technical analysis indicator. We refer to it as the actual simple moving average. In this case, this would be a 10 period. So, it just looks at the previous 10 closed prices, adds those all together, and then divides by that number.
That works as a good baseline for VantagePoint traders. But one of the problems with traditional technical analysis like this is that all the data comes from the past. So, it’s really just reconfiguring what’s already occurred in the market and has no predictive capability.
What VantagePoint’s tools are able to do is actually utilize artificial intelligence to generate predictive tools that actually look forward. That’s what we have here with this blue line value that you see on the chart. This is essentially a price that’s going to get calculated and plotted for traders every evening.
This is where that technology of artificial neural networks comes into play. What they’re doing is what we would call intermarket analysis. That means that rather than just looking at past prices of a market in isolation, VantagePoint is looking at the data from dozens of other markets that are known to drive and influence future price of specifically the target market here.
This can be things like individual stocks but also broader ETF groups potentially in the healthcare space, maybe not. This is what’s actually clever about this because artificial intelligence often finds these relationships spread out in assets that may not seem quite obvious but offer an advantage in producing a robust and consistent forecast.
Whether it’s stocks or ETFs, that’s obviously going to impact individual equities you might be trading. But it really takes this global in that it looks at things like the value of currencies, the bond market and interest rates, and even commodities where applicable.
If you’re trading an energy stock, that’s going to be weighted heavily by oil and natural gas. If you’re trading a mining company, that’ll be heavily weighted by the metal markets and some of the metal ETFs. So it really utilizes the data from all of these intermarket relationships and uses that to generate highly consistent and accurate forecasts.
Whenever we see that blue line cross above the black line, what’s suggesting that these average prices are going to start moving higher and traders can look to take a long position in line with their overall strategy, whether that be shorter-term day trading or a swing or position trade.
Haemonetics ($HAE)
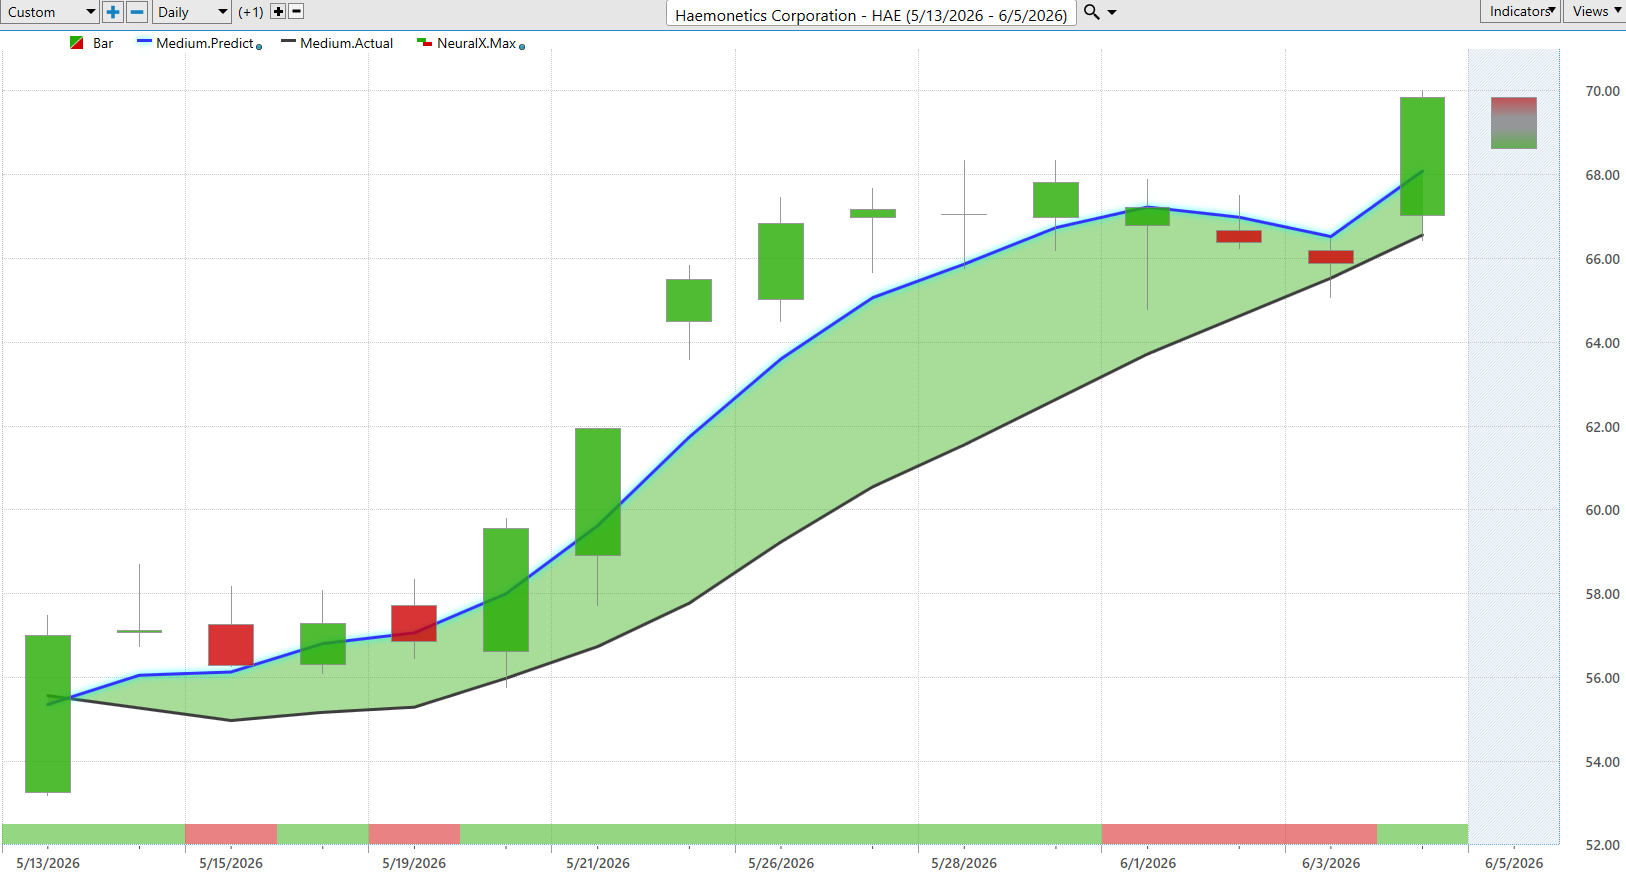
So, let’s go ahead and start out with shares of H AE. This is actually a stock within the healthcare space and a really nice example of how all of these Vantage Point AI predictive indicators work together. And so what it is that we’re looking at here is daily price action.
So all of the forecast work off of end of day data which means each one of these candles that we see here will represent a full and complete trading day. And it’s right up against that price data that you’ll first notice there is a black line and also a blue line value.
And so what the black line is is actually a simple moving average. So this is a very common technical analysis indicator. We refer to it as the actual simple moving average.
And in this case, this would be a 10 period. So, it just looks at the previous 10 closed prices, adds those all together, and then divides by that number. And that works as a good baseline for vantage point traders.
But one of the problems with traditional technical analysis like this is that all the data comes from the past. So, it’s really just reconfiguring what’s already occurred in the market and has no predictive capability.
And so what vantage points tools are able to do is actually utilize artificial intelligence to generate predictive tools that actually look forward. And so that’s what we have here with this blue line value that you see on the chart.
And for this price which you know that number essentially a price there that’s going to get calculated and plotted for traders every evening. Well this is where that technology of artificial neural networks come into play.
And what they’re doing is what we would call intermarket analysis. And that means that rather than just looking at past prices of a market in isolation, Vantage Point is looking at the data from dozens of other markets that are known to drive and influence future price of specifically the target market here.
Now, this can be things like individual stocks but also broader ETF groups potentially in the healthcare space, maybe not. And this is what’s actually clever about this is that artificial intelligence often finds these relationships spread out in assets that may not seem quite obvious but offer an advantage in producing a robust and consistent forecast.
So whether it’s stocks or ETFs, that’s obviously going to impact individual equities you might be trading, but it really takes this global and that it looks at things like the value of currencies the bond market and interest rates and even commodities where applicable, right?
So if you’re trading an energy stock, that’s going to be weighted heavily by oil, nat gas. If you’re trading a mining company, that’ll be heavily weighted by the metal markets and some of the metal ETFs.
And so it really utilizes the data from all of these intermarket relationships and uses that to generate highly consistent and accurate forecasts.
Now, as it pertains to the predicted moving average, well, whenever we see that blue line cross above the black line, what’s suggesting that these average prices are going to start moving higher and traders can look to take a long position in line with their overall strategy, whether that be shorter term day trading or a swing or position trade.
And we see since that blue line crossed above the black line, we have about a 23 22 23% rally in just the past 15 trading days. Really just three weeks on the calendar.
But that doesn’t explain the entirety of these predictive indicators and the overall forecast.
If you look at the very bottom of the chart, you’ll see this bar that can be red, it can be green, but it’s getting updated every single trading day. And this has a very high level of accuracy associated with it.
This is what’s called the vantage point predictive neural index. And what it does is anticipate short-term strength or weakness over the next subsequent 48 hour period.
So you can think of that as a couple of candles at a time. But what it can warn traders of is short-term weakness within an existing uptrend.
And obviously again if that blue line is above the black line, the overall trend is still up. And also the distance and separation can be a valuable clue as to how strong a particular trend is.
And so you’ll notice that when that neural index goes bearish, you see the market runs sideways here, actually hitting lower lows over the subsequent price action.
But as that neural index gets bullish, and even here, you see that 48 hours later, well, we’re trading higher.
Same thing here, neural index goes bearish. We get a little bit of a consolidation in the market, but very clearly the trend is still bullish.
Now, that’s going to help traders again anticipate some of that short-term weakness, potentially buying on the dip scenarios over a couple day period.
But on top of that, Vantage Point’s neural network technology also provides a predicted high and a predicted low.
So now we’re down to intraday levels that traders can use to make trading decisions.
And so when we look back and say, okay, well, how accurate are all of those intraday, really daily predicted high and low levels compared to the actual price action?
So, we’re going into a Friday today. So what’s going to happen is whatever the price action is, we’ll fill this area and these levels will stay exactly where they’re at now.
And this is what we do is we just take a look at how accurate have all of these predictions been on previous trading days.
And so what traders can do is once they identify the overall uptrend, well, it can be helpful to navigate and manage that position and certainly add to a winning position.
And so we see here we move down towards the predicted low here. Here definitely hit it here right before this, you know, gap up and acceleration to the upside.
And notice this, it does a great job of just adjusting to the volatility of the market here.
So even as the market runs sideways, you really have these very specific daily levels that are saying, look, this is where you want to accumulate a position.
You’ll notice that the market closes inside that range and above the predicted low, really four days in a row.
And then we get this continuation of the breakout and move higher.
So really nice opportunity here in H AE.
And again just over a short period of time here about a 22% rally just over a few weeks.
First Solar ($FSLR)
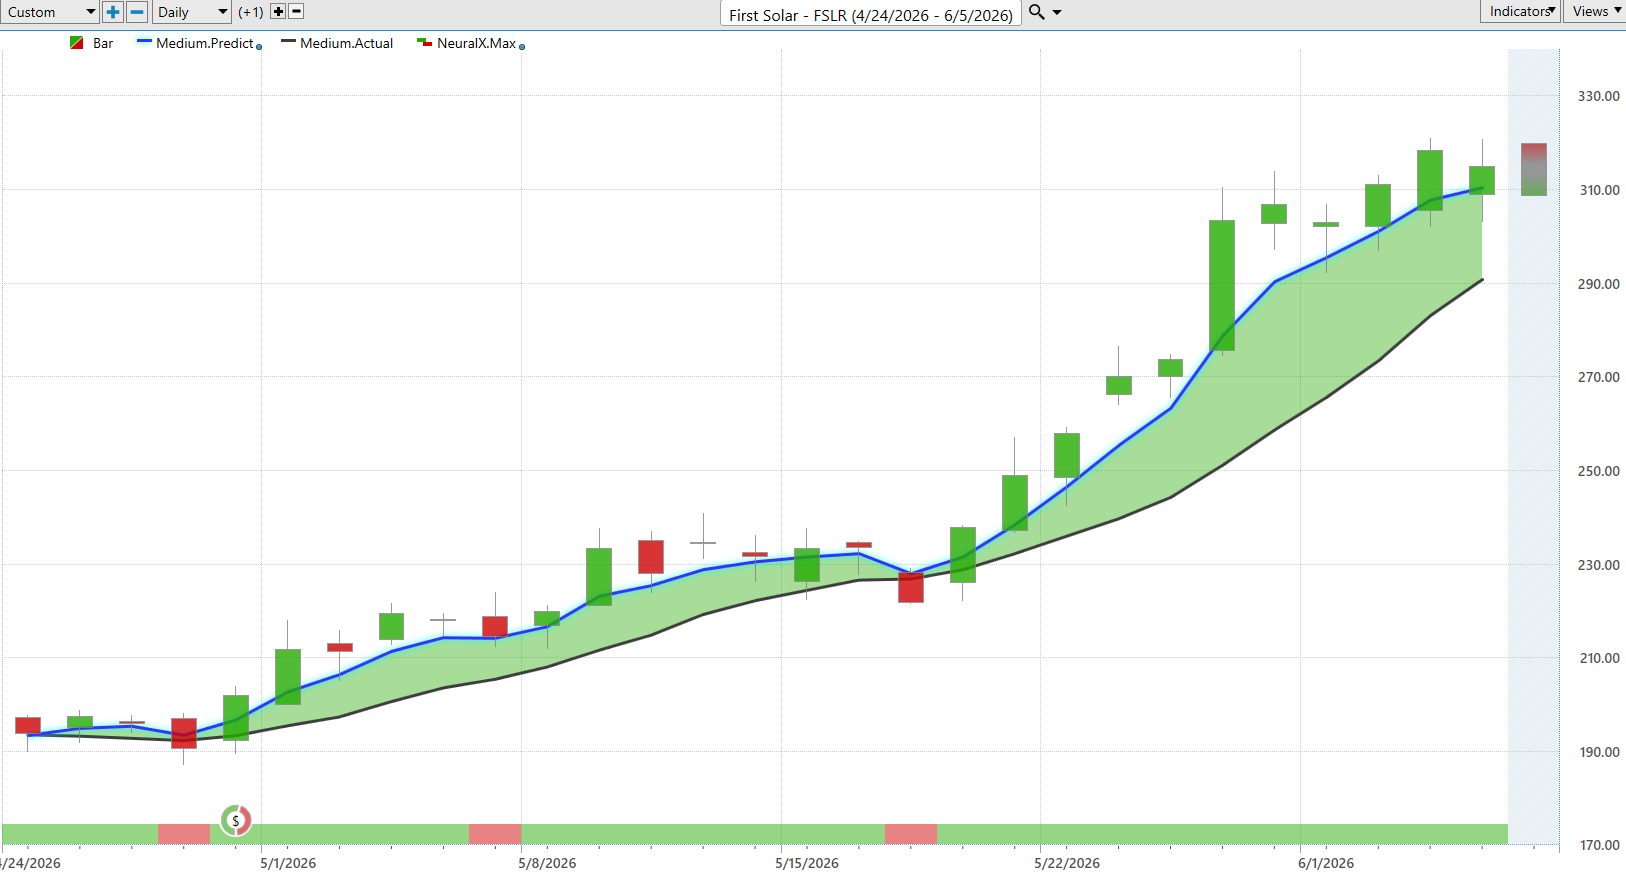
Now shares of $FSLR, and we can take this exact same approach and apply it to this prediction.
Here we see First Solar with that blue line crossing above the black line really towards the end of April. We’ve just seen obviously a lot of stocks at the beginning of April, especially in the tech semiconductor space, really starting to rally. But more of the market has come along here.
With First Solar, see that blue line above the black line. Now you do have earnings here. So you always want to really factor that into your trading, potentially wait to get through that earnings announcement.
As the market starts to trade, of course, we have those predicted high and low levels. So traders can utilize this information to accumulate a position at exceptional prices and potentially again add to that position.
You’ll notice just this past week, this would be Monday through Thursday, we literally have every single day Monday, Tuesday, Wednesday, Thursday picking out that predicted low level.
So traders, whether they’re day traders, can target the subsequent predicted highs or swing traders can add to that position and pretty quickly be able to lock those stops at breakeven and participate in the uptrend.
Again, really nice opportunity here in shares of First Solar, about a 61% rally in just 28 trading days.
This is just what’s so wild about this market. The past couple months we’ve got dozens of markets that are up 100 plus percent just in a couple months time.
Ventas ($VTR)
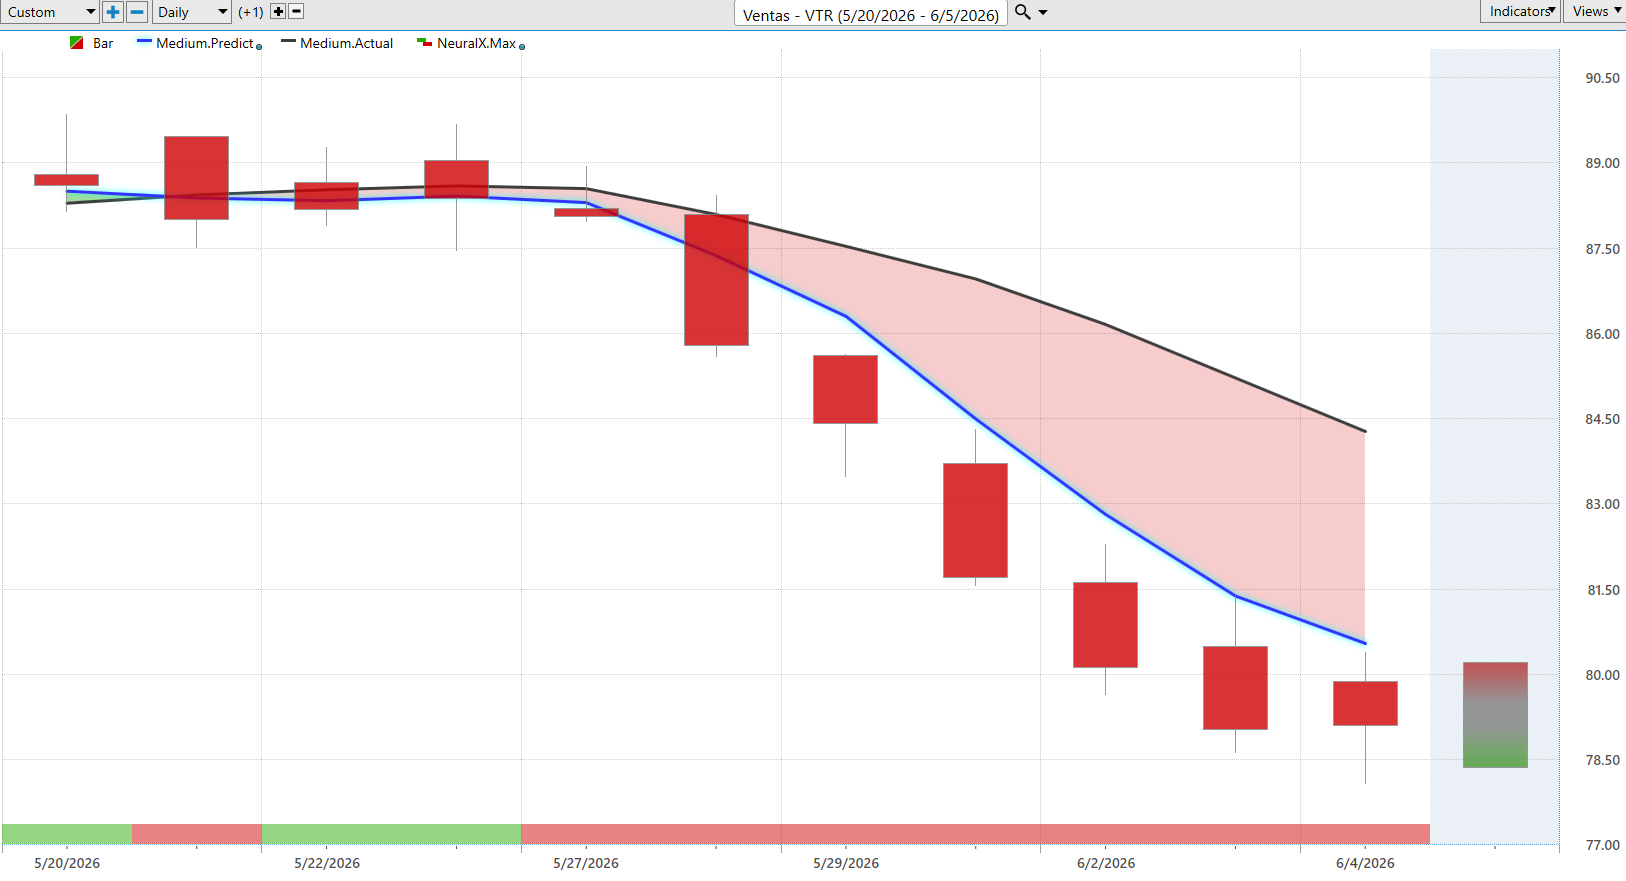
Now here’s $VTR, and this is actually a real estate investment company.
We already saw a lot of these stocks actually get weak and so there was this little sort of fear of rising interest rates coming into the market and it really had a negative effect on many of these stocks.
We’ll notice that we get this blue line crossing below the black line just a couple of weeks ago. Again, this is a good example of how all of these predictive tools work together.
Notice that the blue line is still below the black line. So the trend is down. But the neural index does get bullish here warning that, well, expect higher highs over the subsequent 48 hours of price action.
You’ll see that the market certainly levels off and goes sideways before that neural index gets bearish and then the next trading day that acceleration to the downside begins.
As we look at those predicted highs and lows we have all of these levels very early on warning you that if you want to short, look for a pop in the market to anticipate those short positions.
We see this market has very aggressively gone lower here, especially over a very short period of time.
Typically these type of stocks don’t move a huge amount. But here we have already a 10% decline in just nine trading days.
We really saw this whole space really start to soften up and weaken there.
Cisco ($CSCO)
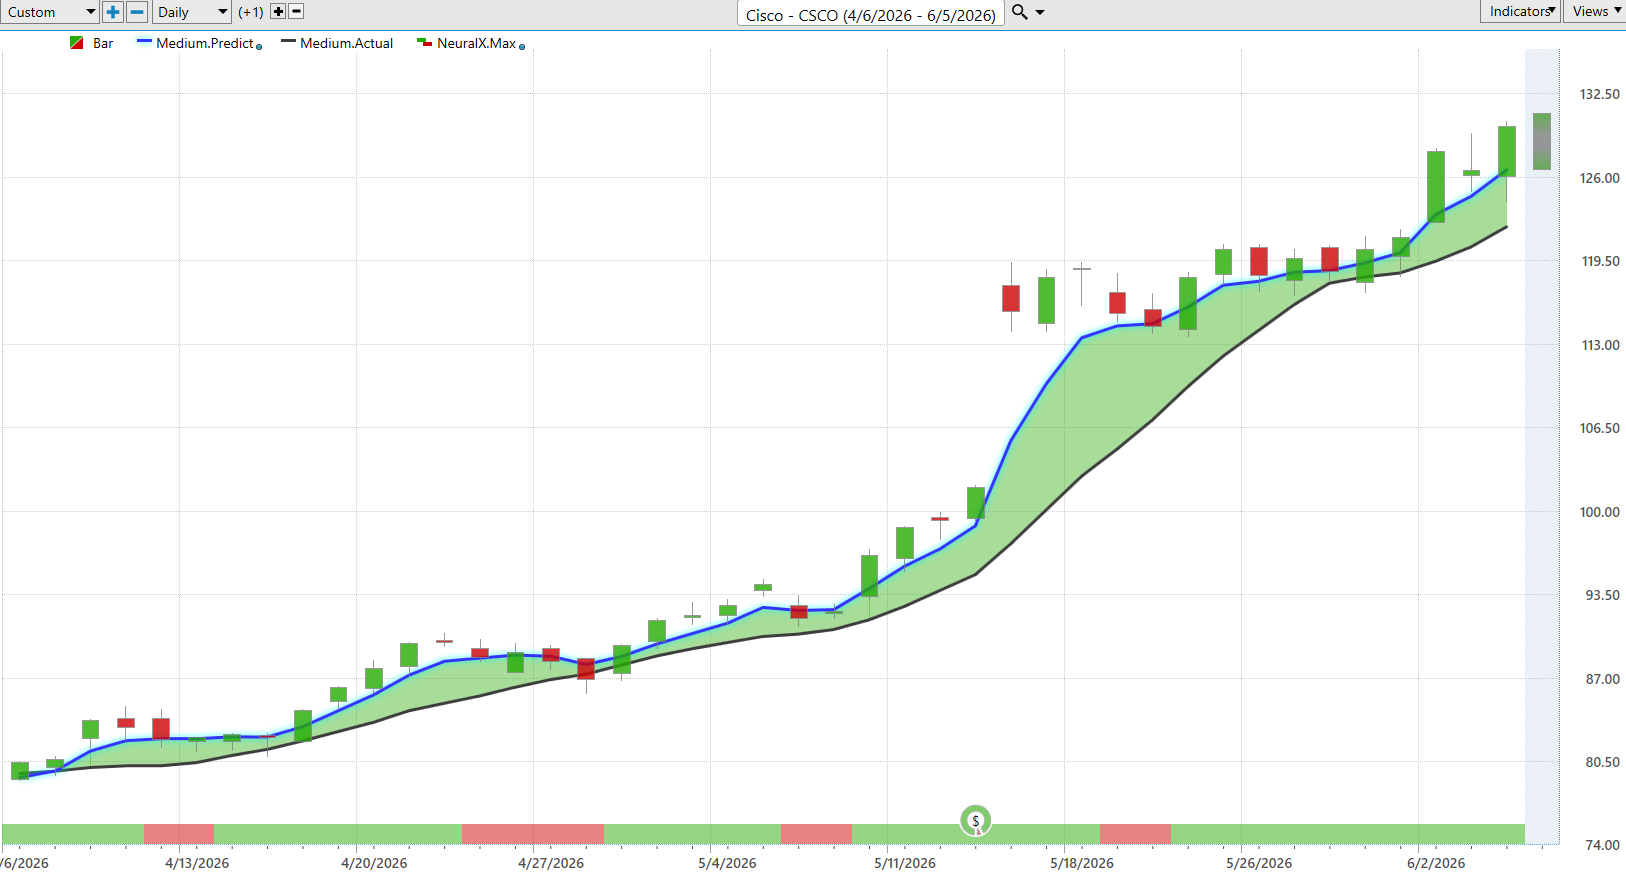
Now here’s $CSCO. We looked at this last week and obviously from last week, a very strong trend and this really coincides with all the strength that came in at the beginning of April.
You see about a 49% rally in 38 trading days. But what I again wanted to focus on is how traders can use these tools to adapt their position, get more aggressive as they’re in profit and the trades are working.
If we look at those VantagePoint predicted highs and lows just over the past week here, look how this works, right? If we understand the market’s in an uptrend, where do we want to be buying? Down at these predicted lows.
Well, there is Monday just about a perfect entry. Even back to Friday, the market just gapped down right in the morning and immediately started trading higher.
Again here being Wednesday, Thursday and offering up some good levels for short-term day trades, but also additions to a potential swing opportunity.
Again, this has been a very strong move now over the past couple months and clearly an area where we’ve identified, hey, there’s strength in the market here, especially these markets that turned up in April.
This is where you might want to focus your attention. It’s about a 60% rally over the past 42 trading days.
But even just this week, from those predicted lows, about another 9.5% just over the past four trading days to start the week.
Jfrog ($FROG)
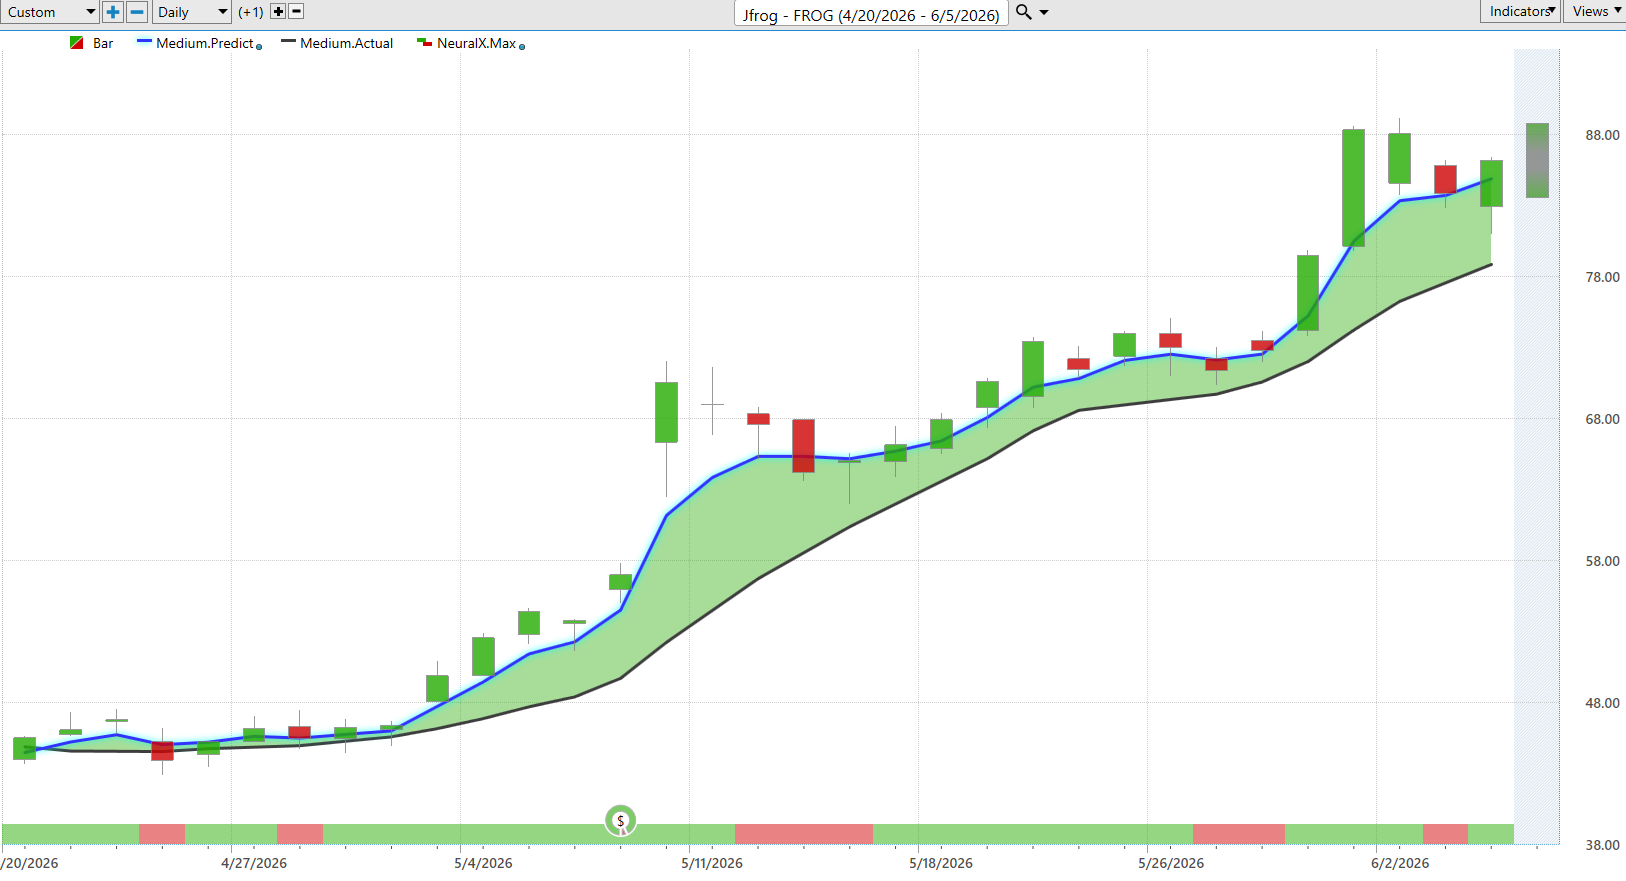
Lastly here, here’s $FROG, another tech stock, blue line crossing above the black line.
You’ll see these blips where that neural index goes bearish. Of course, you should expect that subsequent weakening of the price action, but very clearly the trend is up, right?
All you’d want to be doing is going long, taking profits on long positions. Of course, we have that roadmap for traders regardless of what they want to do.
So, here we get this kind of squirrely day where you gap down, but notice that almost immediately you’re trading higher, right?
Within 48 hours, the uptrend is resuming and we see these predicted lows again acting as a great guide to accumulate a position before we get this acceleration up in the trend.
This is what’s really great about VantagePoint is that even when the market starts to move, generally the software does a good job of adapting.
You’ll notice the range gets a little bit wider as volatility kicks into the market, move down to this predicted low, good movement into earnings.
So, obviously a rally going into that earnings report and then seeing a pop.
Notice that even after all this volatility, a huge gap on the chart, the software does a good job of just saying, look, where is this market likely to trade?
You’ll notice that every day, look at this slanted predicted low getting lower and lower.
Sure enough, the market scoots down towards those predicted lows, but the trend is still up and very much so to the upside.
A ton of separation here between that predicted moving average and the actual moving average.
We see that once that neural index goes bullish once again, that’s where that bullish momentum kicks into the marketplace.
Again, we can look at VantagePoint predicted highs and lows and we see that after this consolidation, what’s happening is you’re just scooting down to the predicted low and then rallying.
Even this week, this would have been Monday, Tuesday, and what is it telling you by Wednesday? Look for a little bit lower prices here.
This is yesterday. Look for lower prices.
Sure enough, as you move down to those levels, that’s where we see the market bouncing.
So, really exciting stuff here.
Again, we’ve seen just so many markets perform extremely well over the past couple months when we start to see these predicted moving averages cross to the bearish side.
We’ll highlight where we’re seeing that weakness.
But very clearly a great opportunity to get involved in the market, trail stops, and participate with the help of this roadmap and these predictive tools offered from VantagePoint AI.
So, we’ll go ahead and leave it there for today.
Once again, this has been the Hot Stocks Outlook for June 5th, 2026.
Thank you all for watching.
Best of luck out there and bye for now.


