


Register for a Free Live Training
The Hot Stocks Outlook uses VantagePoint’s market forecasts that are up to 87.4% accurate, demonstrating how traders can improve their timing and direction. In this week’s video, VantagePoint Software reviews forecasts for SPDR SPY($SPY), Kroger ($KR), Wal-Mart Stores($WMT), AMD ($AMD), 3M ($MMM), Powershares DB Commodity IDX Tracking Fund ($DBC), Exxon Mobil ($XOM), Teck Resources ($TECK), SilverCorp Metals($SVM).
SPDR SPY ETF ($SPY)
Hello again, traders, and welcome back to the Hot Stocks Outlook for March 15, 2024. Hope you all are having an excellent week out there in the financial markets. As always, we’re going to take a look at the most recent Vantage Point forecast. So, if you haven’t already, make sure you go ahead and click on that link in the description below and get yourself a live demonstration. You can learn all the specifics about this technology and tools that are helping traders make better decisions in the marketplace.
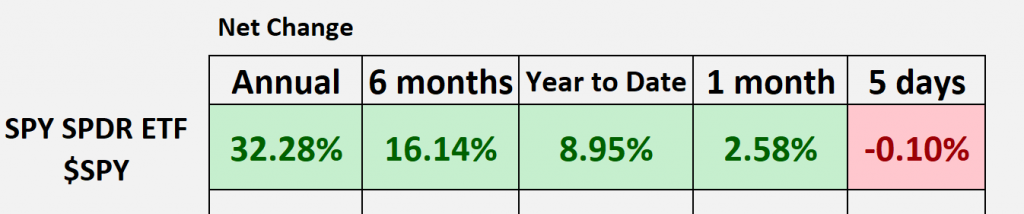
SPDR ETF SPY ($SPY): Now, as we typically do, we look at the SPY ETF just to get a sense of where, you know, equity prices have been, very broadly speaking here. And so, we can see, going back 12 months, we actually have about a 32% increase. That’s because last March is really when we started to see the rally back in 2023, but we’re starting to see some difficulty at these prices on the SPY, and a lot of these stocks that have performed really well. So, we may be seeing a lot of things rotating around, and this is where you want the tools to say, ‘Okay, well, where are those shifts happening, and how can I get my portfolio positioned to take advantage of this?’
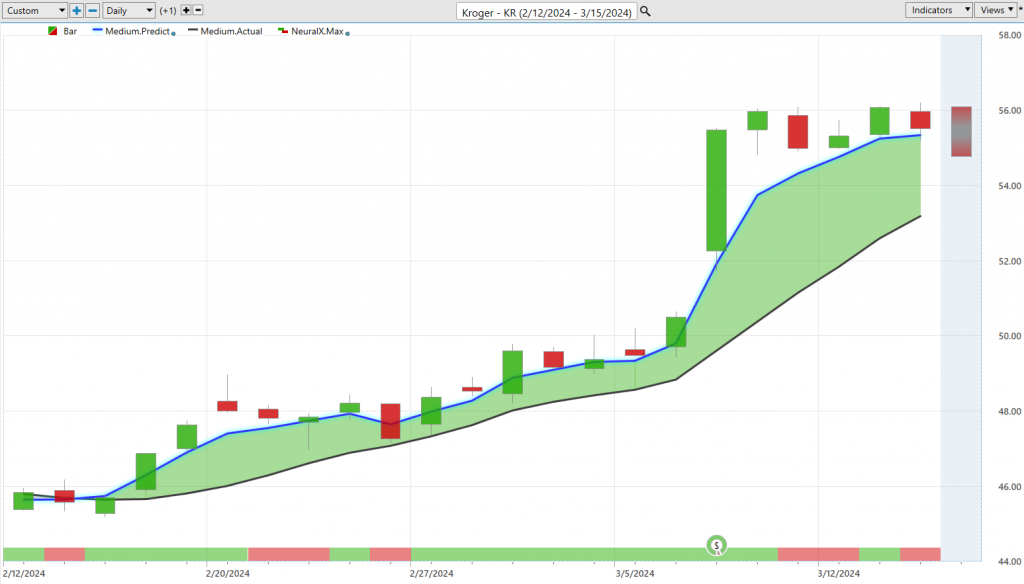
Kroger ($KR): A lot of these opportunities we’ve looked at previously, but Kroger is a really great example here. Looking at this actually a couple of weeks ago before earnings, and we got this most recent move. But what we have in Kroger here is daily price action. Right, so regardless of which forecast you’re looking at, all of these work exactly the same way. And what we have here is daily price action, and you’ll notice that there’s a black and a blue line right up against all that data. Now, that black line value that you’re seeing, that is actually a simple moving average. This is a very common technical indicator. In this case, it’s a 10-period simple moving average. So what that means is it just looks back at the previous 10 close prices, adds those all together, and divides by 10. But the problem is all of that data really comes from the past, and it really just summarizes what’s already occurred in the marketplace.
So, as Vantage Point traders, what we really want to do is use that as our baseline, letting us know where market prices have been, and we’re able to compare that to this proprietary predicted moving average. And so, for this number, essentially to get calculated and plotted every evening on the chart for the trader, well, this is where the technology of artificial neural networks comes in, and they’re performing what we would call intermarket analysis. Now, what we know is that Kroger is going to share some very important market relationships with other stocks, other commodities, other futures markets. And so, what we’re able to do is look at those relationships, whether they be things like the broader ETFs like the SPY, whether it’s individual stocks, whether it’s big commodities, right, it could be some of the grain or corn markets, maybe something like gold.
Uh, it’s also going to look at the dollar index, global interest rates, and so it’s looking at all of these markets and how they’re affecting the future price of the target market that you’re trading. And takes all of that information, it essentially creates a forecast or a summary of that, and skews all of these indicators, whether it be bullish, bearish, in accordance with the time frame of some of these tools. So, in reference to the Vantage Point predicted moving average here, this blue line, well, whenever that blue line crosses above the black line, it’s suggesting average prices are going to start moving higher. Therefore, traders can look to exploit the bullish side of the market.
Now, Kroger, we see here, has stated an uptrend of about 22% just in the past about 22 trading days. And so, what’s really important about this is understanding that as these forecasts update every single day, well, so do all of these indicators. So, whether you’re using this bar at the bottom of the chart, you see it goes from green to red back to green, or this predicted high and predicted low candle, which helps traders with entry prices and profit targets along the way. So, what we’re getting here with these indicators is down at the bottom, this neural index is tuned to solve short-term strength or weakness, just short-term strength or weakness over the next 48 hours. You can think of it as really just a couple of candles at a time. And then, your predicted highs and lows are going to help you with intraday price action.
So, we look at these forecasts every single week, and we can see here that okay, well, as Kroger had that forecast to the bullish side, we’re getting all of these levels before the trading day occurs that say, ‘Hey, look, if you want to accumulate a position, try to do it down at these lower prices and exploit that bullish side of the market.’ Of course, you see as we move higher, often hitting these predicted highs, moving a little bit lower before the advance of the trend here. So, really nice move here in Kroger again. We brought this through a couple of weeks ago, so, you know, really before we had this advance. But you see, going into earnings, everything pointed to the upside, and the forecast giving you a lot of cushion to take on that volatility. So, you want to be especially careful in the market currently because we are seeing some volatility, and you want to be in those really strong names.
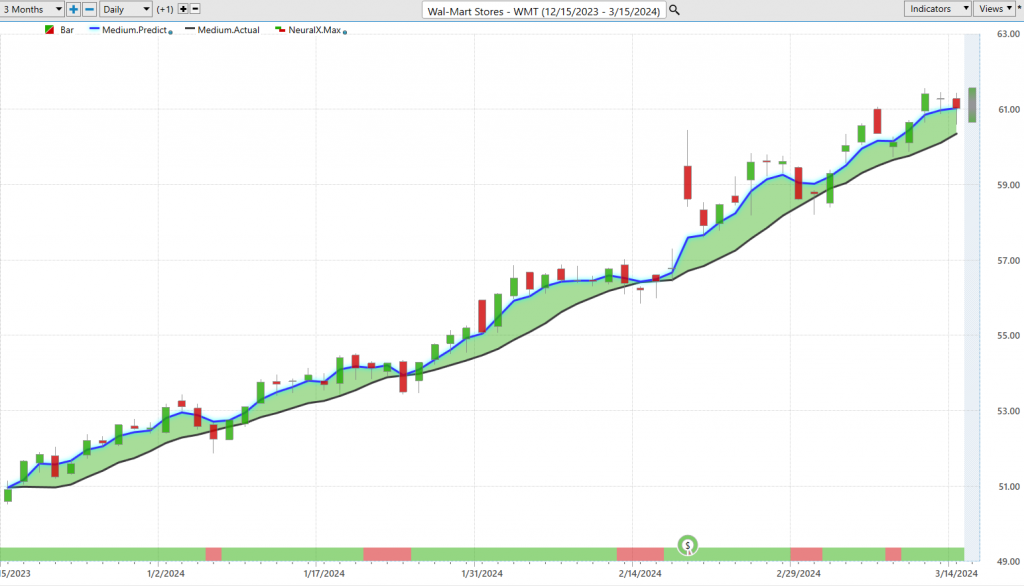
Wal-Mart Stores ($WMT): One of those highlighted here is Walmart. We can see here that we actually got our blue line over the black line forecast all the way back, really at the end of last year, and that has remained. We’ve never gotten this crossover to the bearish side, and this has created ample opportunity for traders to accumulate a position. So, again, you see here, really long chart here, but over the course of this, if you’re buying down at these predicted lows, targeting the predicted highs, it’s not taking very long for you to get in profit, and that trend to resume. Additionally, you certainly don’t have that blue line crossing below the black line. And so, I’m bringing this through just to highlight that we are seeing some really important shifts in the marketplace. You want to be in the really strong names, have some cushion in those positions, and be ready to make some adjustments. Here, you see about an 18-19% rally in shares of Walmart—really, really strong move there in a very popular name.
Now, here’s what I want to highlight here, is that we’re seeing things start to shift in many of the really important markets that had led the market higher in the QEs and the SPY.
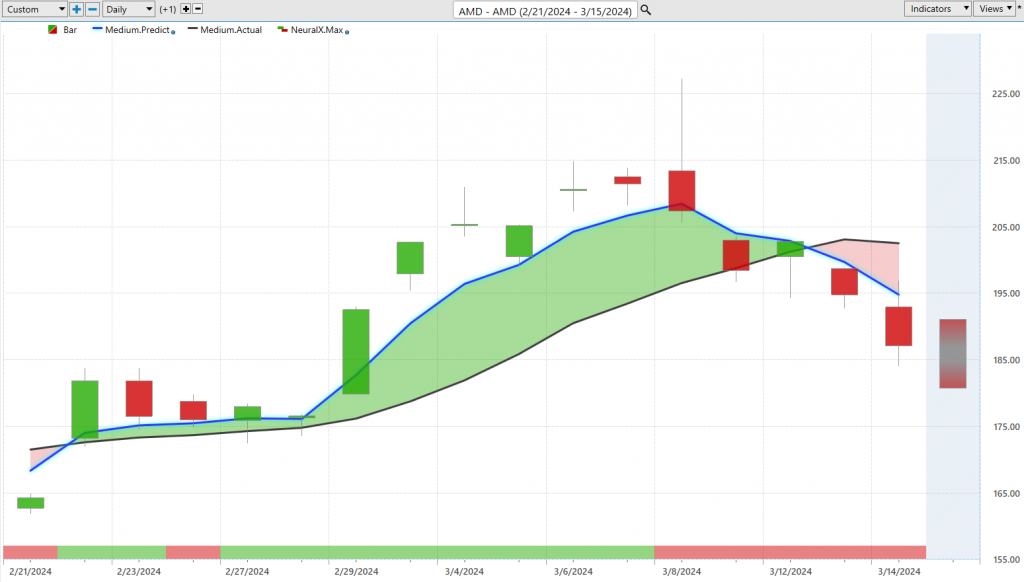
Well, here we see AMD. We had this blue line crossing above the black line, a lot of strength really from the neural index. You see it, it dips bearish here, you get a couple of days of sideways, but it’s immediately getting bullish again, and we get that advance. But more recently, what we’re starting to see, as you see here, is this neural index gets bearish, you start to see this blue and black line start to pinch together, and that’s, you know, typically a sign that okay, we’re seeing this trend start to weaken, and we’ve just seen this continued weakness now, a crossover to the bearish side.
So, I just want to bring this through because we’re seeing a lot of these popular names start to shift, even the SPY and the QEs, the big indices, and so you do want to be careful on where you’re getting positioned and which stocks you’re utilizing your Vantage Point forecast, so you have this as a really a roadmap to say, ‘Hey, if things are going great, stay long, like in Walmart, but AMD and many of those tech names, you may want to be careful.’
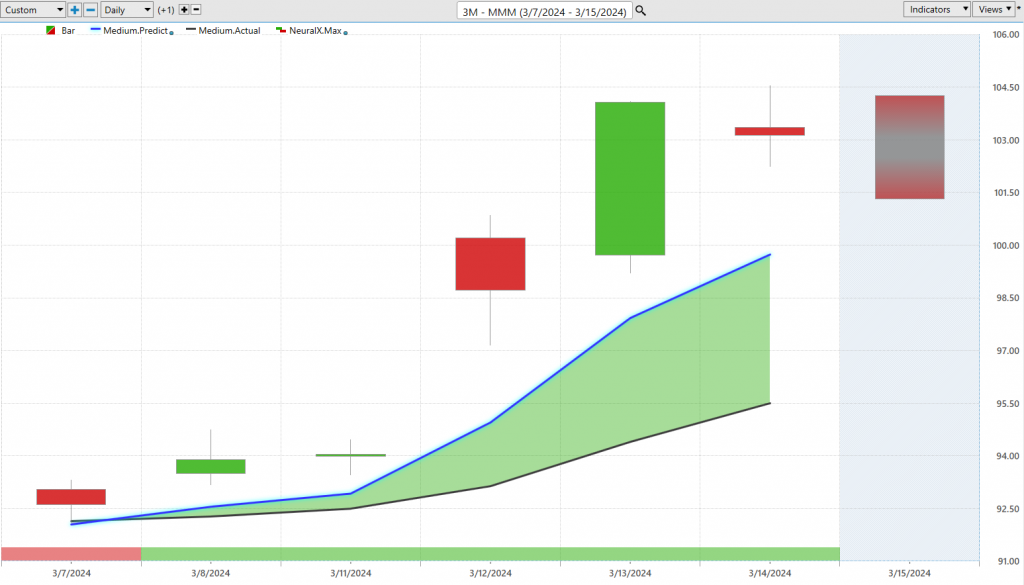
Additionally, a couple of weeks ago, we looked at 3M, and we were highlighting that there are these markets out here where there really hasn’t been much going on, you want to stay short, and what I mentioned is, well, as soon as that blue line crosses above the black line, well, we may want to take note, there may be that opportunity to the bullish side. And sure enough, all the short want to go ahead and cover, get out of the way, and we’re seeing a really nice move here, just in the past few days, it’s about a 10% rally.
So, if you understand where these opportunities are happening, you can actually run scans to identify these fresh shifts and go, ‘Hey, you know, I remember 3M, we were in a downtrend, hey, things are starting to shift, we’re at some lower prices, now is certainly a better time to go ahead and get involved.’ And very quickly realizing that that is the case.
Powershares DB Commodity IDX Tracking Fund ($DBC)
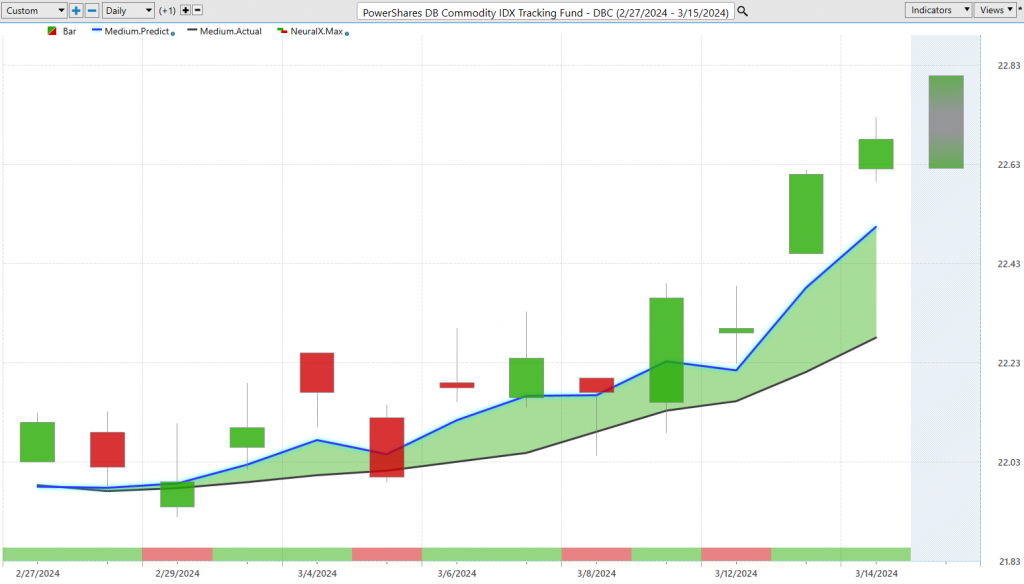
Now, what I wanted to highlight here is a little bit different, and it just highlights how that you can identify some of these important shifts happening in the marketplace. So, we’ve been talking a lot about GLD, right, the past couple of weeks, seeing that move in GLD before we got that big, you know, five or 6% advance. Well, here is the Commodity Tracking Index DBC, and we’ve started to see, again, this as a sector and a group, seeing this blue line cross above the black line. This having a lot of oil, metals, agricultural, just, you know, a whole mix of this, but you are seeing some attention, and some moves starting to pick up in the commodity space. So, this is where a couple of weeks ago, we’re looking throughout the basic material space, along with GLD, that’s really where you want the attention to go, and you see about a 3% move higher generally across commodities.
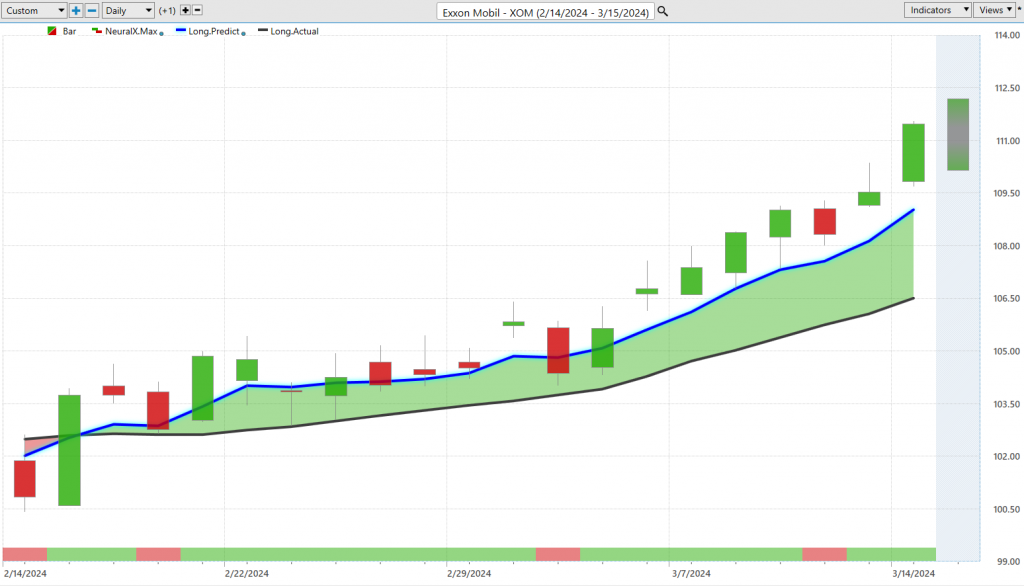
Here’s Exxon Mobil, just sort of driving that point home, of blue line over black line, neural index bullish, and this certainly being a place where you can buy, take profits on longs, keeps exploiting that bullish side, maybe buy some call options depending on your style here, but an 8% rally in the last 20 trading days in shares of Exxon Mobil, and this has been the case for a lot of these oil company service stocks.
Right, so again, you see these predicted highs and lows doing a great job of letting the trader know, ‘Hey, where do you want to be accumulating this position?’ And now, you’re seeing things advance well over $100 per share there in Exxon.
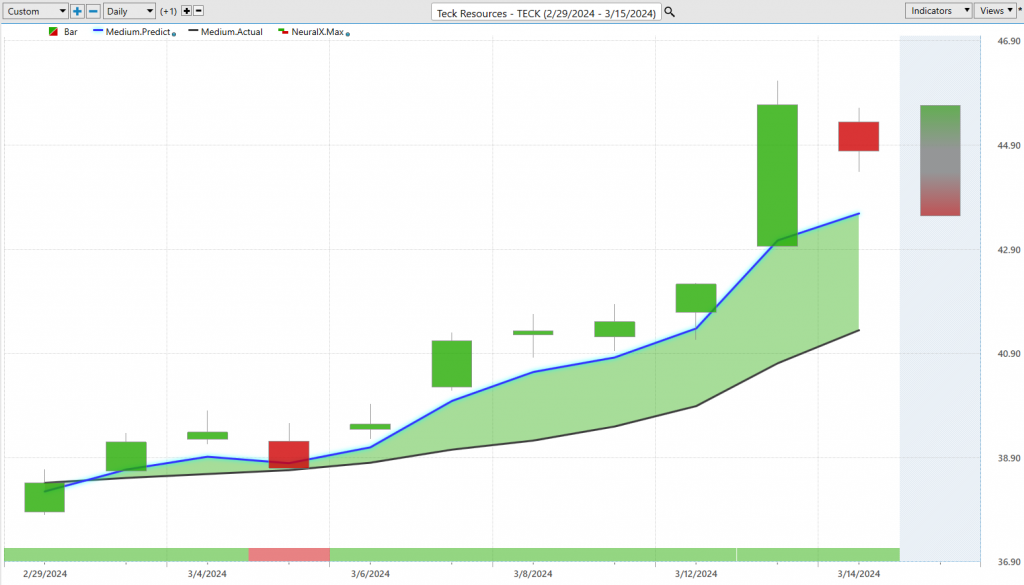
Here’s Tech Resources, now a mining company here, blue line over black line, neural index bullish, and you just see a tremendous amount of strength here, again, seeing that in the commodity tracking index, seeing that in the individual stocks, and identifying some new areas to get some positions on.
So, we’re starting to see, for example, copper, platinum, you know, gold’s taking a little bit of a break, but if it starts moving again, you’re certainly going to see these stocks really start to move. A 16% rally here in the past 10 trading days there in Tech Resources.
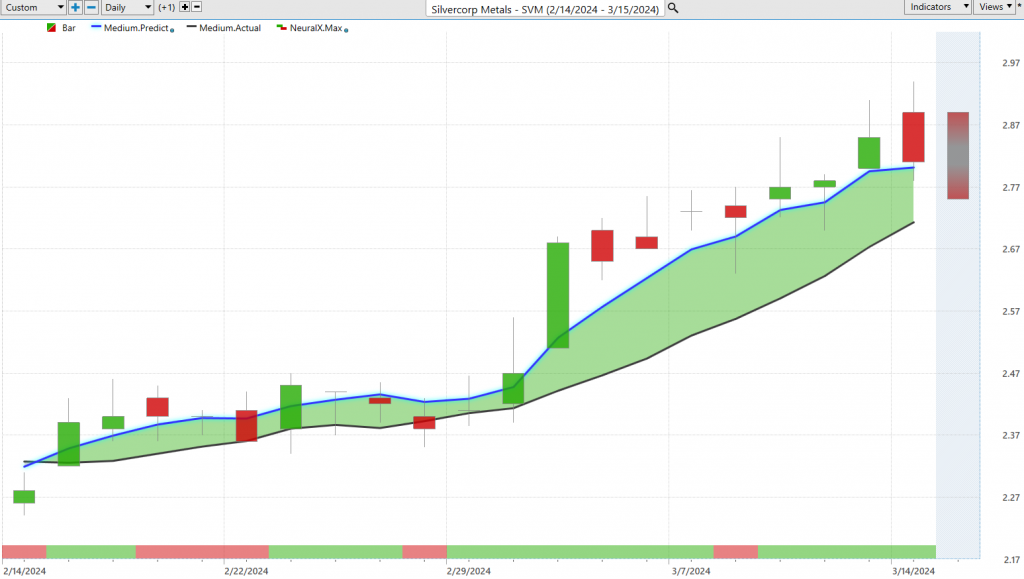
And lastly here, just Silvercorp Metals, so if you like trading some of those smaller, or you know, cheaper-priced mining companies, they can have some really tremendous moves here. Here you see a $2 stock, blue line over black line, so you know, whether you’re trading some of the bigger stocks, or you’re looking for something that’s going to have a little bit more volatility to it, what’s important is you have that roadmap, and those tools to say, ‘Okay, well, if you want to be a buyer here, where are those predicted ranges letting you know that there’s good opportunity to scoop up some shares?’
And you see, even as volatility starts to come into these things, down at 2.72, we’re, you know, tapping up against 2.92 here, and certainly, like I mentioned, you know, silver up, copper up, platinum up. Something’s going on in the space, and as a trader, we just want to get positioned and take advantage of that.
So, here you see about a 22% rally in just the past 20 trading days. So, I’ll go ahead and leave it there for today. Really exciting again, those shifts happening in the market, and when you have Vantage Point tools, especially like the IntelliScan, you’re going to be able to identify these important sector shifts, whether it’s in commodities or, you know, in those individual names, so you can get involved before we start getting those catalysts and a really strong advance in the stock.
So, have a great week once again. This has been March 15, 2024. Thanks for watching, and best of luck, and bye for now.


