


Register for a Free Live Training
The Hot Stocks Outlook uses VantagePoint’s market forecasts that are up to 87.4% accurate, demonstrating how traders can improve their timing and direction. In this week’s video, VantagePoint Software reviews forecasts for Vale S.A. ($VALE), Beacon Roofing Supply ($BECN), Bed Bath and Beyond ($BBBY), New York Times ($NYT), Kroger ($KR), and Western Digital Corporation ($WDC)
Hello again, traders and welcome back to the Hot Stocks Outlook for May 6th, 2022. I hope y’all are having an excellent week out there in the financial markets. And as always, plenty to cover here in today’s outlook. So we’re going to start out with shares of Bed Bath & Beyond. We’ve got New York Times, Kroger, Vale, Western Digital, and lastly, Beacon Roofing Supply.
And I really encourage you to watch some of the previous Hot Stocks Outlook where we’ve covered Bed Bath & Beyond actually about a month ago here, Beacon Roofing Supply very recently, as well as Kroger. But really most of these markets we’re just bringing back and updating the forecast to really help you understand how these tools are going to help you.
But specifically here with Bed Bath & Beyond, what we have here is daily price action. So each one of these candles is representing a full and complete trading day.
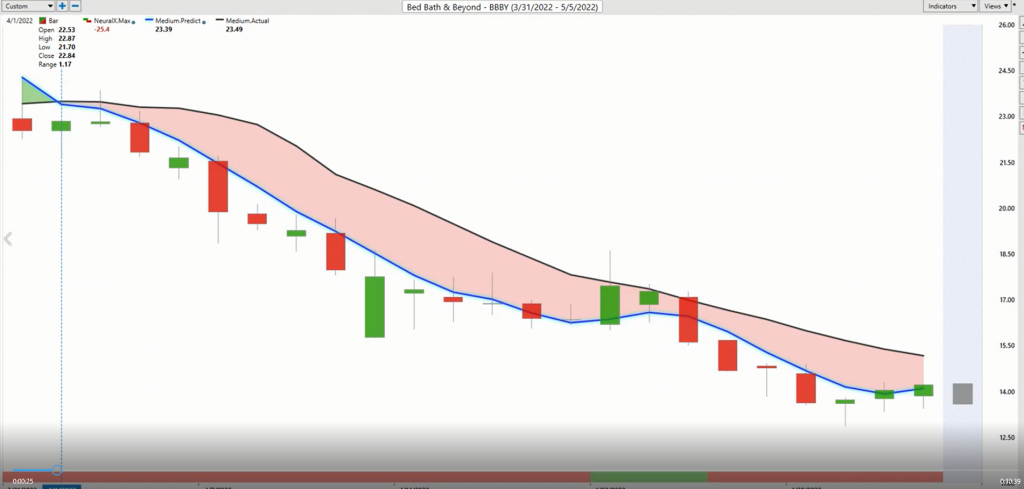
And right up against all that price data, what you’ll notice is there is a black line and also a blue line. So the black line that you’re seeing there is actually a simple moving average. That’s actually a very common technical indicator. In this case, what it’s doing is looking back over the previous 10 close prices, it adds those all together and then divides by 10. So what that does is it smooths out the existing price action and acts as a really good measure of where market prices have been over a given period of time.
But obviously, the savvy trader needs to be ahead of the next move and understand where price is likely to go next. And so what we’re actually able to do is compare the value of that lagging simple moving average to the value of this blue line. And for that to get calculated and plotted against these charts every single evening, this is where the technology of artificial neural networks is coming into play and it’s doing what’s called intermarket analysis. So that means specifically for shares of Bed Bath & Beyond, the technology has identified known intermarkets that are known to drive and influence future price.
Now, if we think about the broader markets right now, we can understand, “Well, how has that been playing out?” Well, things like the Dollar Index, crude oil prices, potentially things like precious metals, gold. All of these things are rippling through the marketplace, but this is happening all the time. We can get even more clues from relationships in individual stocks or ETF groups. So this is very important not just the macro, but even the micro side of things to understand and really pull out some clues as to the direction of future price.
And so it takes all of that information and it’s actually generating future price predictions as far as where things are headed next. And it’s using those predictions and actually using them to construct these predicted moving averages. So rather than have tools that simply look back and reaugumate past prices, now you have a forward-looking predictive technology, that’s going to improve your decision-making in the market. So whenever we see that blue line crossing below the black line in this case, we’d expect average prices to start moving lower.
Now, that’s not the only problem we have is where are prices likely to move over a given period of time? Well, we need to know what’s going on in the short-term. Where are potentially predicted high and low levels for the next trading day we need to account for? And so if we look at the very bottom of the chart, you’ll see this bar that goes from green to red, back to red, back to green and this gets updated each and every trading day. But what’s happening is the technology is really tuned to solve a different problem here. It’s only looking ahead 48 hours and it’s looking at short-term strength or weakness in the market.
So it’s not looking at overall trend direction and direction of longer-term prices. It’s really just looking at 48 hours ahead. Is there likely to be short-term weakness or short-term strength in the market? And it does that with an extremely high level of accuracy consistently, whether there’s earnings, Fed announcements, any of this stuff. Lastly, you’re provided with a predicted high and low bar, which we look at this every single week and we’ll update all of these charts as we update everything from week to week.
But this is very important to understanding how the trader can adjust the position. And so when we see Bed Bath & Beyond going to a downtrend and we’re running with tools like our IntelliScan that are informing us that there’s some weakness in the market, well, we can target markets to express that bearish view. We can also develop a portfolio that’s either net long or net short with a combination of some of these markets, but we’ve got the guidance with the help of these tools to make better trading decisions and know, “Hey, where should I establish a short position in the market and be taking profits on it? Where should I establish a long position? And how can I get the best of that opportunity, not just for the day, but potentially the several weeks that opportunity plays out?”
Because you got to know when to stay in the market and capture, you see about a 39% move to the downside even just a couple 100 shares there on a fairly cheap stock of about $1,700. You got to know when to hold that position and not leave money on the table by getting out too early. So if we start to see crosses to the upside and a lot of strength, well, the portfolio can shift, individual market opportunities in that portfolio can start going long, but there are some issues out there.
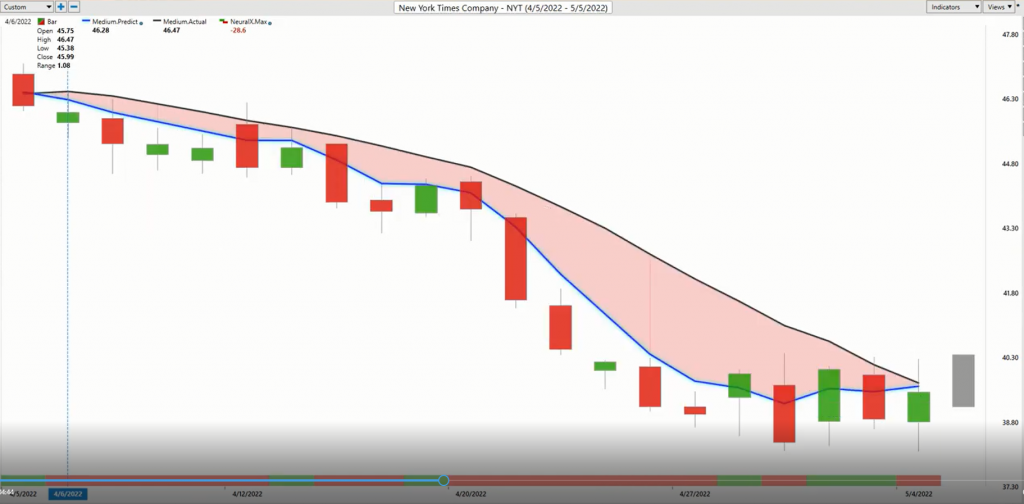
And so here’s shares of New York Times. We see a very similar crossover to the downside. You will have these, there are periods where the neural index can pop up to a one or a bullish sign here, but it very quickly goes back to that zero configuration. You see, as markets run sideways you may get that neural index popping bullish and let you know that, “Hey, you might want to look towards these predicted highs.” The market can very easily move up and you should expect it to move up towards these predicted high levels.
But do you want to be taking long positions in this market? Well, we can see that blue line is actually still below the black line and a 14% decline here in just the past 20 days of shares of New York Times. Again, just a couple 100 shares. There’s a $1,300 move.
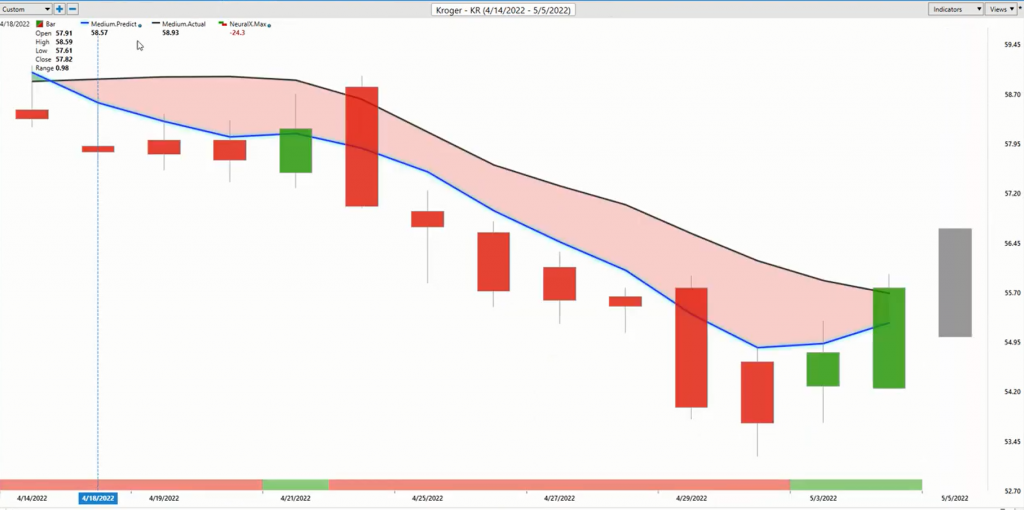
We looked at shares of Kroger last week and a really good example of the neural index doing its job here. So as the crossovers come through, the neural index is very bearish. We went over this kind of gap up in prices or that short-term movement higher in prices over that subsequent 48 hours, but the overall trend very much to the downside.
And so as this trade progresses, these predicted highs and lows are going to do their work. What I really love about the technology here is you see that even after this trading day, you come right outside the bounds. That’s fine if you’re going short and you expect the market to keep moving that direction, but look how these predicted ranges do a really great job of having you prepared for the next trading day. So even here where we have the market moving higher, it’s saying, “Hey, expect the market to move towards this predicted high.”
The next day is saying, “Expect this thing to slant up.” And this was a very strong day in the market. The S&P was up 3%. You had the Fed announcement and all that going on, but do you want to lose sight of the bigger picture? I mean, we were expecting market prices to trade up there regardless. And there’s still quite a lot of distance between that predicted moving average and the actual moving average. So if you’re looking for a place to get long, certainly not the place to do it.
And again, we have to let these forecasts update and we start seeing things to shift. Sure. But you want to let the software and this technology guide that decision-making and where it’s been guiding things is to the bearish side of things. If you had a portfolio, it’d be net short over this period. And this is why over the past few weeks in the Hot Stocks Outlook we bring in more short opportunities, because that’s what the software has been picking up on.
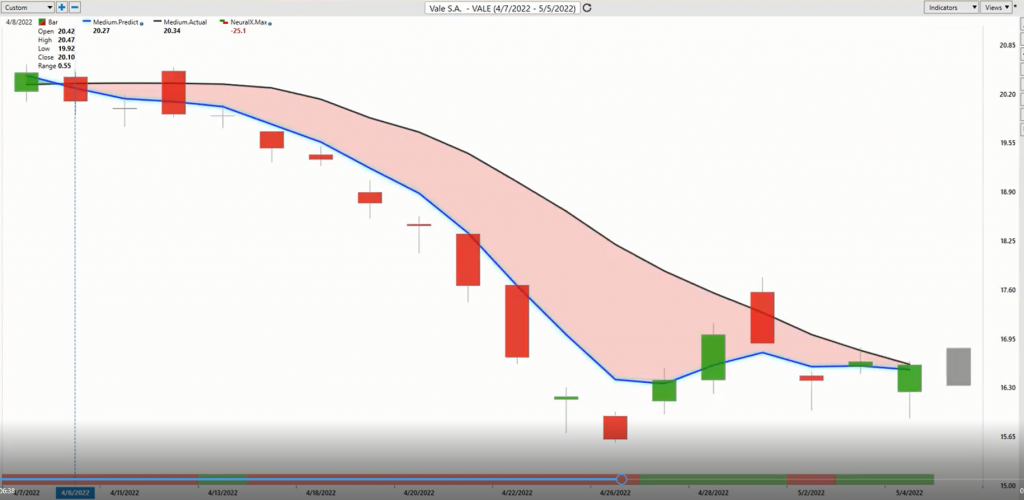
Here’s Vale. So even basic material companies. Steel, gold and silver, these things have been doing very, very well. And this stock has actually doubled over the past few months, but more recently, the trader needs to understand that, “Hey, there’s actually been a crossover to the downside.” The dollar has gotten tremendously strong. That’s had a depressionary rate effect on even gold prices. And so we see that weakness play out.
So if you’re the trader who’s prepared you understand that, “Hey, there’s actually been a shift to the downside here. You do not want to be buying these opportunities. You only many shorting and taking profits on shorts.” Here you see a gap up in the market and you see things starting to move higher, but we’re not really moving anywhere. The neural index is getting bullish. You’re seeing a lot of volatility, but as long as that blue line is remaining below the black line you want to stick with …
Really the whole point is that even the subtle weighting of those intermarket relationships, keeping things like the moving average depressed. And it does the same thing on the bullish side when things start to reverse and all these forces act bullishly as far as having an effect on the market. Well, it’s going to cause these predicted moving averages likely to be more bullish and cause these neural indexes to be more bullish and these predicted ranges to move higher.
So you do the exact same thing you might have been doing back here, understand that, “Hey, it’s shifted. I want to look towards actually these predicted high levels to short and vice versa.” So this is what it’s all about is adapting to those changing market conditions.
Western Digital Corporation ($WDC)
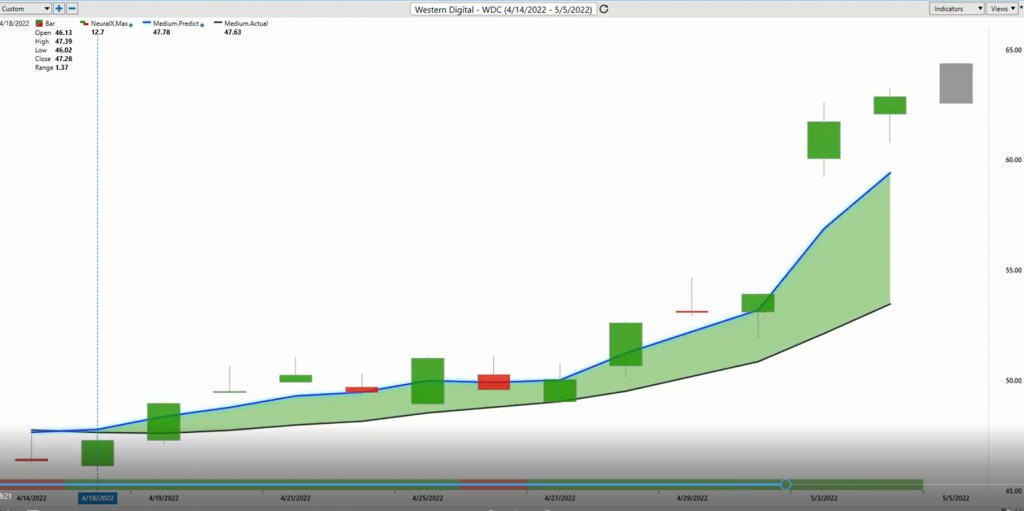
So there hasn’t really been a whole lot of strength out there, but here’s Western Digital. You have this crossover at the upside. And if you’re trading here, you can see clearly this is not an area to short. You essentially have how many trading days here? About 15. Only one of them, the neural index is bearish so you’re getting extremely high level of accuracy from that neural index telling you expect higher prices over the subsequent 48-hour period.
And again, we can use those predicted highs and lows to say, “Okay, well, even if we really want to refine that entry into the market, where should we be looking to take entries?” And so you see this really benefits as we get that pop in the market, but bullish neural index signal for six days as it moves from 50 up to $65 per share in shares of Western Digital.
And lastly here, I just wanted to bring in Beacon Roofing Supply because we looked at this last week and I actually brought this in to highlight that capital goods was one of those areas where there is a bit more strength, but overwhelmingly the market is still bearish. And so we even started to see the neural index gets bearish. We looked at this crossover to the downside, but what we have to understand is exactly what I’m trying to highlight here is that waiting of the predicted moving averages. And we see that, well, there is a lot of weakness coming into the market. It does weigh on that predicted moving average.
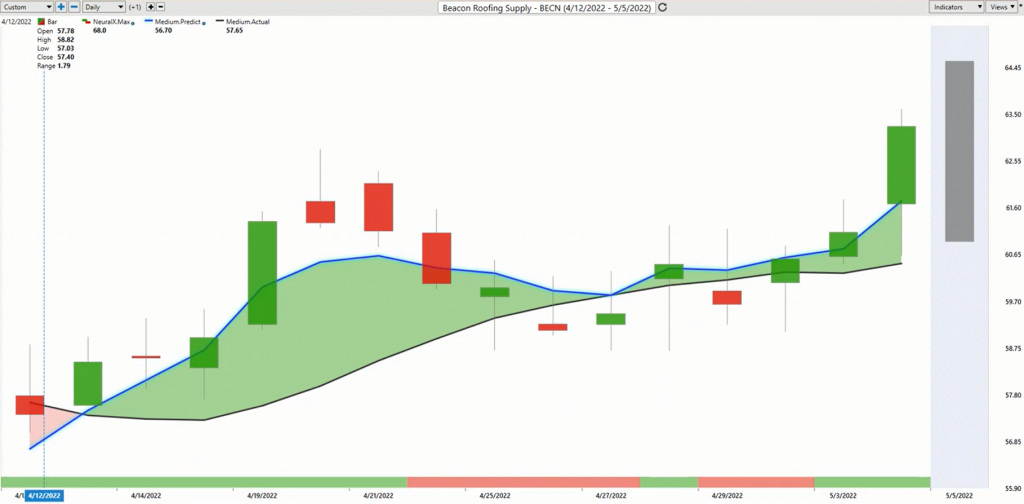
And we do actually get a crossover to the downside here very, very subtle. Not a very strong crossover if you were looking for opportunities to short, but you see how quickly everything updates and adapts. And literally within the next trading day, you have the market with a strong crossover to the upside, and then just look at these predicted highs and lows. So when you’re managing a trade like this and you’re trying to decide, “Hey, how can I improve that position? What should I expect from the trading ranges day-to-day?” You can see how extremely effective these tools can be at guiding you to find those better areas of value in the marketplace if you want to express those trading opportunities.
So in the exact same way we look at some of these markets moving lower and Kroger moving lower and all this stuff, it’s the same thing. That blue line crosses. In this case, you barely cross below the black line, but you cross above and you see the strength playing out. And so it gets easier to direct the portfolio on where there’s actually things moving to the upside and where do we actually want to short, hedge, get out of the way and play some defense here seems to be what the alarm bells are flashing.
So I’ll just go ahead and leave it there. Again, I really hope everyone’s having a great week out there in the financial markets. I really encourage everyone go back and watch these previous outlooks, because periods like this are so important to traders to preserve capital. But also make a lot of money as volatility picks up and opportunities open up not just on the bullish side, but also the downside. So once again, this has been the Hot Stocks Outlook for May 6th, 2022. Thank you all for watching, best of luck and bye for now.


