


Register for a Free Live Training
The Hot Stocks Outlook uses VantagePoint’s market forecasts that are up to 87.4% accurate, demonstrating how traders can improve their timing and direction. In this week’s video, VantagePoint Software reviews forecasts for CleanSpark ($CLSK), Eli Lilly ($LLY), Home Depot ($HD), PowerShares QQQ ($QQQ), Berkshire Hathaway ($BRK/B), Acadia Healthcare Company ($ACHC)
Hello again, traders, and welcome back to the hot stocks outlook for November 14th, 2025. Hope you all have had an excellent week out there in the financial markets. And as always, we’re here to take a look at the most recent VantagePoint A.I. predictive forecast.
So, if you haven’t already, be sure to go ahead and click the link down in the description below. You can get yourself signed up for a live demonstration to learn all the specifics about how these predictive indicators and tools are helping traders make much better trading decisions out in the marketplace.
Uh, and so we really have a lot of things to cover. Uh, we’ll go ahead and start out here with Berkshire Hathaway, but we’ll look at the Q’s, CleanSpark, Eli Lilly, Home Depot, Acadia — a very wide assortment of stocks in a volatile stock market here.
Berkshire Hathaway ($BRK/B)
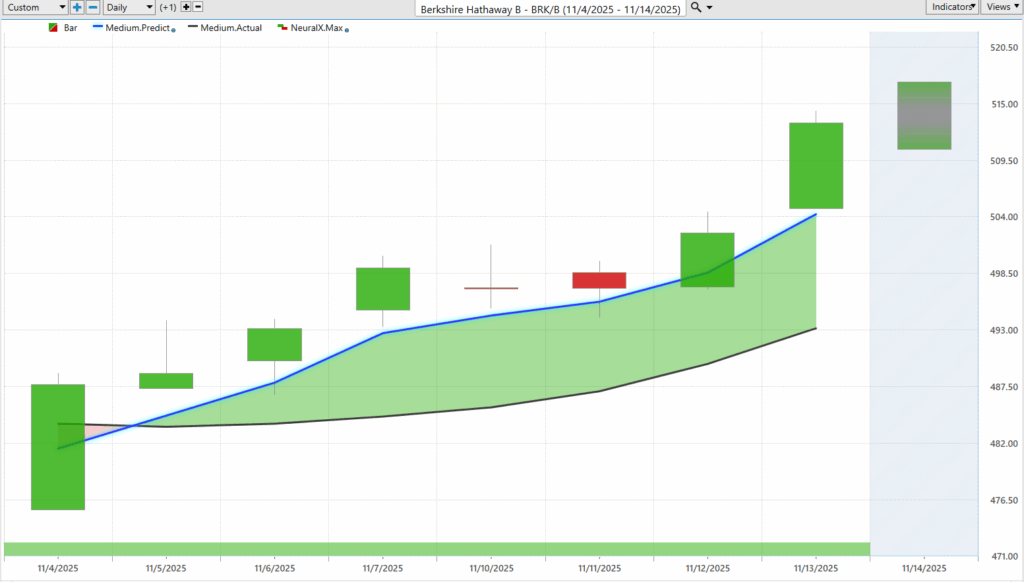
And so what we’re looking at here in Berkshire Hathaway B (BRK/B) — Berkshire Hathaway — is daily price action, right? This is a very straightforward example where all these individual candles are going to represent a full and complete trading day.
And it’s right up against all that price data that you’ll first recognize there’s a black line and also a blue line value. And so what that black line value is is just a simple moving average. So this is a very traditional technical analysis indicator. Uh, in this case, it would be a 10-period. So it looks at the previous 10 close prices, adds those all together, and then divides by 10.
And for VantagePoint traders, that acts as a baseline, letting traders know where market prices have been. But obviously, traders want to understand: Where are prices headed next?
And so the VantagePoint trader is able to say, “Okay, well, why don’t I analyze this blue line value?” When we get these situations where, in this case, we’re crossing above the actual moving average, what that is is VantagePoint suggesting that these average prices are going to start moving higher.
And to get this number — which is essentially a price — it’s going to get calculated and plotted on the chart. Well, to get that price value, this is where the technology of artificial neural networks is coming into play. And they’re performing what we would call intermarket analysis.
And so what that means is that rather than just looking at past prices of an individual stock like Berkshire, VantagePoint tools are going to analyze other markets that are known to drive and influence future prices. So this can be things like the broader indices like the S&P 500. This can be large ETF groups that wrap up a huge assortment of shares. This can be individual stocks or even global currencies and interest rates, and even, where applicable, potentially global commodities that have a large influence on that specific stock that you want to trade.
And so it really takes this global approach, factoring in all of these relationships and all of that data to generate highly accurate predictive indicators on where things are headed next.
And so whenever we see this blue line in this case cross above the actual moving average, well, it’s suggesting these average prices are going to start moving higher and traders may want to look to take a long position depending on your trading style and approach.
Now, in addition to that predicted moving average, you’ll notice at the bottom of the chart we have this bar that in this case remains green through the entire duration. And this is a very short-term indicator that changes every single trading day. Okay? And so after today’s trading, we’ll get a new signal from the predictive neural index.
And what it’s forecasting is just short-term strength or weakness over the next 48 hours, or what you can think of as really two candles moving forward. So again, short-term strength or weakness within this, in this case, existing uptrend.
And lastly, you’re provided intraday levels — a predicted high and a predicted low — which can really help traders navigate and fine-tune entry prices and potentially profit targets in the market.
And so what’s very interesting about these predicted highs and lows is we can go back and look and say: How accurate are all of these levels in the context of the broader trend?
And so what we see here is if we go ahead and look back at these predicted highs and lows, really see how this all works together. You get that movement in the uptrend, market moving to a bullish configuration. And you’ll notice that you get these levels where you move down towards the predicted low and oftentimes moving up to that predicted high and actually selling off a little bit, but acting as an overall guide that says, “Look — identify the overall trend, where that short-term strength or weakness is likely to come in so traders can be prepared,” and then really a fine-tuned level to come in and help traders manage the existing position.
And so really nice opportunity in Berkshire Hathaway. And I bring this through just because we have a lot of volatility in markets and very few names that are in strong uptrends and showing all these predictive indicators getting very bullish. You see Berkshire up about 5% now in the past seven trading days.
And so with all that understood, we can say, okay, well, what is the broader market doing, especially—
PowerShares QQQ ($QQQ)

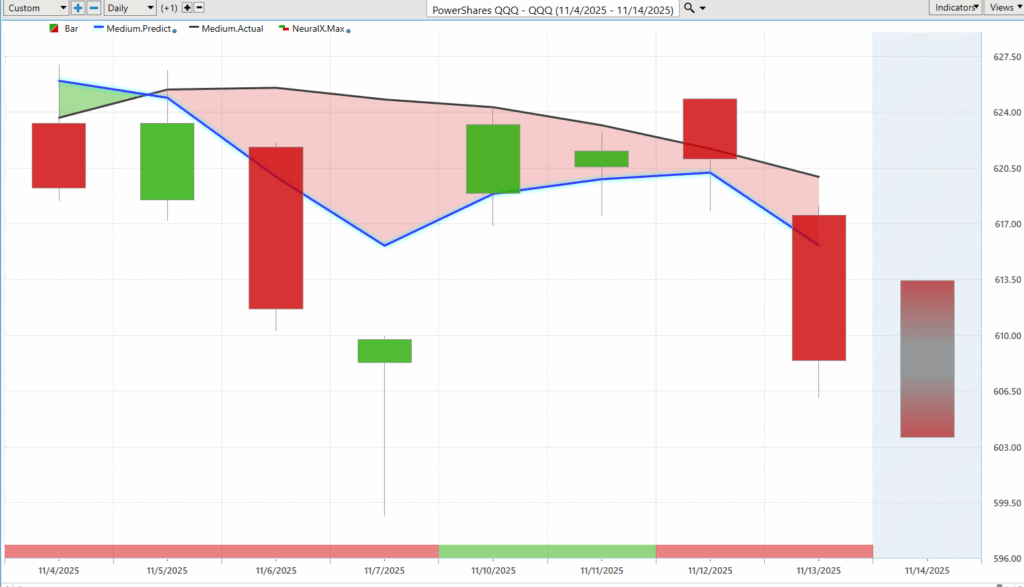
—around these tech stocks in PowerShares QQQ (QQQ)?
And so here we see the Q’s very clearly. This forecast going back really to last Wednesday with that blue line moving below the black line. Uh, we got a lot of volatility around the futures market overnight and a big gap up. And so I see that neural index goes bullish — you get a couple days of strength — but this is actually Wednesday. The neural index goes bearish. You see that blue line below the black line, signaling we’re still in a downtrend.
And now we’re seeing a lot of that weakness continue to play out across the broader markets, seeing it play out in markets like the broader S&P, the Q’s, and also Bitcoin.
CleanSpark ($CLSK)
Uh, so here’s CleanSpark (CLSK). This was actually an opportunity that we took a look at on the way up, and it’s a really good example of how things shift in the marketplace, and traders want really tools that are going to get ahead of those important market shifts and price action.
And so what we see here is that blue line crossing above the black line really brought this through a couple times over this time period, signaling, look, the overall trend is up. You’ll get these periods where the neural index is bearish in an uptrend, and that’s where you tend to see these consolidations in market prices.
Uh, but more recently what we’ve seen is that blue line shifting below the black line here — a lot of weakness from the neural index over that time period. And then traders can again come in and utilize those predicted highs and lows and understand: Look, this is a market where you actually want to be shorting on these moves higher. The overall trend is still very bearish. And all you want to do is really short, take profits on shorts.
And that’s really been the case now for a few weeks, and now we’re seeing again things like the Q’s starting to shift to the bearish side. So this is where you want to be very careful in some of those names that were doing extremely well — well, now completely reversing.
And you see CleanSpark here down about 41% just in the past 19 trading days from where that forecast flipped to the bearish configuration there.
Eli Lilly ($LLY)
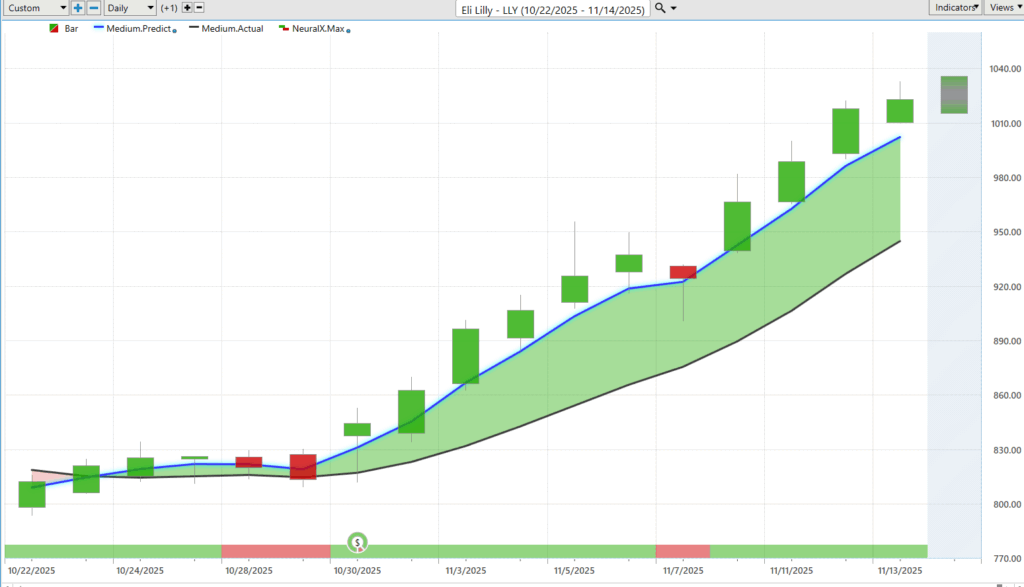
Now here’s Eli Lilly (LLY) getting a lot of attention from some larger investors here. Here you see Eli Lilly moving into an uptrend. Neural index gets bearish right before earnings here.
And once you get through that earnings, the software does an excellent job of just adapting and understanding: Look, we’ve gone through a high-volatility event. Let’s go ahead and get those forecasts and predictions back online.
And again, we can see how accurate all of these intraday daily predictions are to help traders navigate trading opportunities. So once you get through earnings, you see very clearly that predicted high and low ranges going higher here, signaling the overall trend is up. You see we move down towards this predicted low, and the uptrend continues here.
So again, one of the fewer stocks we’re seeing very strong signals from the predicted moving averages. A lot of separation between that predicted moving average and the actual moving average. And very clearly here, market in a strong uptrend.
Home Depot ($HD)
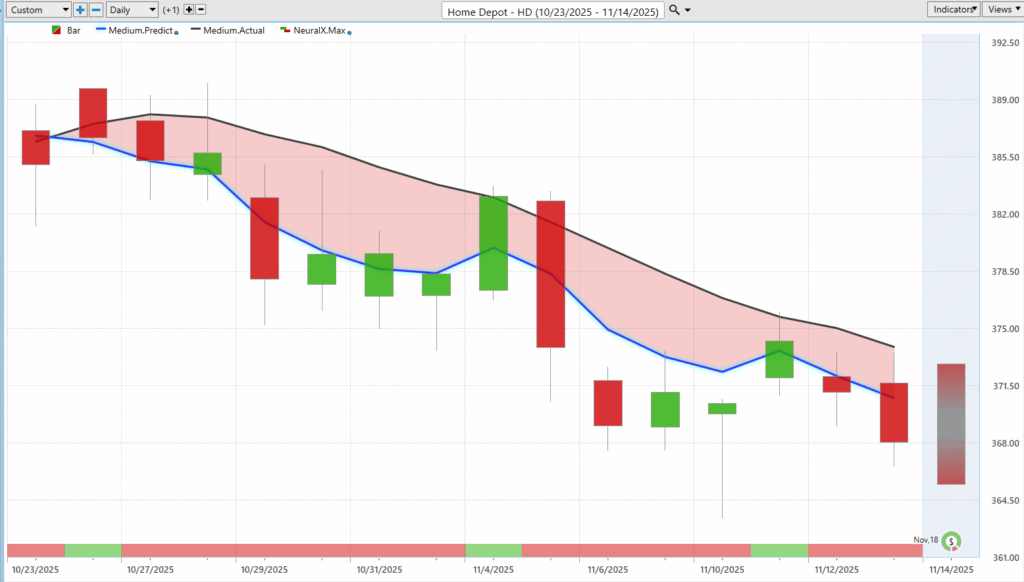
Now, back to some of that bearishness. Here’s shares of Home Depot (HD). See the exact opposite. Blue line crossing below the black line. We actually have the neural index bullish here, and you see how the market sort of runs sideways and a little bit higher for the next couple of trading days.
But over those couple of trading days, you actually see more separation between that predicted moving average and the actual moving average. Then we start to get that downward bearish momentum here.
So here in shares of Home Depot, market is off now about 5% here in the past 14 trading days. And you see how accurate these predicted highs and lows are. So when you want that guidance to even do some short-term trading, understanding that look — if you can get a position on near these predicted highs, well, that’s where you can exploit that downward momentum in the market.
To about five entries here where essentially the next trading day you’re shooting down towards the subsequent predicted lows that are forecast from the VantagePoint software as well.
So, uh, nice opportunity on the bearish side. Certainly areas to avoid, and we’re seeing a lot of building construction materials — this whole sector not performing well. You know, earlier in the year we really highlighted a lot of the strength in the home builders, but that has shifted and really not been an area where you want to focus any of your trading.
Acadia Healthcare Company ($ACHC)
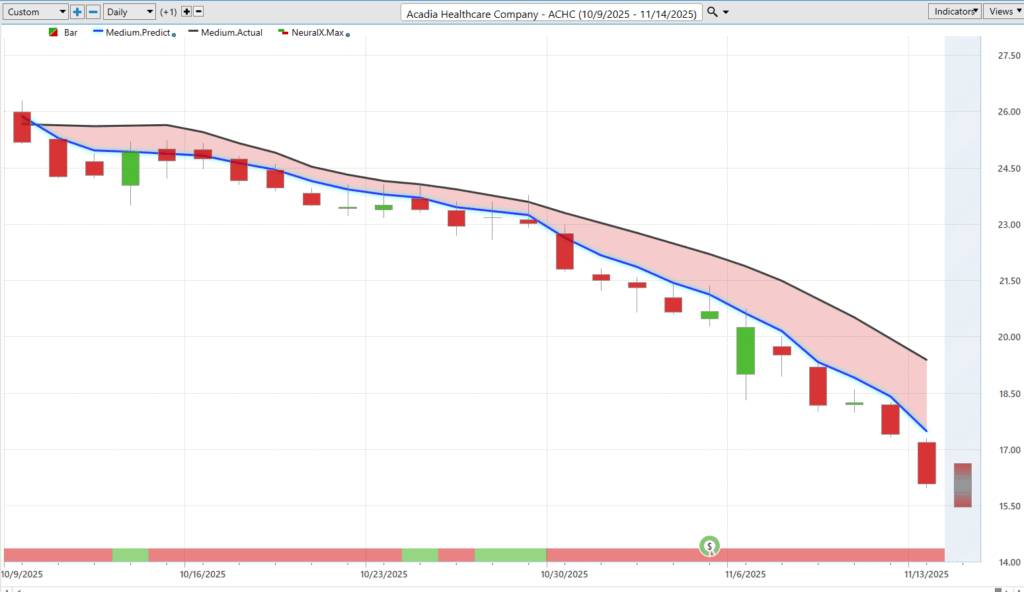
Lastly here, Acadia Healthcare Company (ACHC) — another just great example of markets that are in downtrends, in areas where you might want to avoid any trading or potentially do some bearish trading and express that bearish bias on the market here.
Here you see this blue line crossing below the black line. Get these little blips where the neural index goes bullish and you get some of this sideways consolidation in the market, but very clearly here the market in a downtrend.
And so when you really want to fine-tune some of those entries in the market, we identify some areas to exploit the weakness. Well, you really see how this works. Now, you’re not going to hit these levels every day, but you see it does a very good job of analyzing the intraday range and highlighting some levels to do some trading from, and really make things quite simple as far as understanding the overall trend — anticipating some of that short-term strength or weakness in the market so you don’t get kicked out of your position, and really fine-tuning an actual entry to exploit some bearishness.
So here we see shares off 36% here just in the past 25 trading days.
So, very interesting stuff — again, seeing a lot of volatility in those broader indices, which by definition almost means a lot of the markets are starting to skew in a bearish way. And when you have a tool like VantagePoint, well, that’s going to be pretty evident as we see most of these predictive indicators and predictive forecasts start to get bearish as we move through this period of time.
So once again, this has been the Hot Stocks Outlook for November 14th, 2025. Thank you all for watching. Best of luck out there, and bye for now.


