


Hot Stocks Outlook for the Week of
November 6th, 2020
The Hot Stocks Outlook uses VantagePoint’s market forecasts that are up to 87.4% accurate, demonstrating how traders can improve their timing and direction. In this week’s video, VantagePoint Software reviews forecasts for Steve Madden (SHOO), United Therapeutics (UTHR), SNAP (SNAP), Apartment Investment Management (AIV) and Chicago Mercantile Exchange (CME)
Register for a Free Live Training
This Week’s Hot Stocks Outlook
Hello again, traders, and welcome back to the Hot Stocks Outlook for November 6, 2020. Hope you’re all having an excellent week out in the financial markets, and as always, a lot to cover here in today’s outlook. A lot of volatility in the markets here. We’re going to start with Steve Madden shoes. We looked at that a few weeks ago. We got United Therapeutics from last week. Snap, we’ve got Apartment Investment and Management, and lastly the CME stock, here.
Steve Madden (SHOO)
Now, starting out here with Steve Madden, what we have here, and really with every single forecast we’re going to look at here is daily bars and candles. Each one of those candles represents a full and complete trading day. Right up against that price data you’ll see that there is a black line and also a blue line, in addition to the bottom of the chart you’ll see this indicator that goes from green to red. Also a shadow candle, which is actually a predicted trading range. Starting with that black and blue line, what we have is that black line that you see there, that is a regular simple moving average, or what we refer to as the actual simple moving average. That’s a very common technical indicator. It looks back at previous close prices and adds all those together, and then divides by how ever long you want that moving average to be, right?
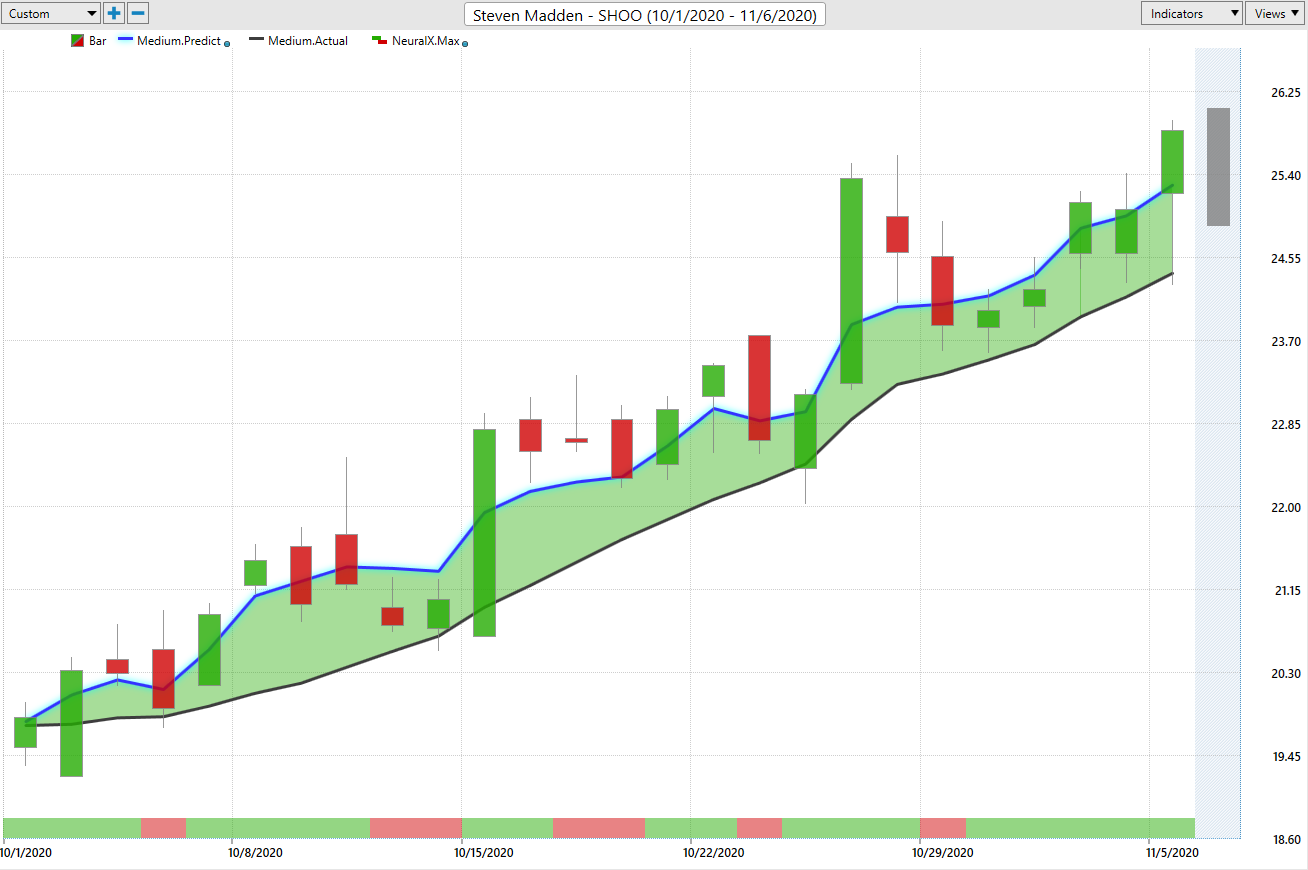
What that acts as, is a really good measure of where market prices have already been over a given period of time, but traders obviously need to be ahead of the move and understand where are prices going to start moving next. What we’ll want to compare that black line and that value to is this blue line, or that value that’s generated each and every trading day, and it’s important to understand that for that value to be calculated, vantage points not just looking at the past, like a simple moving average. What it’s doing is actually utilizing artificial neural networks to do what’s called intermarket analysis. That means, specifically to Steve Madden, there’s been determined to be markets that are known to drive and influence and effect future price.
Now, that can be big markets like the S&P500, right, things like the dollar index, global interest rates, but also ETFs and individual stocks, where those correlations and relationships may be leading or lagging relationships, that could be positive or negative correlations. What it’s able to do is use that information to actually generate true predictions, so instead of data from the past, it’s actually generating actual predictions about the future, and utilizing that data to actually generate where our average price is moving next.
Whenever you see that blue line cross above the black line, it’s saying average prices are going to start moving higher. Now, in addition to that being a very good measure of the overall trend direction of the market, at the bottom of the chart here, you see this bar that can go from green to red back to green, this is also utilizing that technology of neural networks, but it is tuned to look ahead 48 hours, and that’s really the key is that when utilizing this technology, you want to say, “Okay, well, what are we trying to predict?”
What this is able to do is forecast short term strength or weakness over that 48 hour period, essentially looking ahead two trading days, and saying, “All right, is there short term strength or weakness in the market?” You’ll see that whenever that neural index goes barish, you oftentimes see some weakness over the subsequent 48 hours, but this is an extremely accurate indicator in that it gets it right most of the time, but you have a context to put that in, right? If the overall trend is up, and you know you want to be long, you understand, hey, there might be some weakness here, but as long as that blue line is above the black line the overall market prices are expected to move higher.
You see about a 25 percent rally here in the past 24 days. Obviously a lot of volatility in the markets. The overall S&P moving much, much higher through this election period, but you understand, well where are those areas where you’re in strong trends and likely to benefit from that volatility coming through. For trend traders, you obviously get a nice 25 percent rally from where that forecast comes through as far as the blue line crossing the black line, but we also provide predicted highs and lows for each trading day. You actually see this shadow candle ahead of the fact, ahead of the trading day, and letting you know, okay, well as far as intraday, where do you want to be taking a position, and all of these levels that you see here are the actual prediction against the actual market day.
What’s going to happen is a candle will fill in here, we’ll see how accurate that candle is, but we can see how accurate each one of these trading days is, and this is extremely valuable to help you understand where to add to your position, where as a day trader you should be coming in and accepting price, and along with that 25 percent, a great opportunity to add to your position, or make more, take some profit at the predicted highs, and have the ability to buy back at better prices at the subsequent predicted lows coming through.
United Therapeutics (UTHR)
United Therapeutics we looked at last week, and a good example of a very strong trend. If we look at really the last five trading days here, we’ve had a continuation of that rally. We can see how accurate those predicted highs and lows are. About a 37 percent rally here, and very clear that this is likely to be a market that continues moving higher through this entire period. You’ve had no weakness from the neural index over the last week, saying look, “Hold on to your position here. If anything, potentially look to buy at predicted lows.”
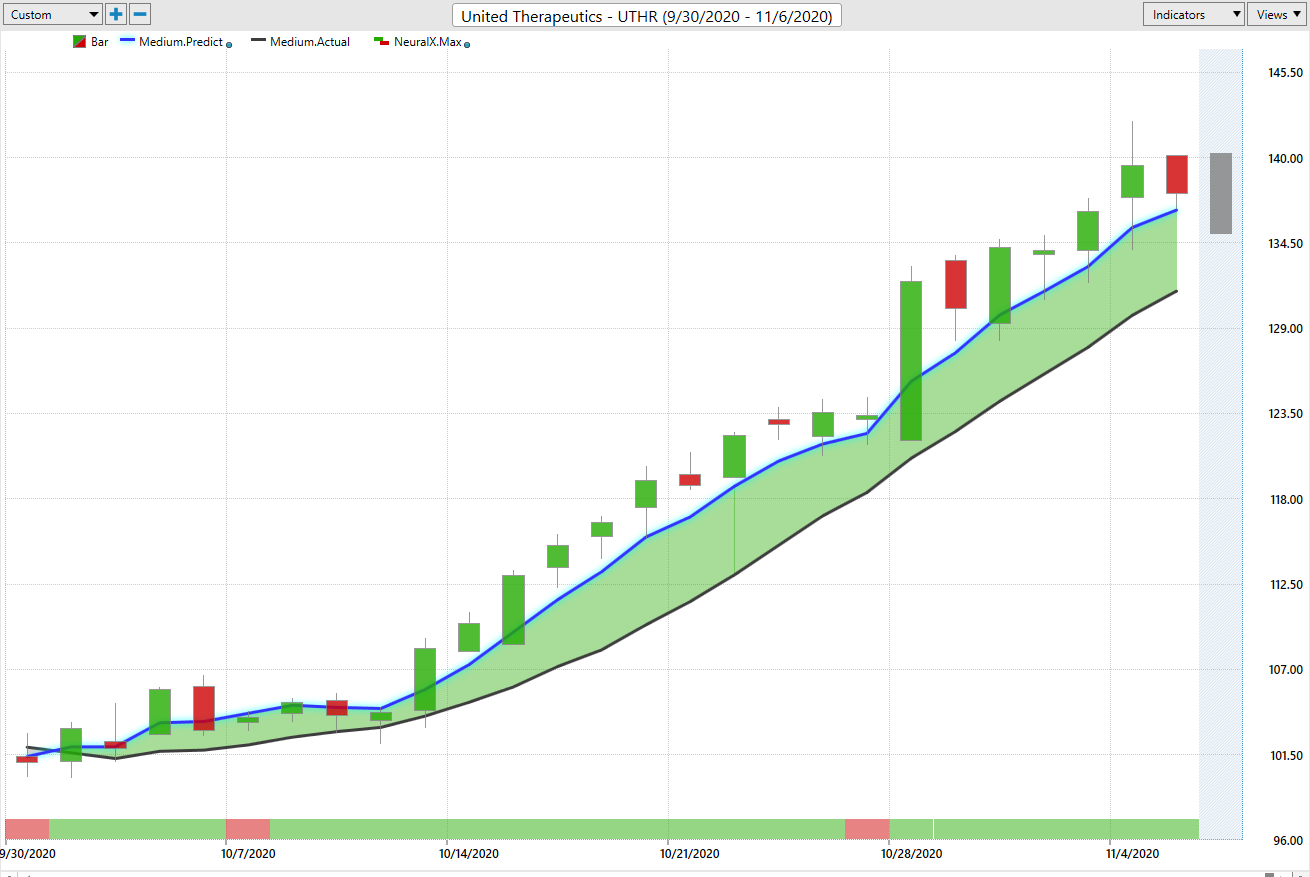
You see how this works. Really exceptional levels as far the overall range and the intraday price levels. An excellent job is figuring out where do you actually want to come in so you can minimize the risk in the market, and get a larger position and potentially make more money as that overall trend continues. We see here a 37 percent rally in the past 24 trading days. 500 share position there, of five option contracts. You got about a $19,000 move just in the past about month of trading here in United Therapeutics. Really nice opportunity there.
SNAP (SNAP)
Here we have Snap, and we saw a lot of the tech stocks, things like that move much higher. This is forecasting all the way back from the beginning of September, end of October, is when this market’s expected to move higher, and the reason this is so important is, you got to get in before volatility really picks up, and when you’re able to take a position down here at $23 a share, it’s going to make a big difference as far as you being able to hold on to that position and really benefit when the overall trend explodes and you see one of these nice moves here.
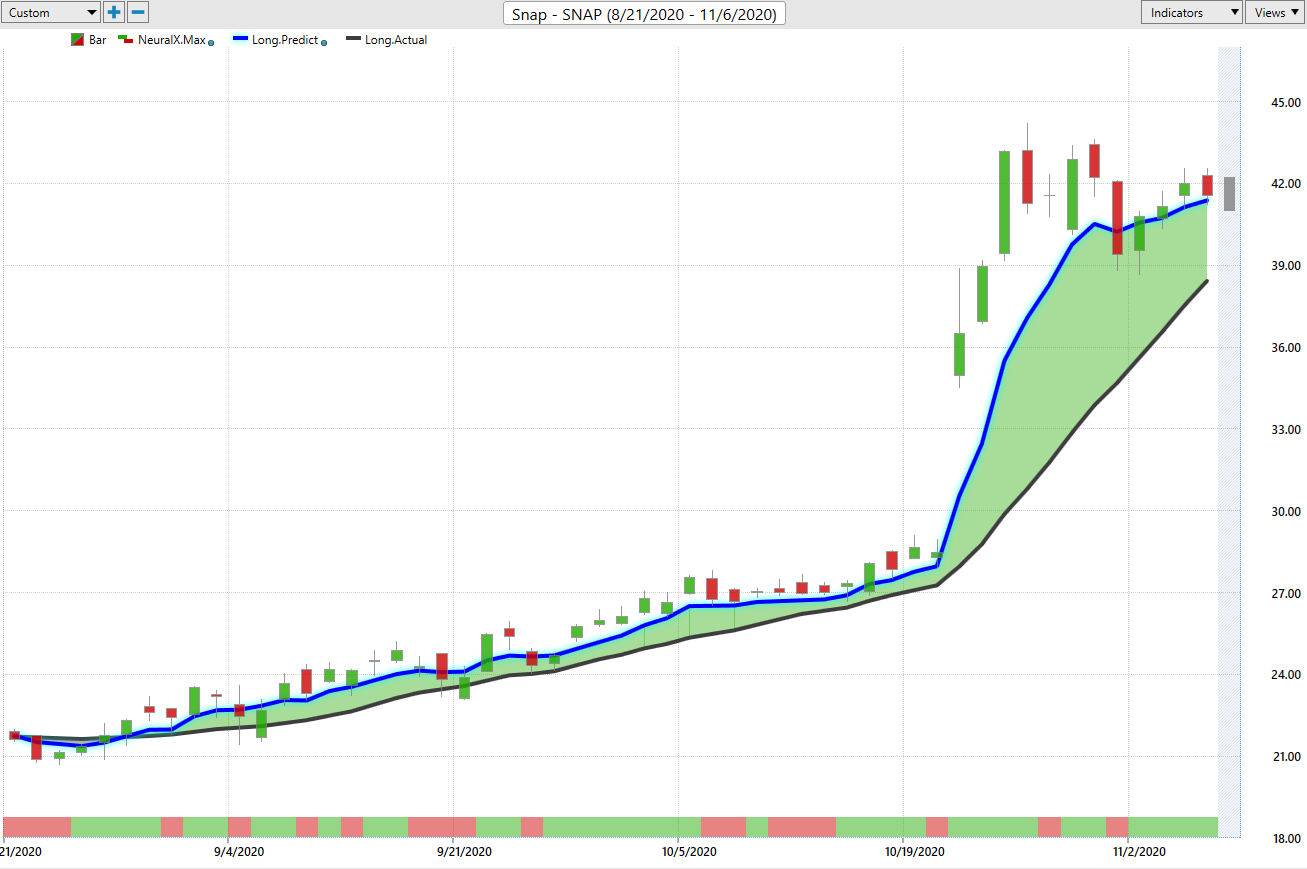
Overall, again, we’ve got a really exceptional move here at 89 percent rally in the past 48 trading days. Again, 500 shares there of a pretty cheap stock, you’re already up almost $10,000 on the long side of that market, but of course, shorter term traders, or again, getting an even larger position if you wan to add hundreds of shares at these predicted lows. Well, where are those levels coming through? Where is Vantage Point day by day saying, “Look, there’s some better price levels to be had as far as short term. You’re not going to hit that predicted low every day, but overall, getting exceptional entries within those essentially 48 hour periods within a trading day or two, you’re already trading higher and continuing on with that overall trend.
Huge opportunity here in shares of Snap, but I do want to highlight that the market’s been quite interesting, and when you go into a period where there’s potentially a high volatility and catalyst like an election or fed announcement and things like that, it’s often helpful to have a hedge portfolio, and understand, okay, well, we know where areas in the market that are potentially strong and in strong uptrend over this period. Well, where’s the weakness.
Apartment Investment Management (AIV)
Well, when we look at a lot of the property companies, here we have apartment investment and management, crossover to the downside here, going all the way back to October, you look at all the property companies, they share strong correlations, and many of them is the exact same forecast. A lot of weakness here, and so you’ll see again, the accuracy of our neural index, letting us know hey there’s strong weakness there, but your neural index says, “Hey, next 48 hours, expect a little bit of strength, but the overall trend’s still down.”
You get that retracement, continuation of trend. Here again, expect some higher prices. You get some higher highs over the next trading day, but the trend very much to the downside and not an area where you want to be long, or covering your position. Right? If you’re a trend trader and you want to hold on to that trend, nowhere close to getting that blue line crossing above the black line.
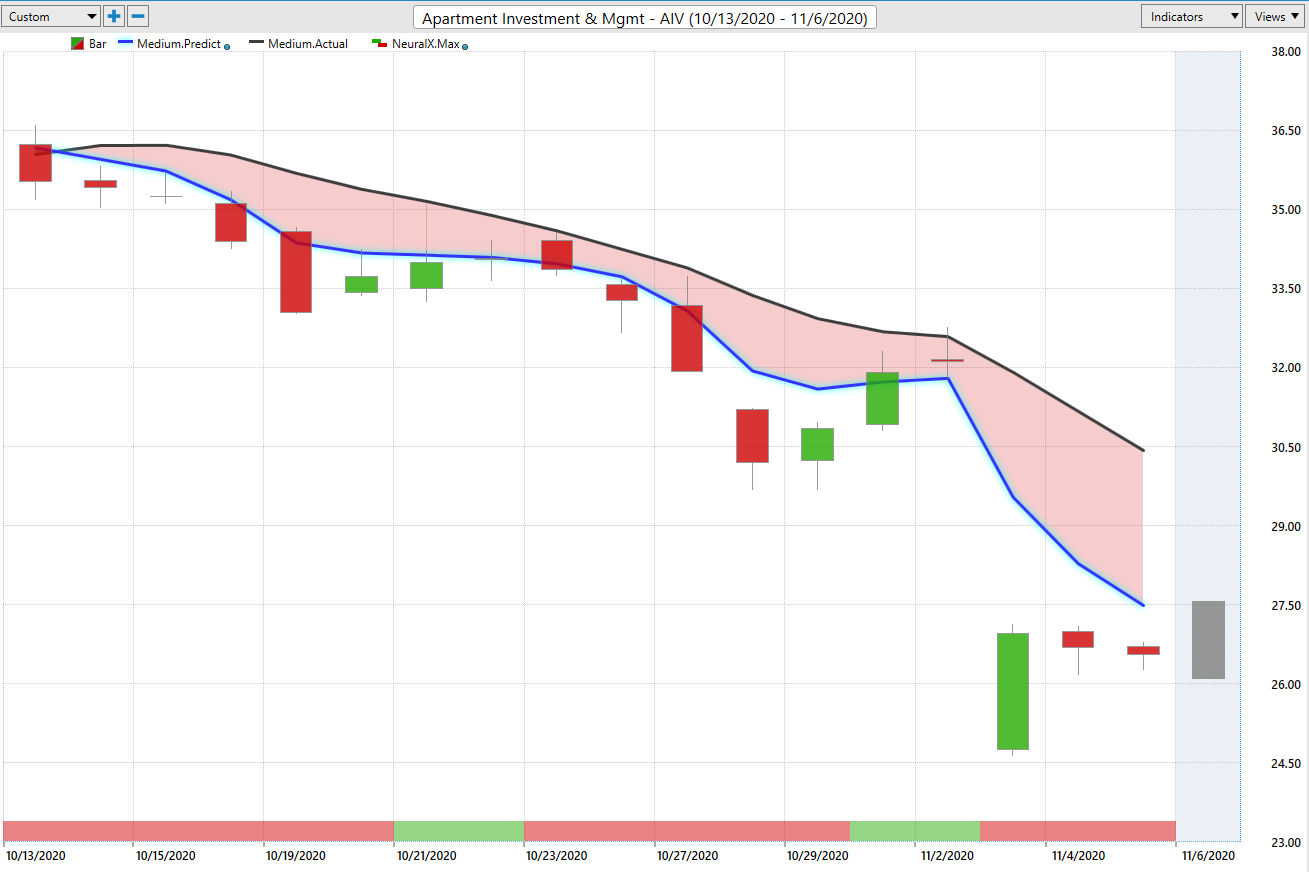
Again, overall, we can see that nice move to the downside thus far, about a 24 percent decline there in just the past three weeks of trading. 500 shares there got you up about $4200 dollars, and again, it’s a great place to find areas where hey, I can be long in the market, benefit if things really explode to the upside, but also be protected on the downside, and potentially make money on both sides of the market, regardless of how the broader S&P is trading.
Again, you’re going to see a lot of areas in the market, specifically, again, property investment and things like that. That’s where the weakness is, and that’s where you do not want to be taking long positions in the market place. Really nice decline there, about 25 percent.
Chicago Mercantile Exchange (CME)
Lastly here, the CME, Chicago Mercantile Exchange. Here we have again, very similarly, crossover to the downside in mid October, and nothing coming through here suggesting that there’s any areas of strength here. You see that we’re getting these little bursts here as far as neural index getting bowlish. You see a gap up here, sideways action, but the overall trend’s still very week.
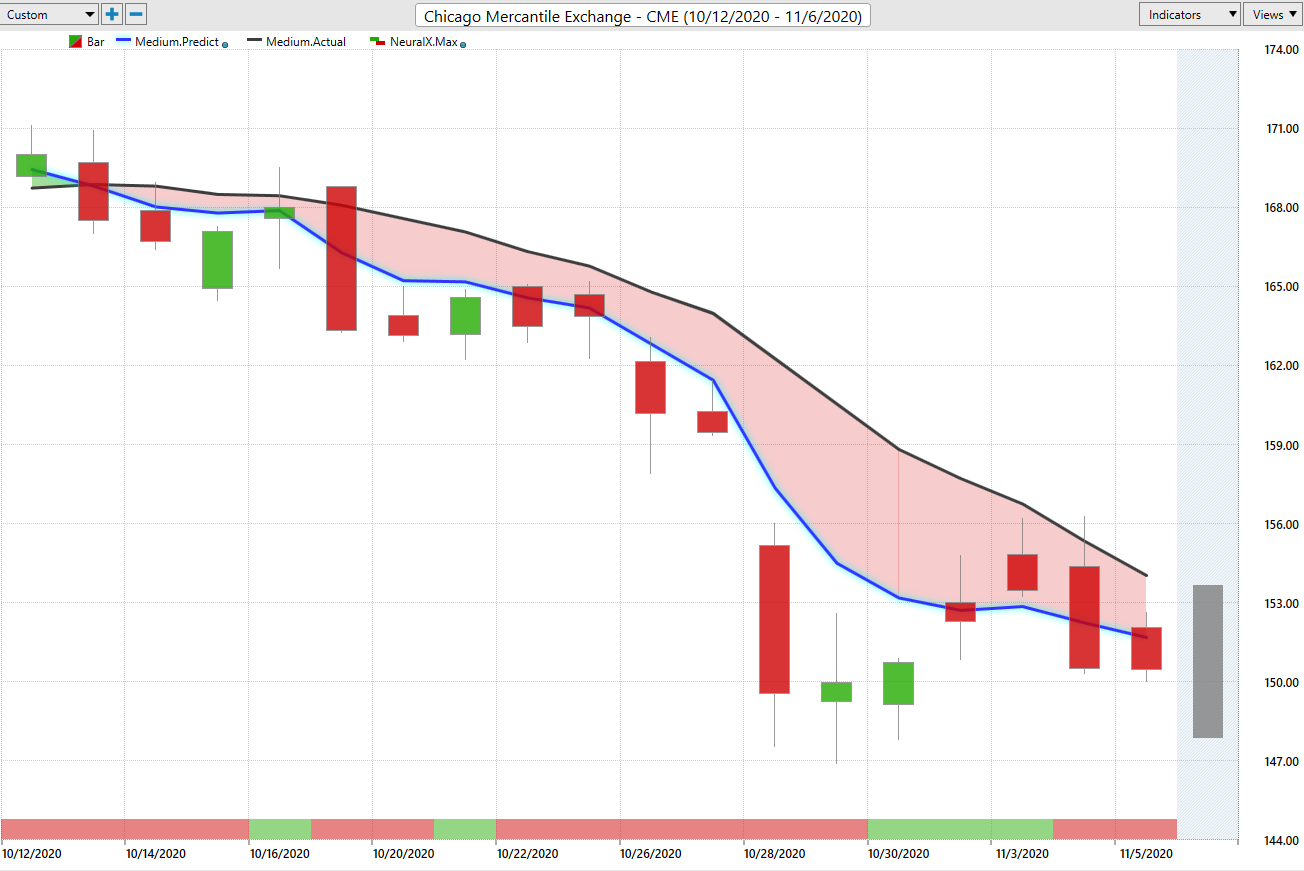
That’s where Vantage Point’s going to help you in understanding, hey, there may be some strength in the overall trend, but stick to your guns, right? As long as you’re following the forecast, your likely to be coming in adding your position at strategic levels. Of course, again, we can look at those predicted highs and lows and understand that, okay, well, if I want to be short the market, if I want to take profit on those shorts, where do I want to be coming in intraday as a trader, and getting the best of those current market participants.
Overall, we’ll take a look at CME here. We’ve gotten a pretty nice decline here of about 10 almost 11 percent in the last 16 days, and again, 500 shares has you up about $9000 to the downside, and a really great area to hedge the portfolio, right? We’ve identified areas where hey, we can go ahead and get long, look for these levels to come through through the week, if we’re still trying to go ahead and take long positions, but understanding that some of these other areas, certainly not places where you want to be adding into that portfolio and expecting things to move higher.
Once again, this has been our Hot Stocks Outlook for November 6, 2020. Thank you all for watching. Best of luck out there, and bye for now.


