


Hot Stocks Outlook for the Week of
October 11, 2019
The Hot Stocks Outlook uses VantagePoint’s market forecasts that are up to 87.4% accurate, demonstrating how traders can improve their timing and direction. In this week’s video, VantagePoint Software reviews forecasts for Fifth Third Bancorp(FITB), Macerich(MAC), Beacon Roofing Supply(BECN), Electronic Arts(EA), Wabash National Corp(WNC).
This Week’s Hot Stocks Outlook
Good afternoon, traders, and welcome back to the Hot Stocks Outlook for October 11th, 2018. Hope you all are having an excellent week in the financial markets, and as always, plenty to cover in this week’s outlook. So, we’re going to start out here. We’re going to take a look at a couple of financials. We’ve got Fifth Third Bank, also Macerich here with Beacon Roofing, Electronic Arts, and lastly, Wabash National Corp.
Fifth Third Bancorp(FITB)
So, starting here with Fifth Third Bank, what we have, a really daily price action. So, each one of these candles represents a full and complete trading day, but right up against that price action, you see that there is a black line and also a blue line. Now, the black line is a regular, very common technical indicator, called just a simple moving average. We refer to it as the actual moving average. What it does is simply take the previous 10 closed prices, add them all together, and then divide by 10, and it’s a good barometer of where prices have been in the past. But obviously, we want to know, okay, well, where are prices going moving forward?
And so, what VantagePoint is able to do to generate not only this blue value but this indicator at the bottom and also a predicted trading range. It’s actually utilizing the technology of artificial intelligence, more specifically neural networks, to understand how up to 35 markets are influencing and affecting the future price of Fifth Third Bank. Now, that’s going to be things like other financial stocks. That’s going to be ETF groups, like financial ETFs, a dollar index, currency futures, interest rate futures.
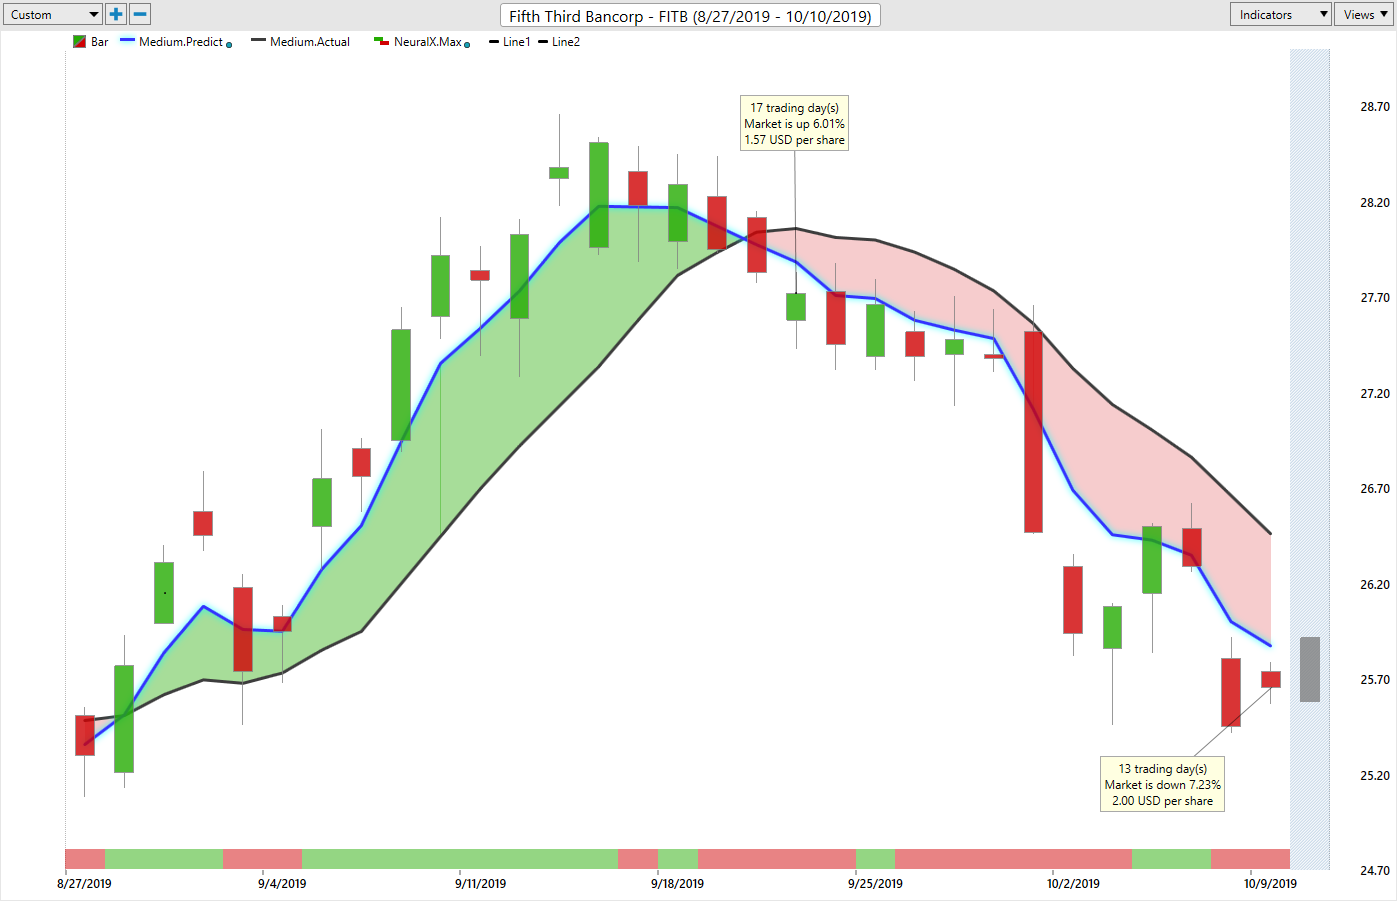
It’s using all of that information to understand how it’s influencing and affecting the future price of, in this case, Fifth Third Bank. So, what it does is it actually generates future data, so data in the future that hasn’t yet happened, and it builds it into the value of its indicators, turning them in from lagging indicators that are just going to tell you where the price has been over a given period in the past to where are average prices expected to move going forward. So, whenever that blue line, as you see, crosses here below the black line, that’s letting you know the trend is expected to start moving lower, essentially average prices are expected to be lower than where they’ve been.
And so, in addition to that predicted moving average, you’re also given a, what’s called, predicted neural index. At the very bottom of the screen, you see that this bar can change from a red to green, and this is also derived via those neural network calculations, but it’s only looking ahead 48 hours at a time. So, very short-term strength or weakness in the market place. You can use that in relation to, well, what are the average prices moving forward, and are we going to have some short-term strength or weakness there?
Lastly, before each and every trading day, you’re actually given a predicted high and low candle. You see off to the very right, letting you know, okay, well, where do you want to put limit orders? Where do you want to take a profit? And so, you’ve really got a roadmap of how you want to trade a particular market. But of course, understand how that market’s going to trade and adjust, and how you can adjust that position. So, we take a look at this and we see that, okay, well, since those crossovers to the downside came through, you have this guidance that says, “Okay, well, look for the market to trade towards these predicted lows.” Ideally, you want to short up at these predicted highs, and you see how every day, these tools really guide you moving forward and give you a roadmap so you can be making intelligent trading decisions based on probability here.
What we’ve seen and just what I want to allude to over the past couple of weeks here with our Hot Stocks Outlook is, we’ve been utilizing the Intellus scan feature, and that allows us to identify when broadly stocks are moving into a downtrend, and that’s what we’ve seen very recently. Certainly, in the financial series, you very clearly have a very large financial stock, as well as J.P. Morgan, a lot of the other things going in the downtrends, and we’ve seen weakness really all throughout the market over the last couple of weeks.
Macerich(MAC)
A very similar situation where what happens is, you run your scan in the evening to find fresh, new crossovers between that blue line and the black line, and when you have a lot of financial stocks or just a lot of very similar stocks doing the same thing, as well as we looked at, the S&P 500 gives you a good clue of where is the overall market headed, and therefore, how should I position myself based on my trading approach?
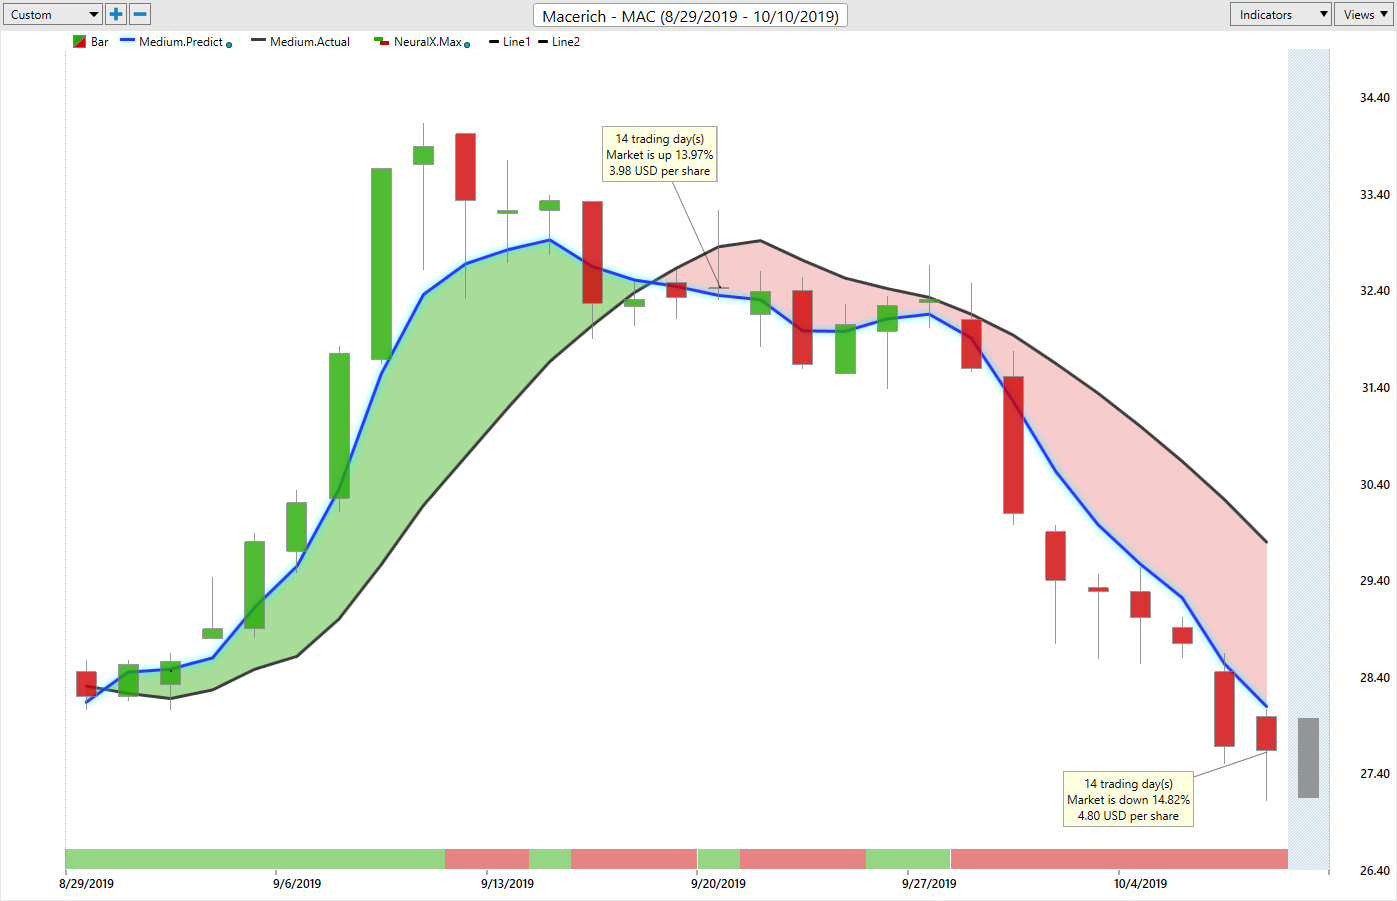
You see that blue line crossing below the black line neural index at a zero here, but what’s interesting and what I just want to highlight is how these tools work moving forward. You may get into a trade and you see that neural index pops up to green there, pops up to green here. But remember, that’s just short-term strength over the next 48-hour window. How I like to think of this is understanding that, yeah, you may trade on the bullish side of the predicted moving average, but the blue line and the black line are still separated. You see that red filler, making sure you understand, look, the overall trend is down, and once everything really snaps together, neural index and trend, you see the acceleration of that move. And so, just like, really, a lot of the other financials here, you’ve got this roadmap that says, “Okay, well, if this is a stock that I’m looking to short, how should I look to go ahead and manage that opportunity?”
Beacon Roofing Supply(BECN)
Day-to-day here, you see this market off 15% just in the last 14 trading days. So I mean, not even a month of time, you see some of these shares off 15%-20%. You definitely want to not be initiating new, fresh positions going into the end of September here. We’ve just seen a lot of the markets pull back and get weak here, and certainly, better opportunity for better prices once we start seeing those crossovers move to the upside, but here’s Beacon Roofing.
Again, more crosses to the downside neural index. You’ll get those little periods where you see that you’re no longer moving down. You move sideways for a few days as that neural index says, “Okay, a little bit of strength, but look at the separation between that predicted moving average and the actual,” and you see things really start to collapse and move lower. So, there’s been plenty of different areas throughout the marketplace to go ahead and benefit from this weakness that we’ve seen in the overall market, but you certainly don’t want to get caught on these things. See another market here down a little bit over 8% here over the duration, and again, you’re seeing a lot of markets down 10%-15%.
Electronic Arts(EA)
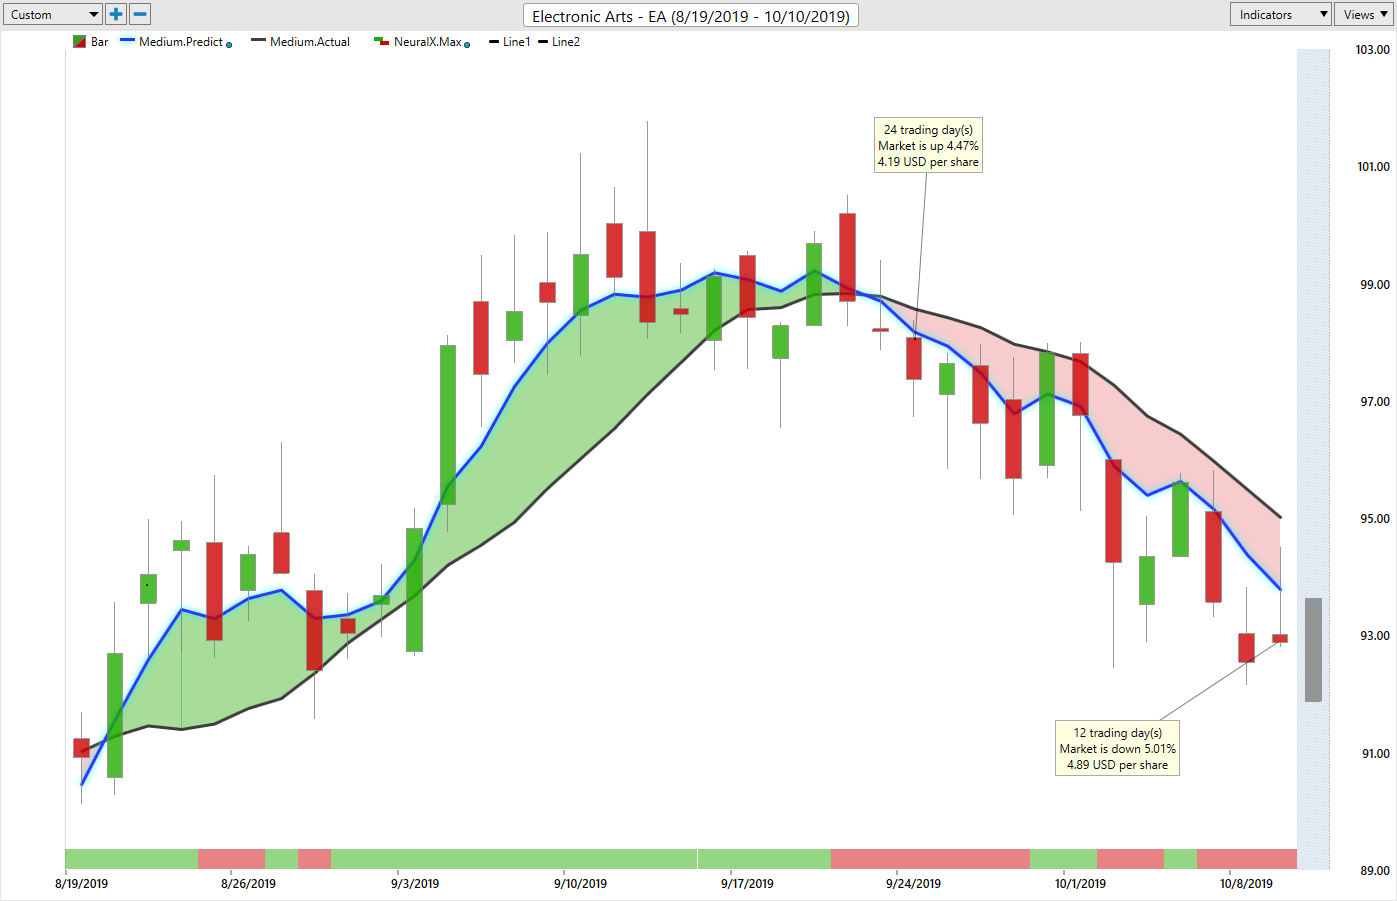
Here’s Electronic Arts. Again, you see all these crossovers coming through at the end of September that was warning you, look, for the last few weeks, you’ve wanted to be shorting, taking profits on shorts, and that’s pretty much it. As soon as things start moving to the upside, go ahead and start reversing those positions, but you’ve just seen so many markets start to make some significant pullbacks here, and it’s opened up some really tremendous trading opportunities.
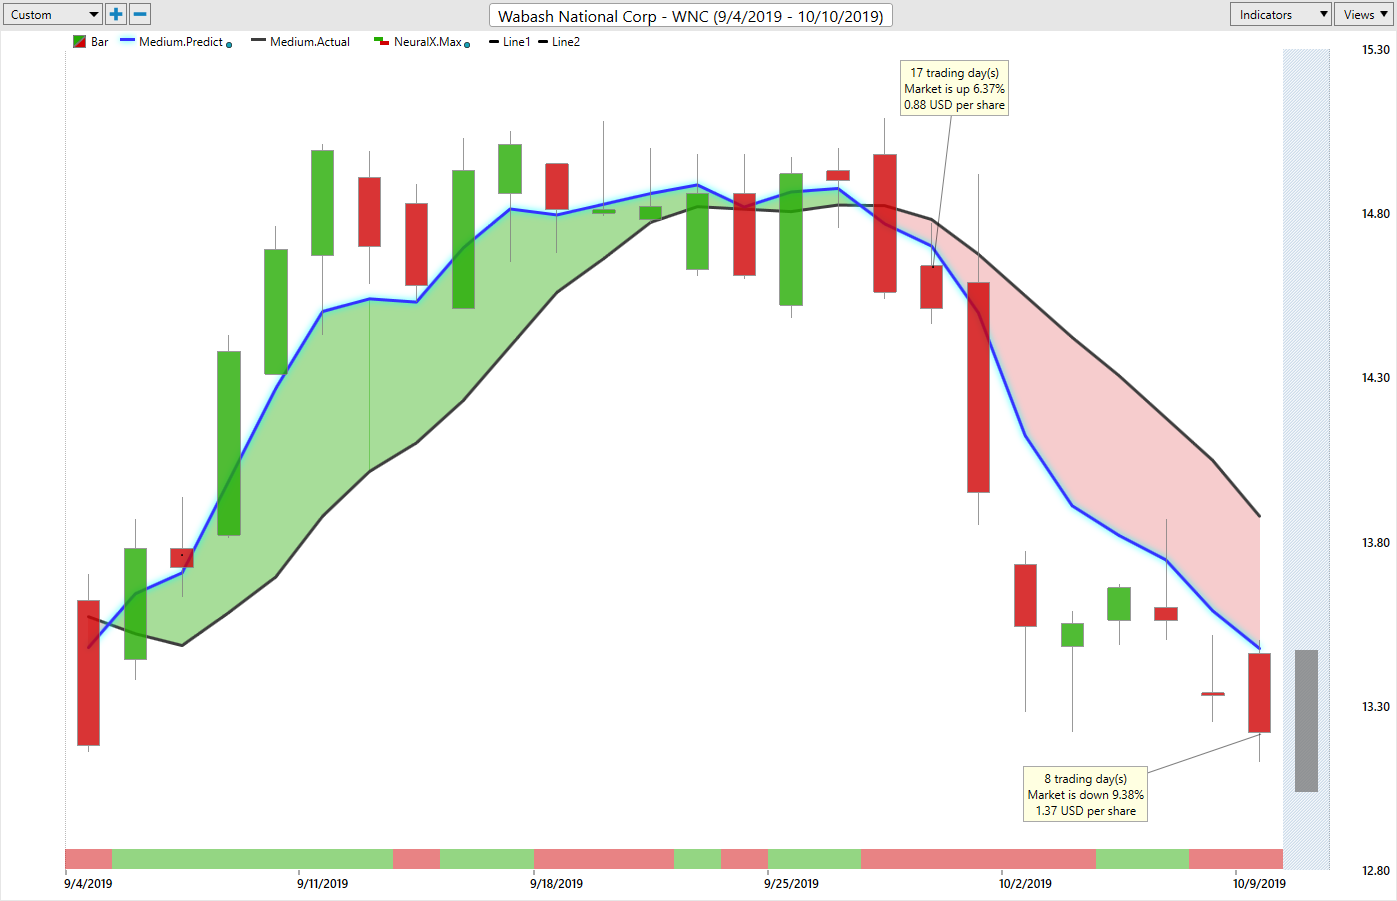
Wabash National Corp(WNC)
So, here, a little bit more recently, Wabash Corporation, clear crossover to the downside. It gives you only one way to trade that particular asset. And so, going into the trading day, you’ve got the help of those tools that predicted range adjusting each and every day, and you see how it really helps and lets you know, okay, well, if you want to short, short up at these predicted highs, and you get that resumption of the downtrend there.
So, really great tools here that have done a really fantastic job over the past few weeks, especially, at letting us know that, hey, there’s some weakness coming, especially through our scans and letting us know that, look, financials are weak, all these different sectors. We’ve got materials, tech, transportation, as well as the S&P 500 gives you a very clear roadmap of what a trader should be doing and how they can benefit from that move in the marketplace trail stops and get involved in a really significant opportunity here. So, really nice opportunity to see 10% here, about 5% or 6% over the past couple of weeks, 9% here, 15% and another 7% or 8%, and this is all just in the past few weeks, very clear to see this really wave of weakness coming through here.
So once again, this has been our Hot Stocks Outlook for October 11th, 2019. Thank you all for watching. Best of luck, and bye for now.


