VantagePoint : VantagePoint Intermarket Analysis Trading Software Review
Company News and Press Releases
Software Review

By DARRELL JOBMAN
Market Technologies, LLC 5807 Old Pasco Road Wesley Chapel, FL 33544 U.S., Canada: (800) 732-5407 International: (813) 973-0496 Website: www.VantagePointSoftware.com
OVERALL RATING: 
Beginner to advanced.
$3,500 for a three-market package (substantial discounts for additional programs).
RECOMMENDED SYSTEM: Windows 95/98, ME, 2000, NT or XP; 16 MB RAM minimum; CD-ROM drive; internet connection.
When Lou Mendelsohn decided to leave a career as a hospital administrator to trade and develop trading software full-time in 1979, he focused on ways to tap the capabilities of the then new microcomputer to test the performance of various trading strategies. That led to the release of ProfitTaker in 1983, the first commercially available microcomputer trading software to perform strategy backtesting and optimization. Futures, known as Commodities at the time, published three of his articles in 1983 explaining his goals and the significance of testing a history of prices.
But Mendelsohn realized successful trading meant more than analyzing past results. Intuitively, traders know that price action in one market is affected by developments in a number of other markets, but the challenge is quantifying the impact. Traders also like to use moving averages to discern trends, but theses averages are lagging indicators trailing price activity and not very useful in price forecasting.
During his research to find solutions for those two issues in the 1980s, Mendelsohn discovered that neural networks were ideally suited to analyze complex relationships between multiple markets. His pioneering work in intermarket analysis led to the development of VantagePoint Intermarket Analysis software, first introduced in 1991 but retrained at least annually so it’s always “new” to reflect current intermarket influences.
INSTALLATION
Installing VantagePoint was quick and easy, following step-by-step directions in the user’s manual that are about as clear as any directions you will ever find for a software program. The only quibble is that you have to configure each market one by one. If you get all 43 markets offered on VantagePoint, you have to go through the process 43 times. It’s certainly not difficult, but it is tedious. The good news is that you only have to do it once, but it seems that operation could be more automated.
The setup also involves getting lined up with one of two end-of-day data providers for daily updates – Commodity Systems Inc. (CSI) or Genesis Data Services. A high-speed internet connection to CSI was smooth and data flowed in flawlessly every day.
ANALYSIS
Mention neural networks, artificial intelligence, pattern recognition, fuzzy logic and the like, and you probably are thinking “black box” program that’s much too complicated to comprehend. VantagePoint has aspects of a black box as the innards of the neural networks are not disclosed and you can’t change the program’s parameters. But most traders are not interested in delving into such details anyway. All they want is a number, and VantagePoint provides one every day that even beginning traders can use to gauge the tone of a market without knowing anything about neural networks or even that much about technical analysis.
VantagePoint uses five neural networks to predict tomorrow’s high and tomorrow’s low; a neural index that indicates whether the program expects a market top or bottom within the next two days, a five-day moving average of closes for two days in the future and a 10-day moving average of closes for four days in the future.
The numbers calculated for a target market involve analysis of nine related markets. For example, if you are looking at euro futures, the analysis includes not only euro futures but also the euro cash market, British pound, U.S. Dollar Index, eurodollar, gold, Japanese yen, Swiss franc, S&P 500 Index and 10-year Treasury notes all of which influence the euro. VantagePoint provides forecasts for 43 markets in all, including grains, meats, softs, energies, currencies, stock indexes, interest rates and metals.
The results of these calculations are displayed in overlay or displace mode most will likely choose overlay and in several different forms. The History Report provides a longer-term table of the basic data. The Daily Report, the key page for most VantagePoint users, displays three tables: Section one covers actual price and moving average data. Section two provides predicted price highs and lows and moving averages. Section three presents the difference between the predicted and actual numbers.
CHARTING 
You can also view the information in chart form (basic bars or candlesticks) on which you can choose to view a dozen items produced by the program. The default shows lines for the actual moving average and predicted moving average, looking much like two moving average lines. One quibble is that when you open a chart the vertical line cursor that displays price details sits right on top of the last bar, the very bar you most want to see, so you always have to move the cursor to see it.
VantagePoint is not a charting package with all the bells and whistles offered by other analysis programs. However, for experienced VantagePoint traders, the chart may be just an incidental anyway, useful only to add visual perspective. The real meat is in the numbers in Section 3 of the Daily Report.
The proof of any trading software is how well it does in actual trading, and that’s hard to measure with programs such as VantagePoint because there are so many ways to implement it. Mendelsohn’s tests indicate it achieves nearly 80% predictive accuracy.
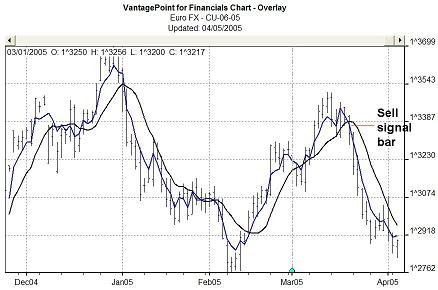
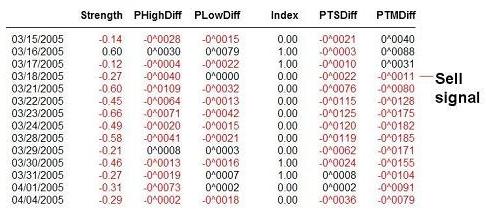
CATCHING THE SELL SIGNALS
 Source: VantagePoint
Our tests weren’t exhaustive, but we did see a number of examples where its crossovers preceded typical moving average crossovers. Of course, VantagePoint can be subject to whipsaws just like moving averages, and it cannot magically have you in a short position if a market opens limit down some day. You still have to use your technical analysis skills to decide where to enter or exit a trade, where to place stops, etc., and you may want to use it in conjunction with other indicators.
How you use VantagePoint depends on the type of trader you are. If you are a position trader, you would probably concentrate on PTMDiff, the last column in Section three where the difference in the actual moving average and predicted moving average shows up in a series of rising or falling numbers. For example, when the number changes from positive to negative, you might sell. The euro table and chart show how such a signal looks (see Catching the sell signals, left). If you are a short-term trader, you may do the same thing with the PTSDiff column. If you are a day trader, you might trade against the day’s predicted high or low given in Section 2.
Source: VantagePoint
With the program giving them confidence about price direction, some VantagePoint users have developed precise trading rules based on the program’s output. But VantagePoint is not a black box program with one number for all and it is not the holy grail. Instead, it is a powerful indicator that evaluates the strength of a current price move and provides a signal when a trend may change, sometimes days before it becomes evident with moving averages. That can make VantagePoint’s rather high price a bargain in a hurry.
Darrell Jobman is a free-lance writer based in Kenosha, Wis., and has been writing about futures markets for 35 years.
Reprinted from Futures Magazine Copyright © 2005 Futures Magazine Group Office 833 W. Jackson 7th Floor, Chicago, Ill. 60607 (312) 846-4600, Fax (312) 846-4638