


In the fast-paced world of trading, participants are inundated daily with an avalanche of narratives and news stories. Each day, markets are swayed by countless perspectives, rumors, analyses, and speculative opinions, creating a cacophony of information that can overwhelm even the most seasoned traders. This deluge of data, while ostensibly informative, often serves to cloud judgment and complicate decision-making, as traders grapple with aligning this incessant flow of information with their individual trading theses. The task of sifting through this information to find actionable insights can seem Herculean, leading many to question the necessity of keeping abreast of every twist and turn in the narrative landscape.
However, amidst this relentless barrage of information, a fundamental truth remains paramount in the trading world: the only thing that truly matters is what price does. Price action is the ultimate arbiter of success and failure in the markets, a distilled reflection of all known information as interpreted by the collective mindset of the market’s participants. Understanding this can liberate traders from the gargantuan task of processing every piece of news and opinion. Instead, by focusing on price movements and trends, traders can cut through the noise and concentrate on what genuinely influences their trading decisions. This approach emphasizes the practical over the theoretical, the observable over the speculative, underscoring the notion that in the realm of trading, actions—specifically price actions—speak louder than words.
Let me state it this way. I’ve never met a rich trader who was obsessed with economic narratives being woven by the media. Yet despite this, unless we are very careful, we are drawn to stories, tips, and opinions from experts in the hopes that it will shed light on our quest for profits. I propose that all great traders recognize that you can never vanquish uncertainty. Instead, we must always balance the probabilities of being correct versus the risk of being wrong.
One of the stark realities traders must face is the understanding that a significant portion of the information they consume daily is not only inaccurate but also largely irrelevant to their profitability. The financial media landscape is saturated with analyses, opinions, and forecasts that claim to provide the insights needed to navigate the markets successfully. Yet, the true utility of these narratives often falls short of their promise. A simple retrospective exercise of paging through old issues of financial media publications can be quite revealing. Upon review, one might question the accuracy of past analyses and the soundness of the advice provided. Had traders acted on these widely disseminated opinions, they would likely find that in many instances, their reliance on such guidance would have been more detrimental than beneficial. This exercise underscores the critical need for discernment in evaluating the plethora of information available to traders.
The internet, while an incredible resource for real-time information and historical data, also exemplifies this issue through its vast archive of content. Platforms like YouTube host countless videos from famous analysts whose market forecasts have attracted millions of views, yet hindsight reveals that many of these predictions have been glaringly off the mark. This phenomenon highlights a fundamental challenge in trading: distinguishing between noise and signal. The allure of following popular opinion or the latest trending analysis is strong, but the reality is that much of this content fails to provide a reliable basis for profitable trading decisions. This abundance of readily accessible but often misleading information reinforces the importance of developing a robust trading strategy that prioritizes empirical evidence and market data over the speculative and the sensational.
This is a major issue for me which I often joke about because of the naivety I faced early on in my trading career. I worked as a commodities broker and was asked to provide end of the day market summaries on the agricultural markets for radio stations that catered mostly to farmers. Every day, at the end of the day, I would report on the prices of what the agricultural markets had done. However, the radio station also wanted commentary of why the markets had done what they had done. While this sounds like a completely reasonable request, it is not. The only way I could provide commentary on why the markets had done what they had done is by literally copying and pasting the commentary from authorities to make my reporting more valuable. The point that I am making is that it is easy to tell someone why the market did what it did. It is an entirely different challenge to be accurate in your analysis stating that.
Most traders never appreciate this reality. So, they get whipped around following a news cycle which is neither objective nor factual. I watch this reality unfold every day in the markets. People want to know the WHY behind market price action which is often impossible to discern.
Let me explain. While preparing to write this article I chose to research my favorite investment and trading portals. In a matter of minutes, I literally located hundreds of stories, that completely captivated my attention. While these stories were interesting, they had nothing to do with my trading. With the benefit of hindsight, I would say that they hinder my ability to focus on price action.
Here is an illustrative list of these news stories which bounce between fear, greed, hope, and despair.
**The Impending Recession**: Predictions about imminent recessions are frequently used to instill fear, urging people to adjust their spending and investment strategies.
**The Bull Market Rally**: Stories of unending market upswings encourage greed and the fear of missing out, prompting more individuals to invest.
**The Housing Bubble Burst**: Warnings or reminders of past housing market crashes stoke fear of a repeat, influencing housing market activities.
**Quantitative Easing (QE) and Its Effects**: Discussions around QE often generate hope or fear, depending on the narrative’s focus on economic stimulation or potential long-term negative impacts.
**Cryptocurrency Boom and Bust**: Tales of overnight millionaires from cryptocurrency investments incite greed, while stories of dramatic losses instill fear.
**Unprecedented Economic Growth**: Announcements or predictions of high growth rates foster hope for a better future and stronger economy.
**Sovereign Debt Crisis**: Warnings about countries potentially defaulting on debt raise fear about global economic stability.
**The Rise of Artificial Intelligence and Automation**: Predictions about job displacement due to AI and automation evoke fear for future job security.
**Climate Change and Economic Impact**: Discussions about the economic costs of climate change and the opportunities in green energy investments generate both fear and hope.
**Global Trade Wars**: Narratives about tariffs and trade tensions create fear over potential impacts on global and national economies.
**Emerging Markets Growth**: Stories highlighting the rapid growth of emerging markets inspire hope and greed, attracting investors seeking high returns.
**Tech Industry Dominance**: Narratives about tech giants driving market gains can spur investment in technology stocks, fueled by greed and hope.
**Interest Rate Hikes or Cuts**: Central bank policies on interest rates can instill fear of inflation or recession or hope for stimulating economic growth.
**The Wealth Gap**: Discussions about increasing wealth inequality can foster a mix of fear for societal stability and hope for policy changes.
**Corporate Earnings Surprises**: Reports of companies significantly beating or missing earnings expectations can drive stock market volatility and influence investor sentiment.
**Bank Failures and Bailouts**: News of financial institutions in distress or receiving government assistance can spread fear about the financial system’s stability.
**Inflation Fears**: Persistent warnings about rising inflation can lead to fear about decreasing purchasing power and economic hardship.
**Technological Breakthroughs**: Announcements of significant advancements in technology offer hope for economic growth and new investment opportunities.
**Political Instability and Economic Impact**: Political events or instability are often linked to economic uncertainty, generating fear or hope depending on the situation.
**Demographic Shifts and Economic Futures**: Discussions about aging populations or shifts in workforce demographics can provoke concern for long-term economic sustainability or hope for new markets and innovation.
**Financial Regulation and Deregulation**: Talks of increasing or relaxing financial regulations can create hope for economic growth or fear of potential financial crises.
**Cybersecurity Threats and Economic Vulnerability**: Increasing awareness of cybersecurity risks can instill fear over potential economic disruptions due to cyberattacks.
**Globalization and Its Discontents**: Narratives around the benefits and drawbacks of globalization can foster hope for economic integration and prosperity or fear over job losses and identity loss.
**Universal Basic Income (UBI)**: Discussions on UBI as a response to automation and job displacement offer hope for social safety nets, but also fears about economic feasibility.
**Healthcare Costs and Economic Impact**: Escalating healthcare costs and their impact on personal finances and national economies can generate widespread concern.
**Retirement Security and Aging Populations**: Concerns over the adequacy of retirement savings amid aging populations can create anxiety about personal financial stability and societal burdens.
**Foreign Investment Flows and Economic Influence**: Narratives about foreign investments can either spark fear over undue influence and dependency or hope for economic revitalization and development.
These narratives are potent tools for shaping public perception and behavior towards the economy and stock market, each carrying the weight to influence investment decisions, consumer spending, and policy debates. They reflect the complex interplay of economic theories, policies, societal trends, and technological advancements that shape public sentiment.
But are they helpful to you as a trader?
My experience has been that while these stories are tantalizing and interesting they have absolutely nothing to do with trading success.
Most traders consume all this news convinced that it is important. Then they are easily overwhelmed when price action goes against the established narrative that they have been consuming. I speak regularly with top traders and their obsession is ALWAYS with the trend and what price action is doing.
An easy way to understand this is to simply reflect on the plight of Amazon from its inception to today. In the early days of the internet, Amazon was a prime example of the dot-com era’s volatile nature, frequently making headlines for its persistent financial struggles. Despite going public in 1997 with an initial stock price of $18, the company faced continuous scrutiny from the media for its inability to turn a profit, quarter after quarter. This period was marked by a prevailing skepticism among journalists, who often criticized Amazon for epitomizing the unprofitable startup culture that was rampant during the late 1990s. The company’s financial reports were a testament to these challenges, consistently showing losses that made many question its long-term viability.
The journey of Amazon through the dot-com bubble further exemplified the extreme uncertainties of internet startups at the time. After its initial public offering, the company’s stock price surged to an impressive $131, only to plummet to a mere $5 during the dotcom bust in 2000. This dramatic fall from grace was emblematic of the broader market trend, where many once-promising companies found themselves struggling to survive. Throughout this tumultuous period, the media’s fascination with Amazon’s struggles was palpable. Journalists frequently took “pot shots” at the company, highlighting its continued losses and seemingly precarious future. This narrative dominated the news, drawing in readers and selling advertising, even as it painted a grim picture of Amazon’s prospects.
Despite the early years of skepticism and financial instability, Amazon’s story ultimately took a turn for the better. The company finally reported its first profitable quarter in the third quarter of 2001, marking a significant milestone in its history. Finding a reporter who had consistently praised Amazon throughout its early struggles would be a challenging task, as the dominant narrative was one of doubt and criticism. However, the relentless coverage and the public’s fascination with Amazon’s roller-coaster journey reflected the media’s role in capturing attention and driving advertising revenue. In hindsight, Amazon’s eventual rise to become a leading e-commerce powerhouse demonstrates how its early price action and perseverance through adversity laid the foundation for its current success. This narrative shift, from skepticism to acclaim, underscores the transformative impact Amazon has had on the retail and technology landscapes, proving early doubters wrong and redefining the potential of internet startups.
The point I am making is that “the news” on Amazon in the early days often defied the price action on the charts. This speaks volumes for traders about what is important and what is just noise.
Let me elaborate on this very important point.
If you are truly obsessed by a trend whenever you trade, you can easily and quickly answer the following questions.
How did the market do compared to yesterday?
Where is it on the week?
Where is it on the month?
Where is it on the quarter?
Where is it over the last 6 months?
Where is it on the year, and over the last 52 weeks?
These are very simple questions. Unfortunately, most traders can’t answer them.
The reason I consider them important is that price action trumps everything else.
Imagine you are in a trade; you are LONG, and a news story breaks that offers disappointing potential. Unless you know where you are in the multi time frame trend, you don’t know how or if to respond.
There are millions of tools out there to assist with finding trends. I like to initially rely on good old common sense. The bedrock foundation of technical analysis is that what everybody knows is already reflected in the current price of an asset.
A trend, in its most basic form, represents a general direction in which something is developing or changing over time. It is an identifiable movement that can be observed in data sets.
To ascertain the nature of a trend—whether it is upward, downward, or stagnant—it is necessary to measure the change from a predetermined starting point to the current or end point.
This evaluation allows for a clear understanding of how an asset has moved has over a specific period. By highlighting this simplicity, traders and investors can make informed decisions by simply identifying what is genuinely strong and what is genuinely weak.
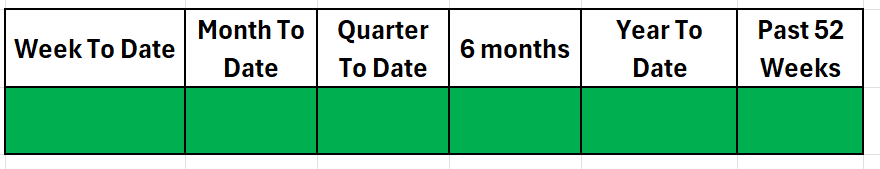
The graphic below provides a basic framework for identifying a very strong trend measured over 6 different time frames. If all time frames are positive, as reflected by the color green you have a market where price action is uniformly rising.
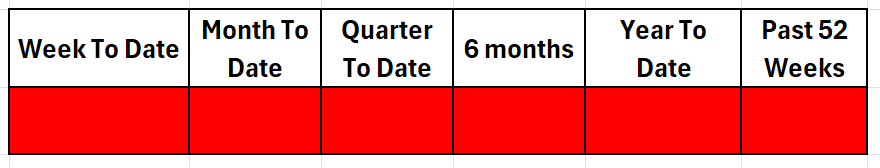
The same is true on the flip side. The way that you can easily measure the weakness of a trend is to witness that if all times frames are falling, as reflected by the color red, you have a market where the price action is falling.
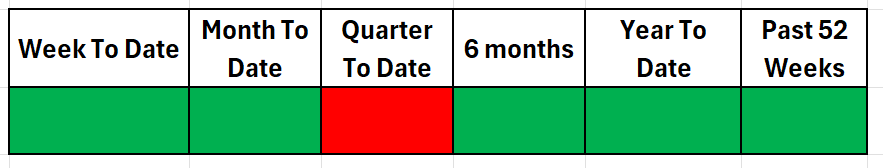
Most markets are not this obvious. Instead, you will often find a trend which is broken like the graphic below which shows that the quarterly price change is negative but the remaining time frames are all positive. In this instance a trader would scrutinize the price level which was measuring the quarterly price change to determine the best move forward.
To determine the strength of a trend, it is advantageous to analyze its behavior across multiple time frames simultaneously. This multi-timeframe analysis can include periods such as weekly, monthly, quarterly, semi-annually, year-to-date, and over the last 52 weeks. By observing the trend across these diverse intervals, one can gain a comprehensive understanding of its persistence and strength. A trend is considered strong and robust if it exhibits positive growth or movement in the majority of these time frames, whereas a predominance of negative outcomes across these periods would indicate a weak trend. This approach not only simplifies the definition and understanding of strength and weakness in trends but also enhances the precision of forecasting. Through this methodology, traders and investors can better navigate the complexities of various markets, leveraging the insights gained from multi-timeframe trend analysis to optimize outcomes.
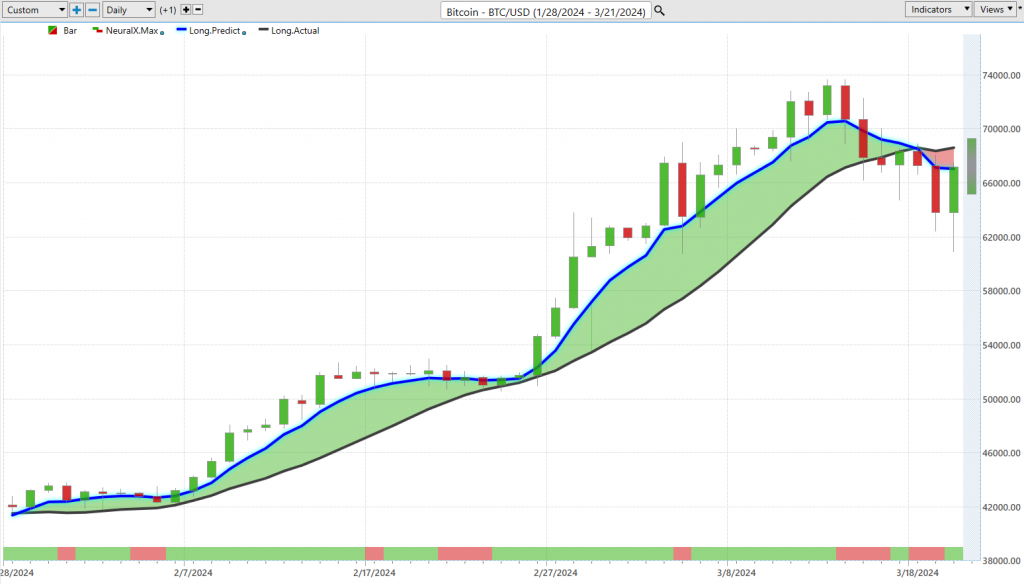
To provide context, in our regular weekly stock studies we perform these types of analysis regularly to shine a spotlight on price action and clearly define risk. For example, here is what this type of multi time frame analysis looks like for bitcoin at the present time. The percentages are calculated from the opening price to the current price of the time frame being measured for the week to date, month to date, and quarter to date. The 6 months, year to date and past 52 week measurements are calculated for the closing price of the day before that time frames calculation begins. There is no special magic to this. It is just an explanation of how I do it and explains why there are small differences in the quarter to date and year to date calculations.
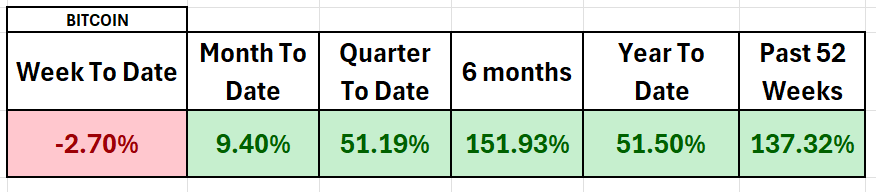
Bitcoin recently experienced a 15% decline from its recent peak, but you can see from the multi time frame analysis all other time frames are still very positive. You would need to see the monthly time frame turn negative to even begin making a negative case as far as the long-term trend is concerned. This is a very simple and practical way to focus on price action. Naturally, I would recommend always cross-reference the multi time frame analysis with what the artificial intelligence is forecasting.
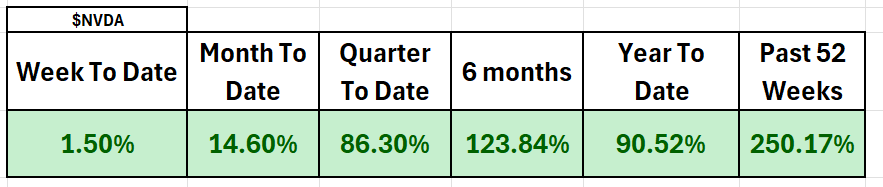
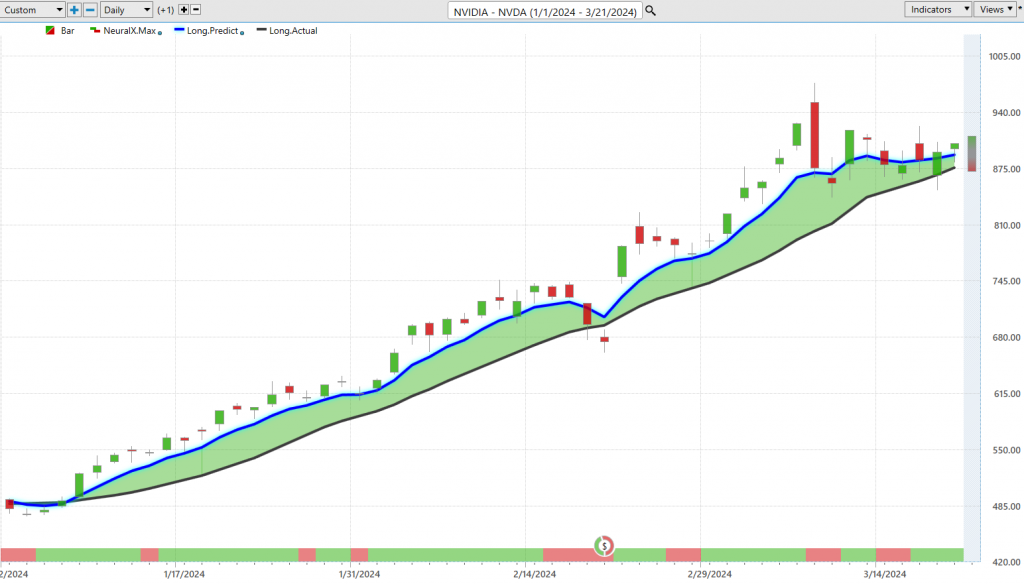
Here’s a snapshot of NVIDIA. How can you make a bearish case for $NVDA when all time frames are extremely positive. This doesn’t mean you should go out and blindly purchase it. It clearly states that the TREND is UP regardless of what time frame you measure it against.
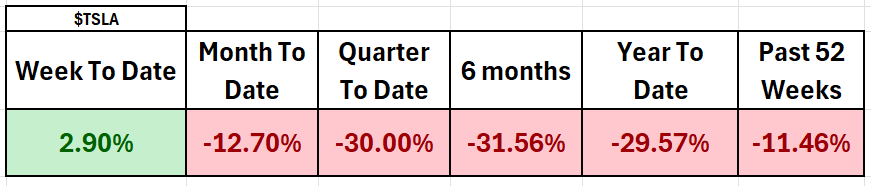
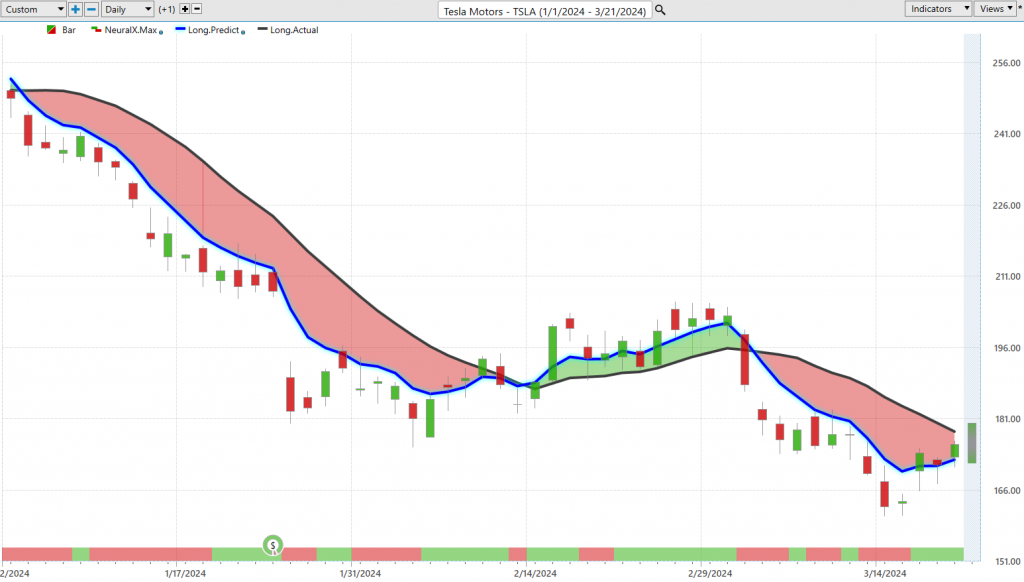
Here’s a snapshot of TESLA ($TLSA). This is more representative of the challenges that many traders get into. Tesla is clearly in a downtrend across 5 of the 6-time frames measured. Based upon this graphic, I would choose to focus on greener pastures elsewhere.
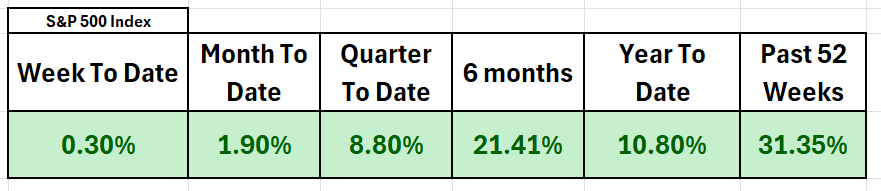
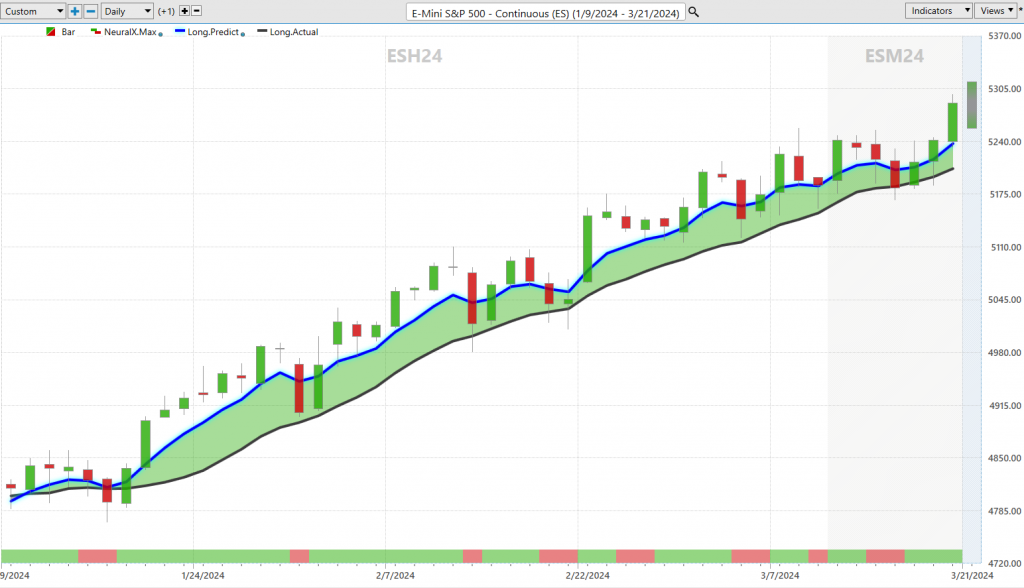
Lastly, here is the multi time frame analysis graphic of the S&P 500 Index. I can think of at least 50 different opinions that I have read about how a market crash is coming. But regardless of how you measure the trend, the market keeps climbing.
I share these graphics to illustrate the point that doing this type of analysis is simple, practical, and incredibly useful. This is always my starting point for any trade or investment that I am looking to make. I find it much more helpful than any news article I would digest from the financial media. I would strongly urge you to implement this simplicity into your decision-making process.
Instead of trying to predict the start or end of a trend, focus on what the market is telling you now and respond accordingly.
Want to refine your process even further? My suggestion is to incorporate artificial intelligence trading software into your decision making framework. As long-time readers of this blog know, fundamentally I am extremely negative about the stock market over the long term. I can spout 100 reasons why the current trend is not sustainable. But I have learned the hard way over the years that my opinions are not an effective way of trading. Instead, I try to find markets where my research aligns with the trend I see as defined by artificial intelligence. Then, it is simply a game of risk management and learning to surrender to the trend.
Folks let’s dive deep into the truth of trading, a truth many of us learn the hard way through the school of knocks. Winning in this financial jungle isn’t just about counting your victories; it’s about absorbing the essence of every setback, every loss. And here’s where the marvel of artificial intelligence stands tall. It sifts through the debris of failure, learns with a finesse unmatched, and embarks on a relentless quest for success. This is the secret sauce behind the success stories of countless traders who’ve turned their fortunes around.
Consider this – A.I. doesn’t just sidestep errors; it actively engages in a perpetual quest for the truth, tirelessly working every hour of every day to refine its strategies. This is a game-changer, ladies, and gentlemen. Don’t find yourself idly waiting for the Federal Reserve’s next announcement. Embrace the most accurate analysis available, powered by artificial intelligence. And here’s a reality check – A.I. has already bested humans in the intellectual arenas of poker, chess, Jeopardy, and Go. Trading is no exception to its dominion. It’s about intelligently leveraging knowledge for gain, and that’s what A.I. excels at.
Why not witness its prowess firsthand? We’re offering a FREE Live Training session where we’ll share three stocks flagged by A.I. as ready to make significant moves. Remember, market movement equals profit potential. Find out why the elite traders swear by artificial intelligence for minimizing risks and maximizing rewards. This is your chance to transform your trading strategy. Don’t miss it!
Intrigued? Visit with us and check out the A.I. at our Next Free Live Training.
Discover why artificial intelligence is the solution professional traders go-to for less risk, more rewards, and guaranteed peace of mind.
It’s not magic. It’s machine learning.
Make it count.
THERE IS A SUBSTANTIAL RISK OF LOSS ASSOCIATED WITH TRADING. ONLY RISK CAPITAL SHOULD BE USED TO TRADE. TRADING STOCKS, FUTURES, OPTIONS, FOREX, AND ETFs IS NOT SUITABLE FOR EVERYONE.IMPORTANT NOTICE!
DISCLAIMER: STOCKS, FUTURES, OPTIONS, ETFs AND CURRENCY TRADING ALL HAVE LARGE POTENTIAL REWARDS, BUT THEY ALSO HAVE LARGE POTENTIAL RISK. YOU MUST BE AWARE OF THE RISKS AND BE WILLING TO ACCEPT THEM IN ORDER TO INVEST IN THESE MARKETS. DON’T TRADE WITH MONEY YOU CAN’T AFFORD TO LOSE. THIS ARTICLE AND WEBSITE IS NEITHER A SOLICITATION NOR AN OFFER TO BUY/SELL FUTURES, OPTIONS, STOCKS, OR CURRENCIES. NO REPRESENTATION IS BEING MADE THAT ANY ACCOUNT WILL OR IS LIKELY TO ACHIEVE PROFITS OR LOSSES SIMILAR TO THOSE DISCUSSED ON THIS ARTICLE OR WEBSITE. THE PAST PERFORMANCE OF ANY TRADING SYSTEM OR METHODOLOGY IS NOT NECESSARILY INDICATIVE OF FUTURE RESULTS. CFTC RULE 4.41 – HYPOTHETICAL OR SIMULATED PERFORMANCE RESULTS HAVE CERTAIN LIMITATIONS. UNLIKE AN ACTUAL PERFORMANCE RECORD, SIMULATED RESULTS DO NOT REPRESENT ACTUAL TRADING. ALSO, SINCE THE TRADES HAVE NOT BEEN EXECUTED, THE RESULTS MAY HAVE UNDER-OR-OVER COMPENSATED FOR THE IMPACT, IF ANY, OF CERTAIN MARKET FACTORS, SUCH AS LACK OF LIQUIDITY. SIMULATED TRADING PROGRAMS IN GENERAL ARE ALSO SUBJECT TO THE FACT THAT THEY ARE DESIGNED WITH THE BENEFIT OF HINDSIGHT. NO REPRESENTATION IS BEING MADE THAT ANY ACCOUNT WILL OR IS LIKELY TO ACHIEVE PROFIT OR LOSSES SIMILAR TO THOSE SHOWN.


