Hot Stock Snapshot was created for one purpose: to help traders quickly understand why a stock from our Hot Stocks Outlook is moving, what themes are driving it, and whether the trend deserves attention. In just a few charts and a few minutes, we isolate the essential story behind the price action. Not the noise. Not the endless opinions. Just the facts, the momentum, the capital flows, and the catalysts that matter. Every Snapshot is designed to answer the most important question in speculation: Who is winning, and why? Because in markets, opportunity rarely arrives with a formal invitation. It reveals itself first in performance.
The Old Network Giant Just Started Acting Like a Momentum Stock
Cisco is one of those companies Wall Street thought it had figured out.
For years, $CSCO was treated as a mature technology name steady, profitable, useful, but not exactly the kind of stock traders expected to explode off the screen. It sold routers, switches, security tools, networking gear, collaboration systems, and infrastructure software. In other words, it helped build the digital plumbing of the modern economy.
But the market has a funny way of reminding investors that “boring” can suddenly become very interesting when money starts moving.
And right now, Cisco is no longer trading like a sleepy tech dividend story. It is trading like a stock that has been re-rated.
Revenue & Earnings History
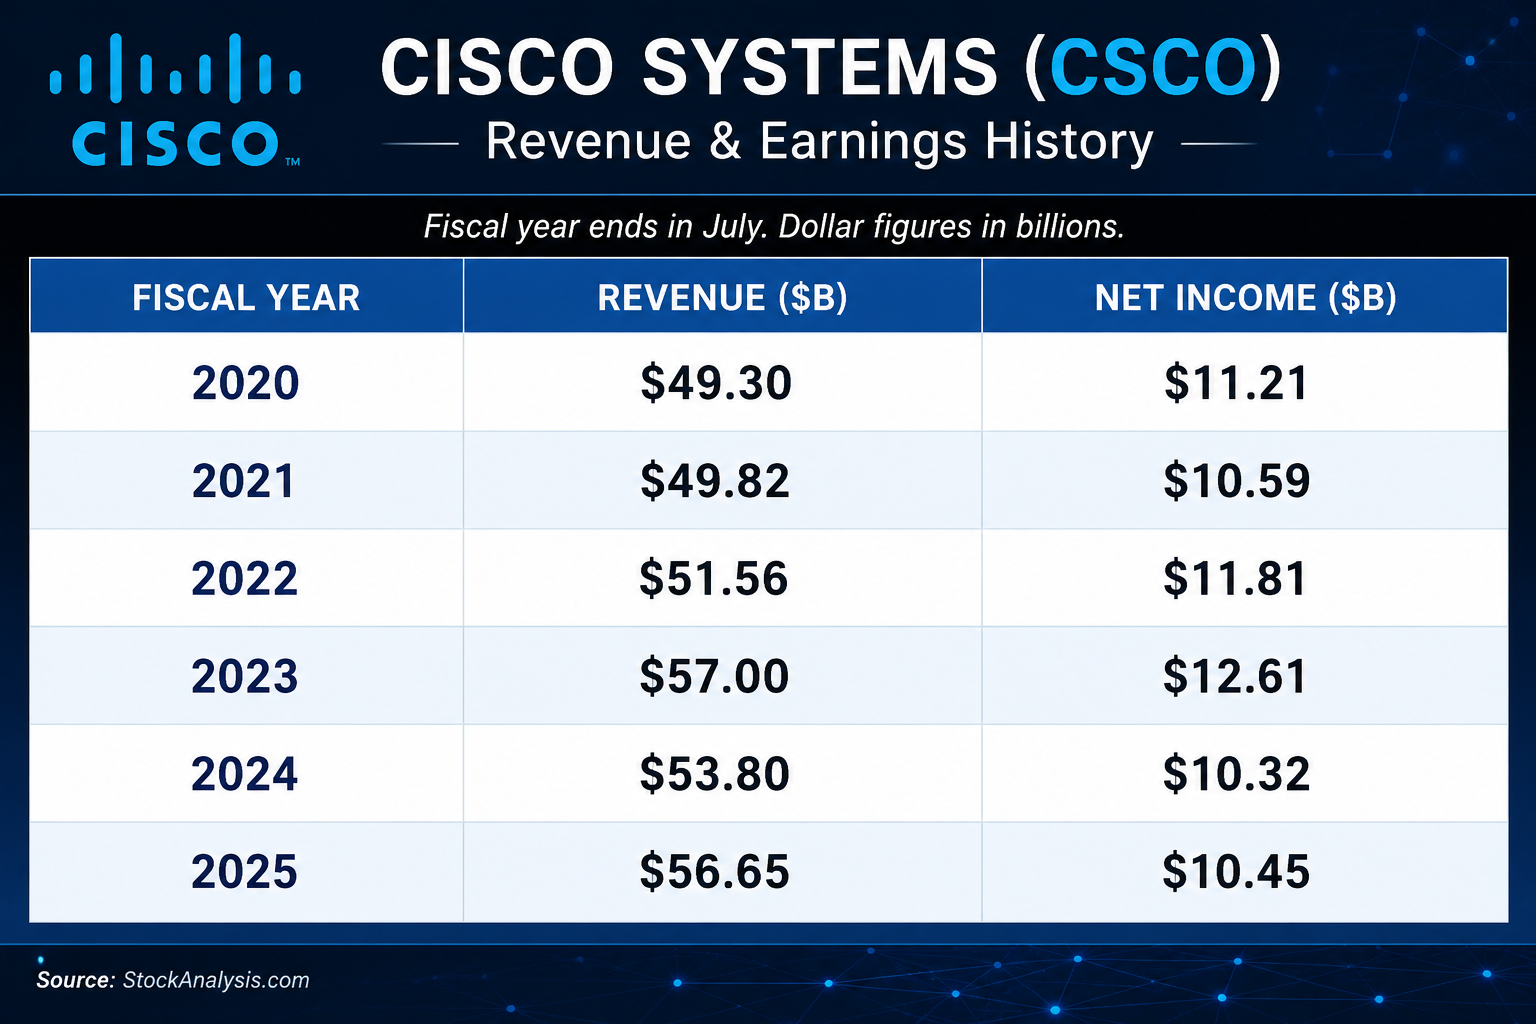
The first thing traders should notice is that Cisco is a company doing more than $56 billion in annual revenue and producing more than $10 billion in net income.
The second thing traders should notice is that the business has been remarkably durable. Revenue has climbed from $49.3 billion in 2020 to $56.65 billion in 2025, while net income has stayed consistently profitable every single year.
That matters because when a profitable old-line tech company suddenly starts acting like a growth stock, traders pay attention.
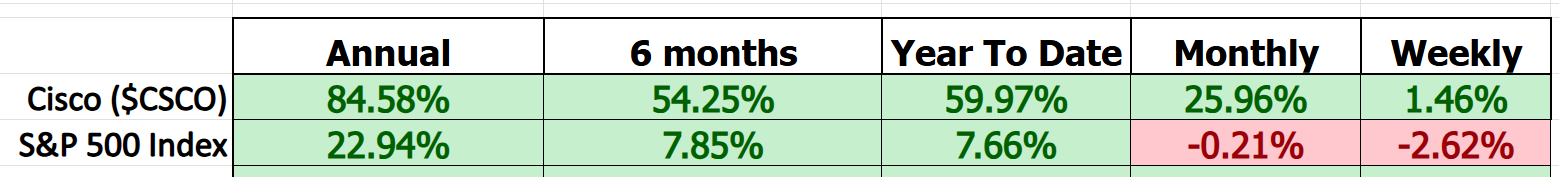
Performance Scoreboard
This is where the story stops being about “Cisco the company” and starts being about Cisco the stock.
Over the last year, $CSCO is up 84.58%, while the S&P 500 is up 22.94%. Year to date, Cisco is up 59.97%, compared to 7.66% for the S&P 500.
That is not mild outperformance. That is domination.
For traders, this is the scoreboard. And the scoreboard says Cisco has been one of the places where money has been treated best.
Best Case Analysis
The best-case chart shows a powerful series of upside moves:
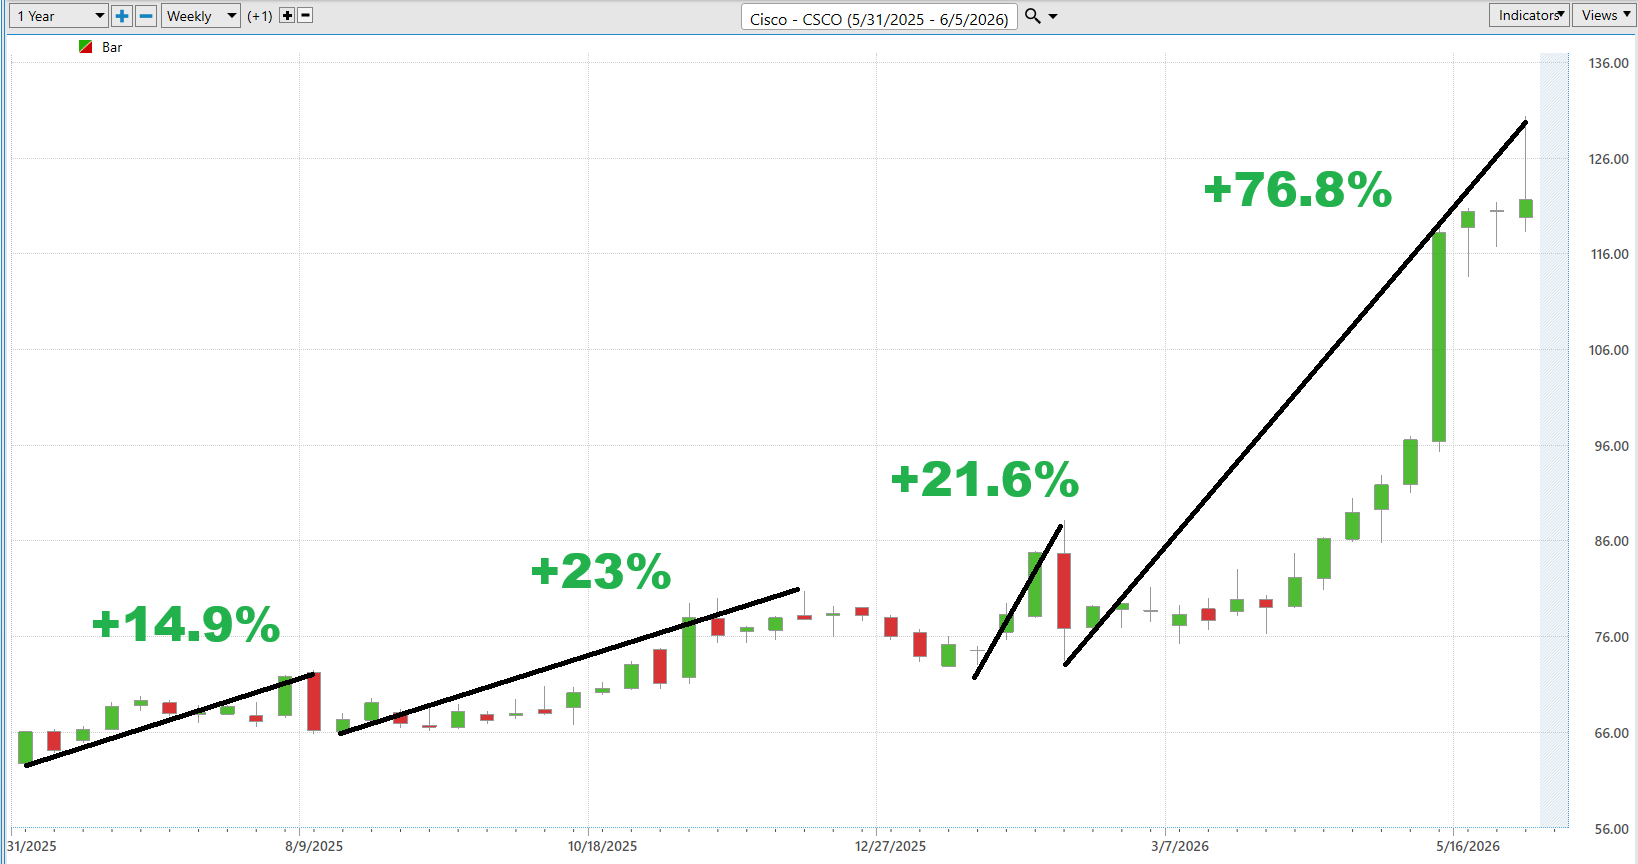
- +14.9%
- +23%
- +21.6%
- +76.8%
The big takeaway is obvious: every meaningful pullback became a launchpad.
Cisco did not just drift higher. It repeatedly paused, reset, and then moved higher again. That is exactly what strong trends often look like.
The most impressive move was the latest advance, where the stock surged roughly 76.8% from its prior base. That is not normal behavior for a mature mega-cap infrastructure name.
That is institutional accumulation.
Worst Case Analysis
The worst-case chart shows the other side of the trade:
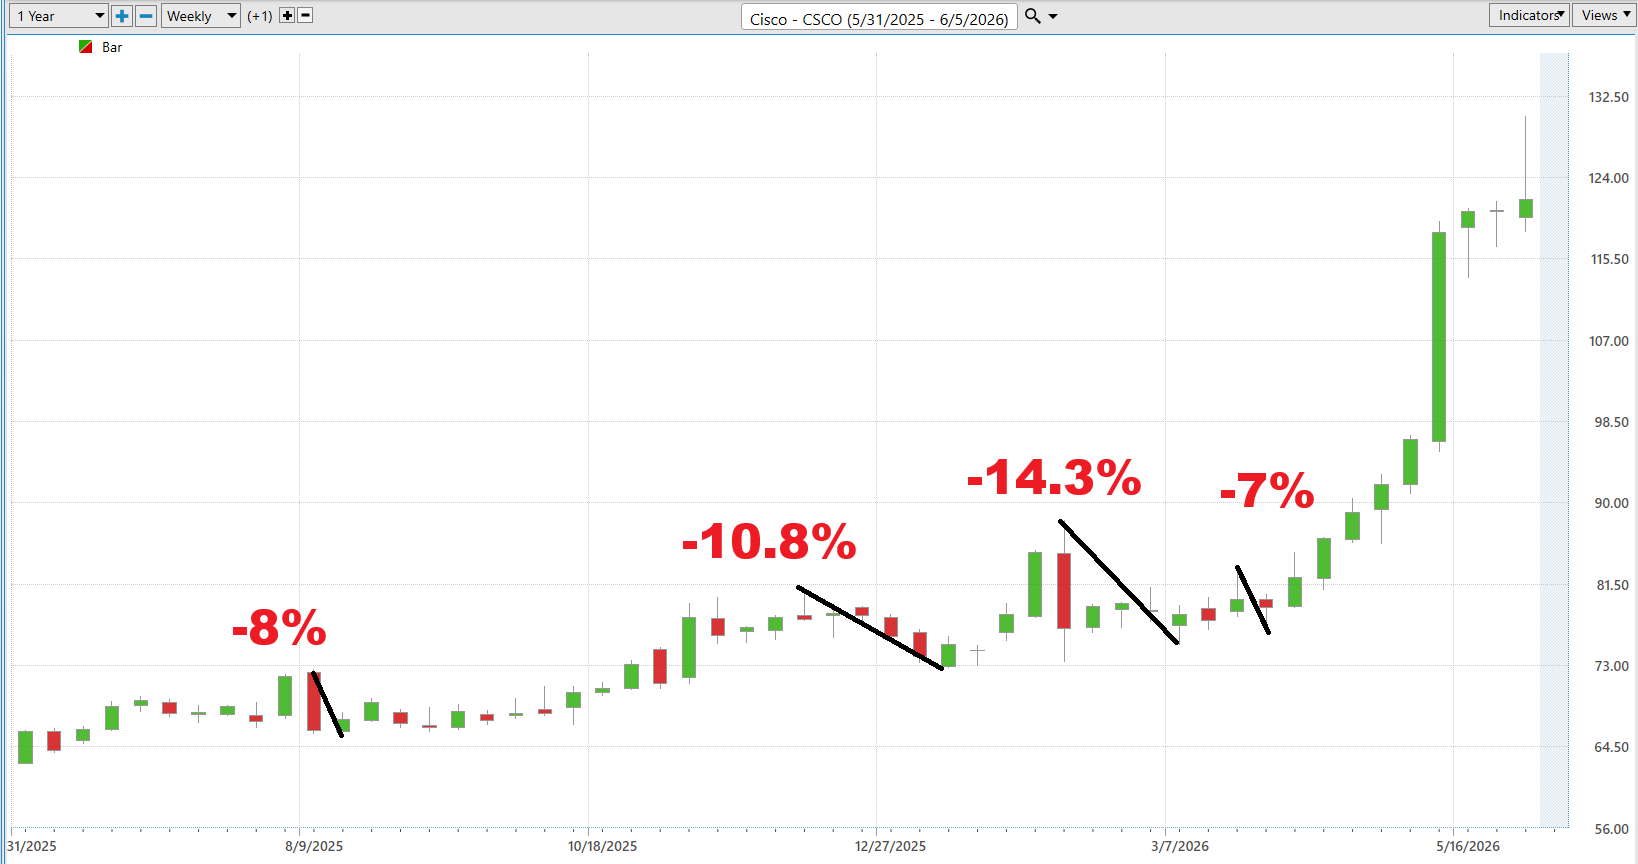
- -8%
- -10.8%
- -14.3%
- -7%
This is important because it tells traders something very useful.
Cisco has had pullbacks, but those pullbacks have been contained. The largest decline shown was roughly -14.3%, and each correction eventually resolved higher.
That does not mean risk has disappeared. It means the buyers have been stepping in aggressively when weakness appears.
In plain English: the bears have had chances, but they have not taken control.
Predictive Blue Line
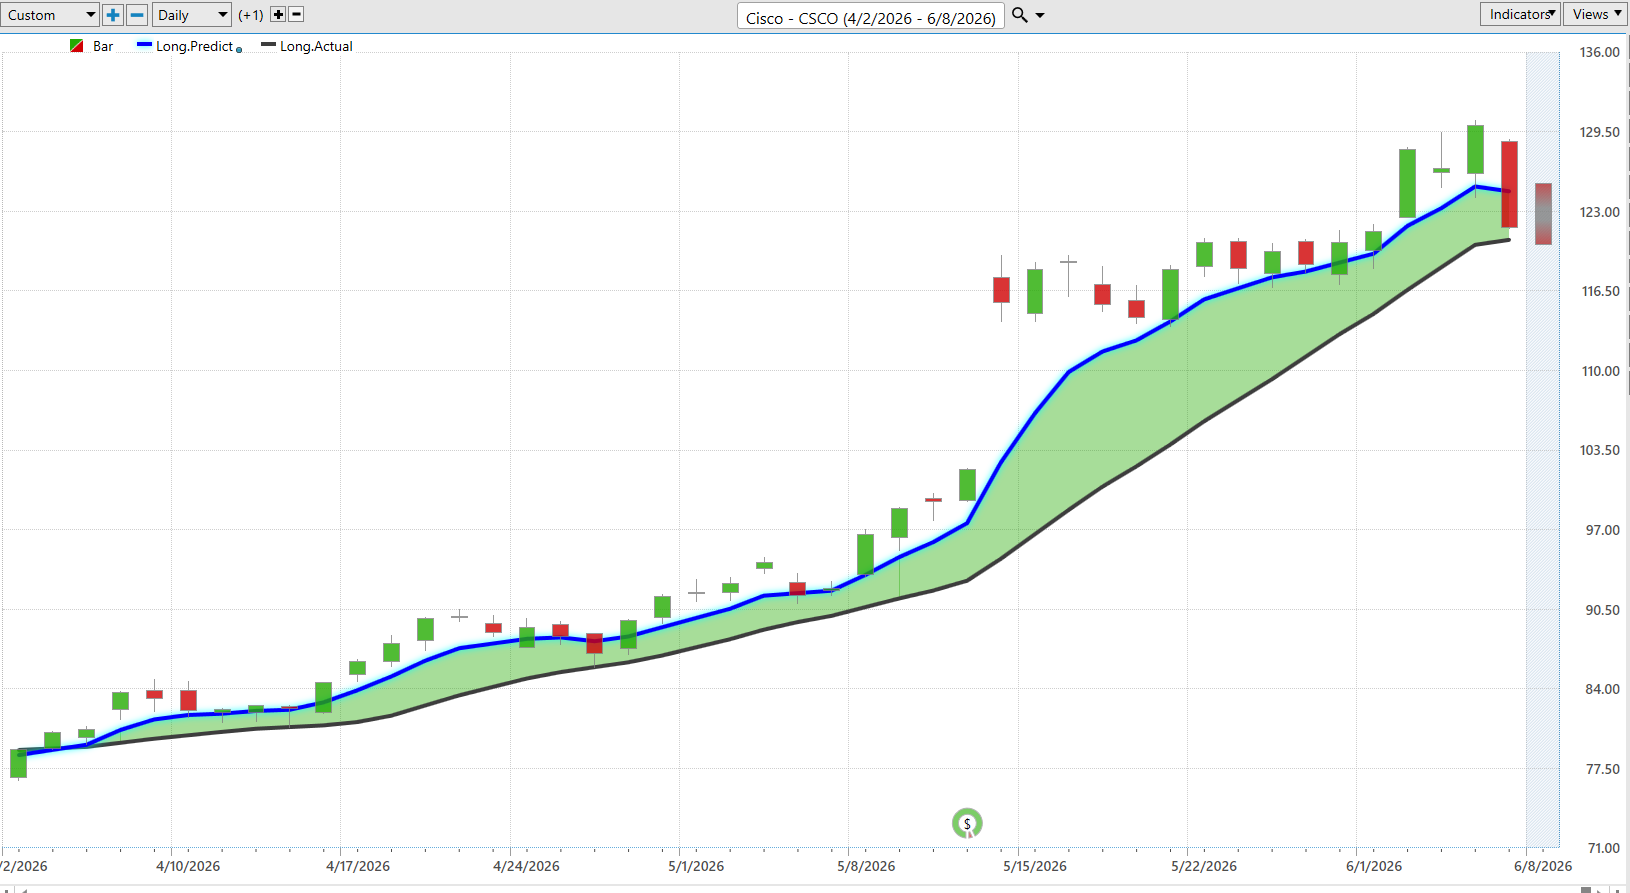
The Predictive Blue Line chart shows a strong and persistent uptrend.
The blue forecast line has remained above the black actual moving average for most of the recent move, and the space between them has stayed supportive. That is usually the kind of structure traders want to see when a stock is trending.
Cisco’s price has been riding above that forecast zone, which tells us momentum has remained favorable.
But there is one thing traders should watch now: the stock has pulled back from its recent high near the $130.32 52-week high, with the last close at $121.64.
That means the trend is still strong, but the stock is now testing whether the recent breakout can hold.
Neural Index
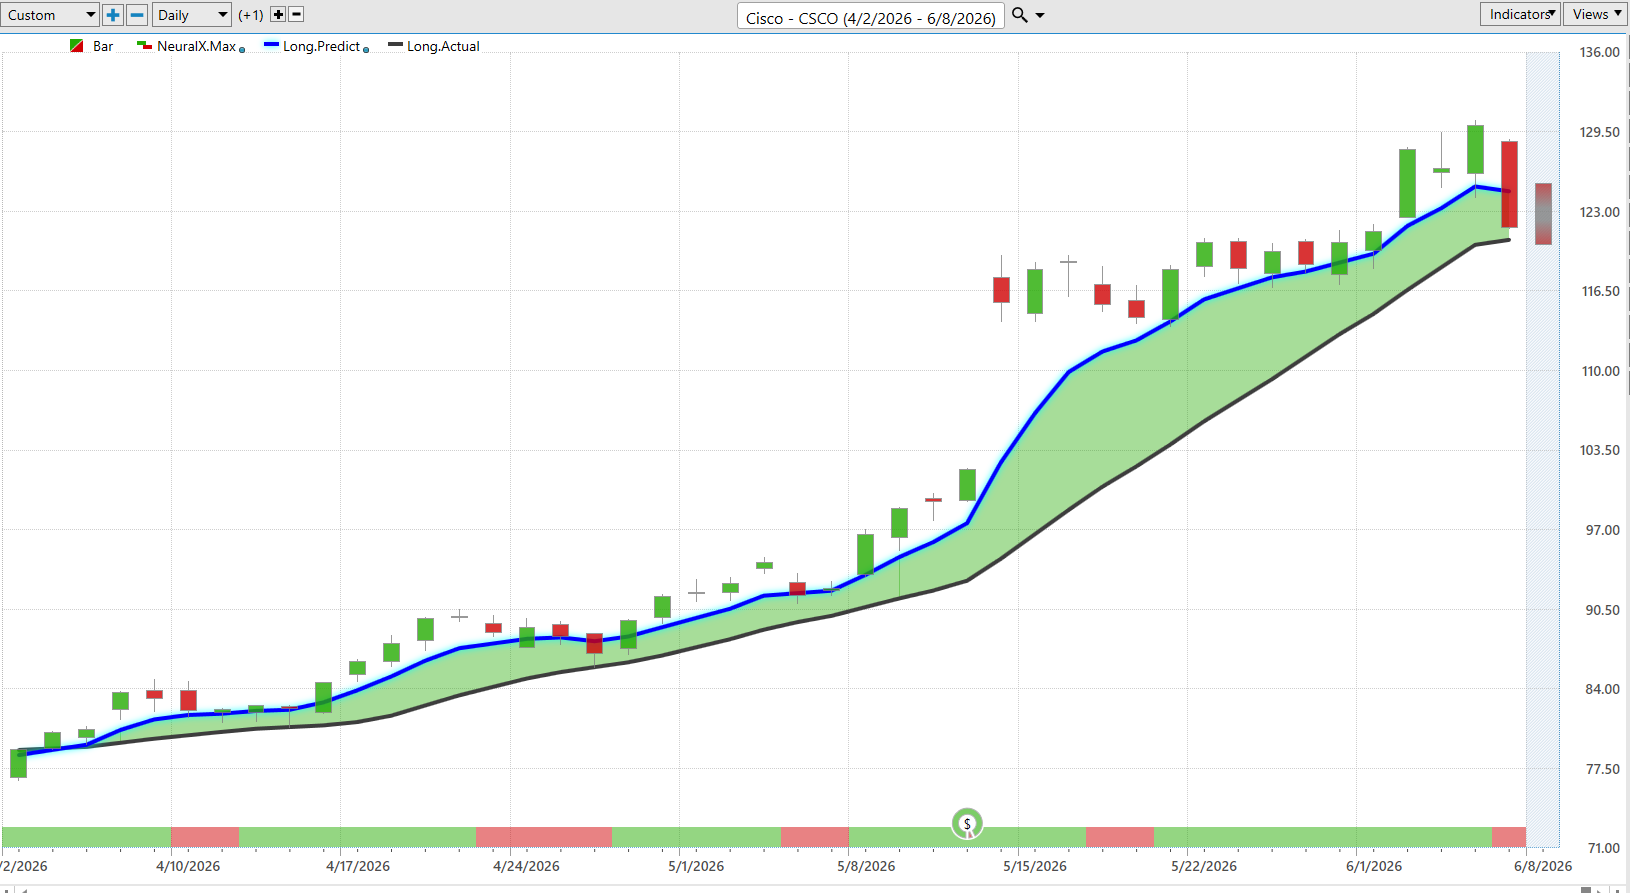
The Neural Index has been mostly green through the recent advance, with only brief red periods.
That is meaningful because the Neural Index is designed to look ahead over the next 48 to 72 hours. When it stays green during an uptrend, it tells traders the short-term forecast remains supportive.
The recent red reading near the far right of the chart deserves attention.
It does not automatically mean the trend is broken. But it does suggest traders should be more alert in the very short term.
The big trend remains constructive. The short-term signal is saying: pay attention.
Daily Range Forecast
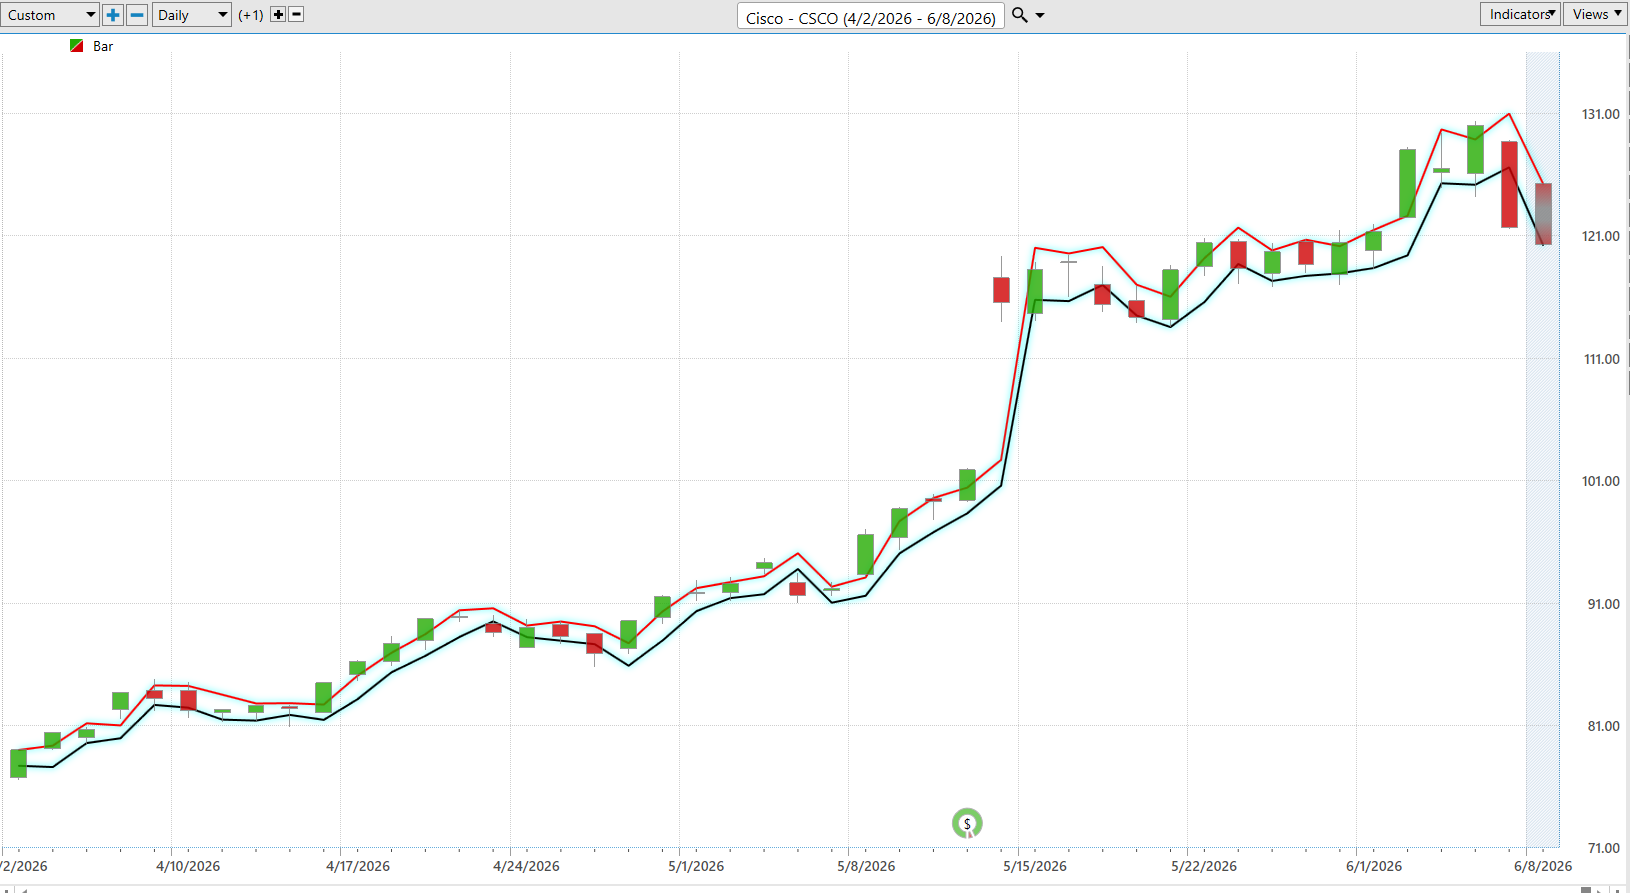
The Daily Range Forecast shows Cisco moving inside a rising structure with a projected near-term range around the low $120s.
This is useful because after a powerful run, traders do not need drama. They need boundaries.
With the last close at $121.64, the key question is whether Cisco stabilizes near the current range or begins to lose momentum below it. The recent high at $130.32 is the upside reference point. The 52-week low at $63.86 shows just how far this stock has traveled. Observe how beautifully the Daily Range Forecast has navigated the recent volatility.
And that is exactly where leaders usually live.
Big Picture Takeaway
Cisco is not trading like a forgotten legacy technology name anymore.
It is trading like a company being rediscovered by investors who suddenly see networking, cybersecurity, AI infrastructure, cloud connectivity, and enterprise spending as part of the same bigger story.
The fundamentals are not explosive, but they are strong enough. The revenue base is massive. The earnings are durable. The stock performance is exceptional.
That combination is what makes $CSCO interesting.
This is a classic case where the market is saying something before the narrative fully catches up.
Trader’s Bottom Line
$CSCO has dramatically outperformed the S&P 500 across every major timeframe shown.
It is near its 52-week high. It has delivered repeated upside moves. Its pullbacks have been relatively controlled. The Predictive Blue Line remains constructive, while the Neural Index is flashing a short-term caution flag.
That means the message is simple:
Cisco is still a leader — but after a major run, traders should respect the range, watch the short-term signals, and let the trend prove itself.
Winners keep winning. But smart traders still manage risk.
Ready to learn more about forecasting stocks and options days before anyone else with up to 87.4% proven accuracy? Attend a FREE LIVE CLASS.
Let’s Be Careful Out There.
It’s not magic.
It’s machine learning.
THERE IS A SUBSTANTIAL RISK OF LOSS ASSOCIATED WITH TRADING. ONLY RISK CAPITAL SHOULD BE USED TO TRADE. TRADING STOCKS, FUTURES, OPTIONS, FOREX, AND ETFs IS NOT SUITABLE FOR EVERYONE.IMPORTANT NOTICE!
DISCLAIMER: STOCKS, FUTURES, OPTIONS, ETFs AND CURRENCY TRADING ALL HAVE LARGE POTENTIAL REWARDS, BUT THEY ALSO HAVE LARGE POTENTIAL RISK. YOU MUST BE AWARE OF THE RISKS AND BE WILLING TO ACCEPT THEM IN ORDER TO INVEST IN THESE MARKETS. DON’T TRADE WITH MONEY YOU CAN’T AFFORD TO LOSE. THIS ARTICLE AND WEBSITE IS NEITHER A SOLICITATION NOR AN OFFER TO BUY/SELL FUTURES, OPTIONS, STOCKS, OR CURRENCIES. NO REPRESENTATION IS BEING MADE THAT ANY ACCOUNT WILL OR IS LIKELY TO ACHIEVE PROFITS OR LOSSES SIMILAR TO THOSE DISCUSSED ON THIS ARTICLE OR WEBSITE. THE PAST PERFORMANCE OF ANY TRADING SYSTEM OR METHODOLOGY IS NOT NECESSARILY INDICATIVE OF FUTURE RESULTS. CFTC RULE 4.41 – HYPOTHETICAL OR SIMULATED PERFORMANCE RESULTS HAVE CERTAIN LIMITATIONS. UNLIKE AN ACTUAL PERFORMANCE RECORD, SIMULATED RESULTS DO NOT REPRESENT ACTUAL TRADING. ALSO, SINCE THE TRADES HAVE NOT BEEN EXECUTED, THE RESULTS MAY HAVE UNDER-OR-OVER COMPENSATED FOR THE IMPACT, IF ANY, OF CERTAIN MARKET FACTORS, SUCH AS LACK OF LIQUIDITY. SIMULATED TRADING PROGRAMS IN GENERAL ARE ALSO SUBJECT TO THE FACT THAT THEY ARE DESIGNED WITH THE BENEFIT OF HINDSIGHT. NO REPRESENTATION IS BEING MADE THAT ANY ACCOUNT WILL OR IS LIKELY TO ACHIEVE PROFIT OR LOSSES SIMILAR TO THOSE SHOWN.