


The stock market isn’t some mystical treasure hunt where you guess which shiny object might glitter tomorrow. It’s more like a stampede of buffalo, all thundering in one direction, and if you don’t pay attention to where they’re running, you’re gonna wind up as flat as an old nickel on railroad tracks. The secret? Watch where they go, not where you wish they’d go.
Big money leaves big footprints. When institutional investors, those multibillion-dollar behemoths, start pouring cash into a particular sector, the ground literally shakes. You can see the tracks in the charts. You can see the dust they kick up. And once a sector starts beating the S&P 500, that’s your clue you’ve just stumbled onto a migration path worth following.
Once you identify which sector is leading the pack, all you have to do is look inside it and find the stocks running the fastest. Those are the real leaders.
Here’s something fundamental: institutional money never moves by accident. It isn’t impulsive. It isn’t emotional. It moves with precision, analysis, and intent. Institutional money is also backed by a ton of quantitative research. And when that massive pool of capital shifts into a sector, the entire market structure changes. That’s why monitoring sector performance isn’t optional, it’s essential.
Let me explain.
There are 11 sectors in the stock market. What this means is that every stock in the market gets categorized and placed into its appropriate category. By monitoring sector performance, which is sometimes about as exciting as watching paint dry, you can quickly see who is winning and who is losing in the current macro-economic environment.
Communication Services
ETF: XLC
This sector includes companies that help people talk, text, stream, and play online. Think of your favorite social media apps, cell phone companies, and TV/streaming networks.
Information Technology (Tech)
ETF: XLK
These are companies that make computers, software, chips, and everything that helps technology run. Basically, the brains and gadgets behind your phone, games, and apps.
Consumer Discretionary
ETF: XLY
These are things people want but don’t necessarily need, like video games, new clothes, cars, toys, and eating out at restaurants. Fun stuff, not survival stuff.
Consumer Staples
ETF: XLP
These companies sell everyday things people need no matter what… like food, drinks, toothpaste, toilet paper, and cleaning products. Stuff your house always has.
Energy
ETF: XLE
This sector includes companies that provide oil, gas, fuel, and energy to power cars, planes, homes, and businesses. Basically, the world’s fuel tank.
Financials
ETF: XLF
This includes banks, credit card companies, insurance companies, and stock exchanges. They help people save money, borrow money, invest money, and protect money.
Health Care
ETF: XLV
These companies make medicine, medical tools, hospitals, and health insurance. They help keep people healthy and treat them when they’re sick.
Industrials
ETF: XLI
This includes companies that build machines, airplanes, construction equipment, and help move goods around through trucking, shipping, and transportation. They help the world build and move things.
Materials
ETF: XLB
These companies dig up or make the raw materials used to build everything — like metal, wood, chemicals, cement, and plastics. Think of them as the “ingredients” factories need.
Real Estate
ETF: XLRE
These companies own buildings, malls, apartments, and offices, and rent space to people or businesses. They’re basically giant landlords.
Utilities
ETF: XLU
This sector includes companies that provide electricity, water, natural gas, and power to homes and cities. The stuff you need to keep the lights on and the water running.
When we monitor sectors, what we’re really doing is observing how entire categories of the economy are responding to current policies, interest rates, consumer behavior, and broader macro trends. While amateur investors hang on every word the financial media broadcasts, professionals focus on the data that actually moves markets.
Sector performance becomes a truth-teller in an industry full of noise, because unlike commentary, performance has no incentive to entertain. And ultimately, it’s that performance — measurable, undeniable, and data-driven — that becomes the foundation on which disciplined traders build their portfolios.
A lot of long-term investors, the cautious kind who still flinch when someone says “dot-com,” keep their eyes glued to sector performance like it’s the weather report before a big fishing trip. They don’t want heroics. They don’t want stock-picking drama. They just want to know which broad slice of the market is getting the sunshine and which one’s about to get hit by a hailstorm. So instead of diving into individual stocks, they stick with sector ETFs — big, sturdy baskets built to ride the trends without losing sleep over earnings surprises or rogue CEOs.
And here’s the twist: these same conservative investors get dragged into the chase when Treasury yields stop behaving. When inflation eats into the safety net and government bonds suddenly look like a wallet left out in the rain, these folks are forced to seek yield someplace else. That “someplace else,” often, is in the sectors showing real momentum.
So, they watch. They wait. And when the Treasury market stops offering shelter, they shift their sails toward the strongest sectors because performance, unlike promises, doesn’t lie. In a world where inflation burns through the old playbook, even the risk-averse find themselves hunting where the returns are living.
Here is a snapshot of recent sector performance.
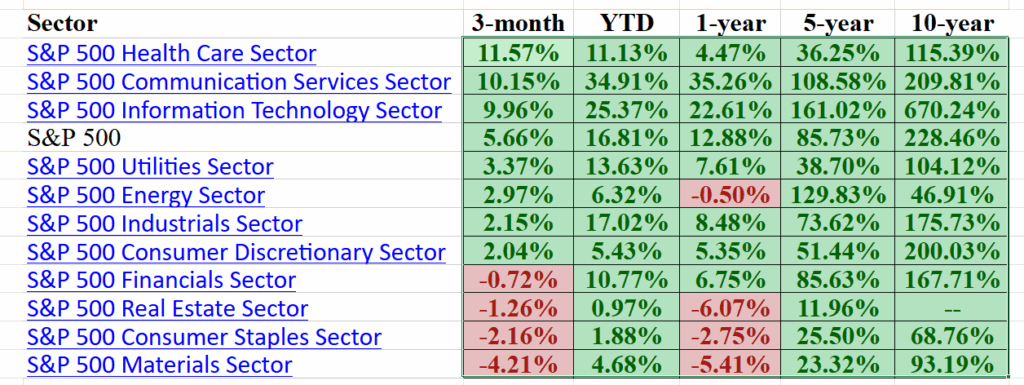
When I study this performance, it answers two questions. Who is winning? Who is losing?
When a sector starts outperforming the broader market, this is not subtle. It is a declaration. A message sent across trading desks from Manhattan to Singapore: “This is where confidence lives.” And confidence from the institutions? That’s the closest thing we have to gravity in the financial universe.
The traders who follow that gravity gain something priceless — direction. Suddenly the chaos fades. The randomness evaporates. The market begins to make sense. Because when you follow the money, you aren’t guessing anymore. You’re observing where the real power is flowing and positioning yourself accordingly.
Every year, roughly 85% of fund managers swing and miss the S&P 500, and that sad little statistic tells you everything you need to know about human nature — most traders can’t stop chasing shiny objects and pretty stories instead of cold, hard performance. That’s why we draw a line in the sand with a benchmark. A benchmark is the scoreboard, the judge, the sorting hat of the market; it tells you what’s strong, what’s weak, and what deserves your attention. Anything below the S&P 500 gets tossed in the “nice try” pile, and anything beating it becomes our playground — the land of real opportunity, where leadership lives and excuses go to die.
Benchmarks are the scoreboards of the financial world, and the S&P 500 is the one everyone watches. When a sector beats this benchmark, whether over 3 months or 6 months or a whole year, that performance becomes a signal — a data point that tells the truth about where the strength is building. And in markets, truth hides in numbers more than narratives.
Think of it like examining a classroom full of test results. If the class average on a math test is 80, and one group of students consistently scores in the 90s, you don’t have to guess who the high performers are. You can see it instantly. Sectors work the same way. The ones that outperform show where the most capable, most confident capital is gathering.
And here’s the part traders often miss: sectors don’t randomly outrun the S&P 500. They do it because investors believe those sectors have the best outlook, best earnings trends, or best long-term themes. When you track benchmark comparisons, you’re not just monitoring performance, you’re watching the market’s expectations in real time.
Now, here’s where the real fun starts. Once you find a strong sector, you pop open its ETF — XLK, XLC, XLI, whichever — and suddenly you’re looking at a leaderboard. This is where the magic of momentum shows up.
What you do next is simple but powerful: you sort the holdings by performance. The ones rising the fastest are your superstars. Why? Because they’re not just beating the market — they’re beating the very ETF they belong to. That’s like being the fastest sprinter on the fastest relay team. That’s what leadership looks like.
Throughout 2025 there have been 4 sectors which have consistently outperformed the S&P 500 Index. Those sectors have been:
- Information Technology
- Health Care
- Communication Services
- Industrials
There have been minor rotations throughout the year, but those 4 sectors have consistently outperformed the S&P 500 Index.
Great traders have a superpower: they know what to ignore. And in a world filled with thousands of stocks begging for attention, the ability to eliminate the weak ones is worth its weight in platinum. If a stock can’t even outperform its own sector ETF, it likely doesn’t deserve your money, your time, or your curiosity.
You see, every sector has its leaders and its laggards. The leaders pull the sector up; the laggards drag it down. And while the laggards may look “cheap” or “due for a bounce,” they rarely reward traders who bet on them. Winners win because they have support — volume, trend, momentum, narrative, and institutional demand.
By eliminating the underperformers early, traders can instantly narrow their focus to a handful of elite stocks — the strongest horses in the strongest race. This is the essence of clarity, and clarity creates confidence.
Leaders make higher highs. They shrug off selloffs. They get bought on dips. Their volume spikes because institutions are stuffing them into their portfolios like survivalists hoarding canned beans. These aren’t “maybe someday” stocks — they’re “get-out-of-my-way” stocks.
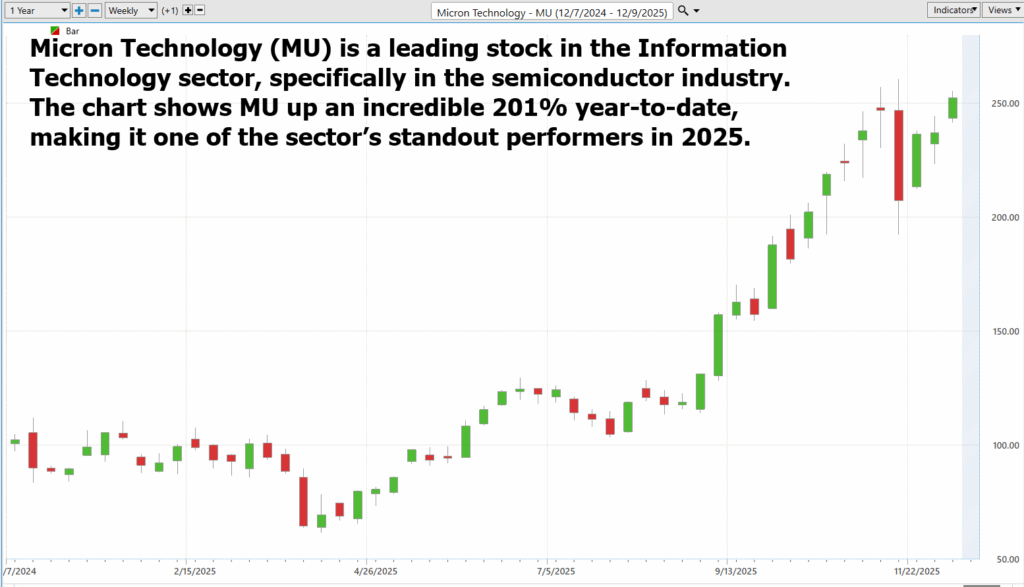
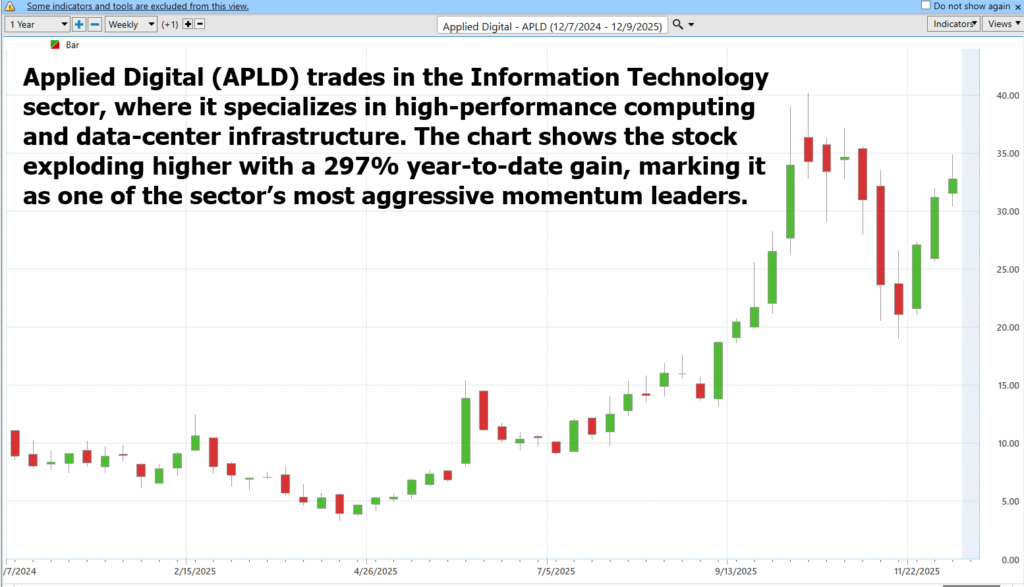
Following this perspective, our objective is isolate sector strength and then become extremely AWARE of who the leaders are in the strongest performing sectors. The following charts are all 52-week charts of top performing candidates in their sectors.
Here’s the gut punch: the S&P 500 is up about 17% year to date, and even the hotshot Information Technology sector is only up around 26%. Meanwhile, these stocks didn’t just beat those numbers — they torched them. They blew past the S&P 500 and steamrolled the XLK Tech Sector ETF like it was standing still.

Let’s make this simple and actionable, the way traders need it. You just need the performance chart. The winners stand out immediately.
Next, open the sector ETF and sort the holdings by performance. The top names will rise to the top like bubbles in a bottle of soda. These are stocks with the strongest momentum inside the strongest sector — a powerful combination that often signals sustainable upside.
Finally, eliminate every stock that fails to outperform the ETF itself. What remains is a tight, focused list of potential leaders. This process doesn’t just simplify trading — it brings order to chaos. Instead of drowning in data, you’re working with precision. Instead of guessing, you’re identifying leadership.
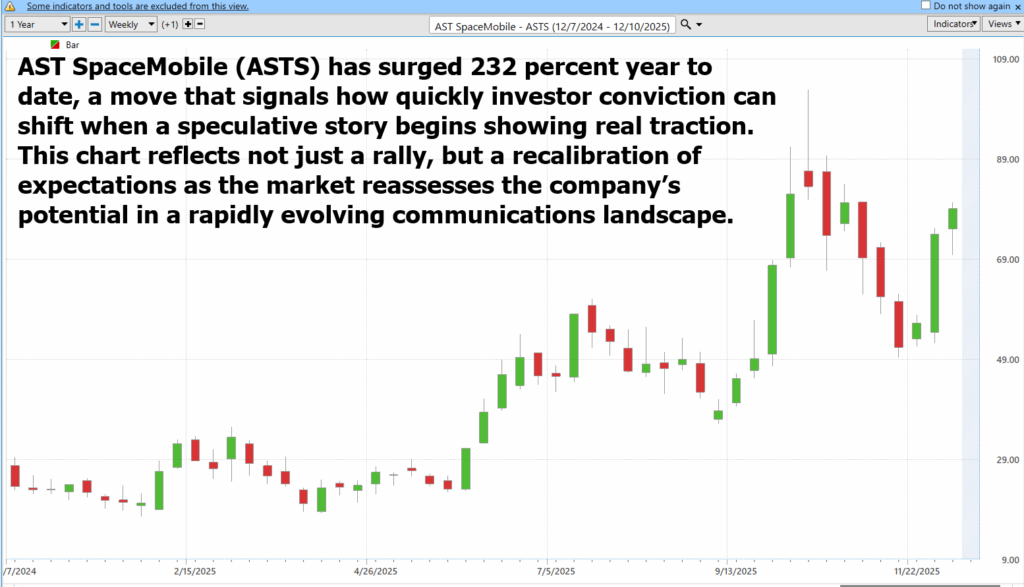
In the Communication Services Sector, same story. Year-to-Date this sector is up almost 33%. When we drill down and look under the hood the standouts have been obvious most of the year.


Let’s be honest: most people wander into the stock market like tourists walking into Times Square, gawking at every flashing light and wondering which one might be a “signal.” That’s how wallets get emptied and dreams get flattened. The smarter approach is to look where the pros are already marching and march with them.
When you follow sector leadership, you’re following the footprints of the institutional elephants. And elephants don’t tiptoe. They stomp in the direction they believe is safest, strongest, and most profitable. Your job is simply not to stand under their feet.
So, here’s the bottom line: tracking sectors with VantagePoint → comparing them to the S&P 500 → drilling down to the leading stocks → and tossing out the underperformers is not just a strategy. It’s a survival plan wrapped in common sense.
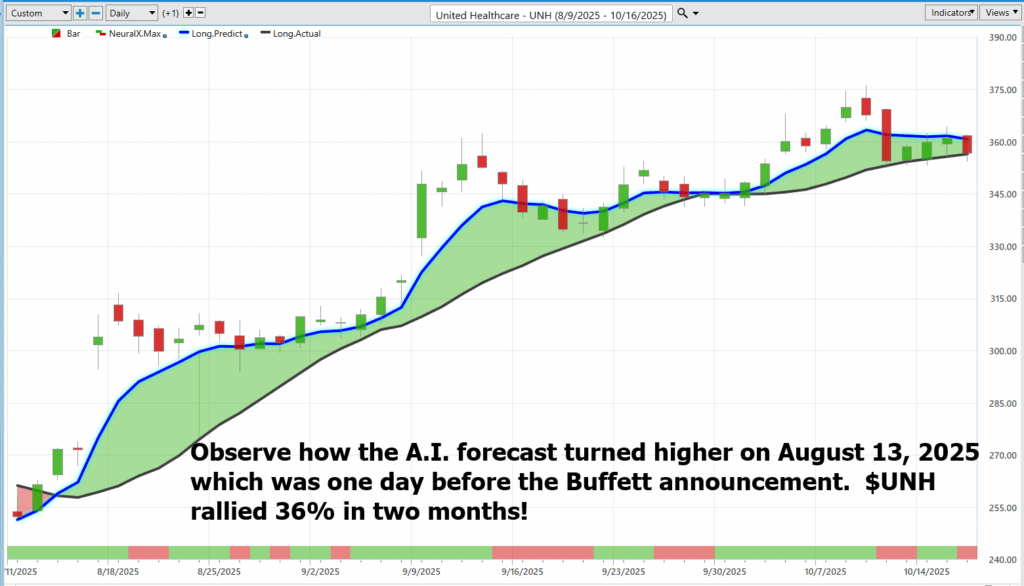
When the Health Care sector spent most of the year lagging the S&P 500, nobody cared — until Warren Buffett dropped the bomb on August 14th, 2025, announcing a $1.6 billion stake in UNH, and suddenly the entire market snapped its head around like someone yelled “free money.” That moment was the signal flare: institutional money wasn’t just sniffing around this sector, it was loading the trucks. We covered this in our August 21st stock study, pointing out that from that point forward the A.I. locked onto Health Care like a hawk on a field mouse, tagging supertrend after supertrend while the headline performance still looked negligible to anyone half-asleep. But from those August lows — the moment Buffett planted his flag — the undercurrent shifted, and the smart money started treating Health Care not as a laggard, but as a coiled spring ready to fire.
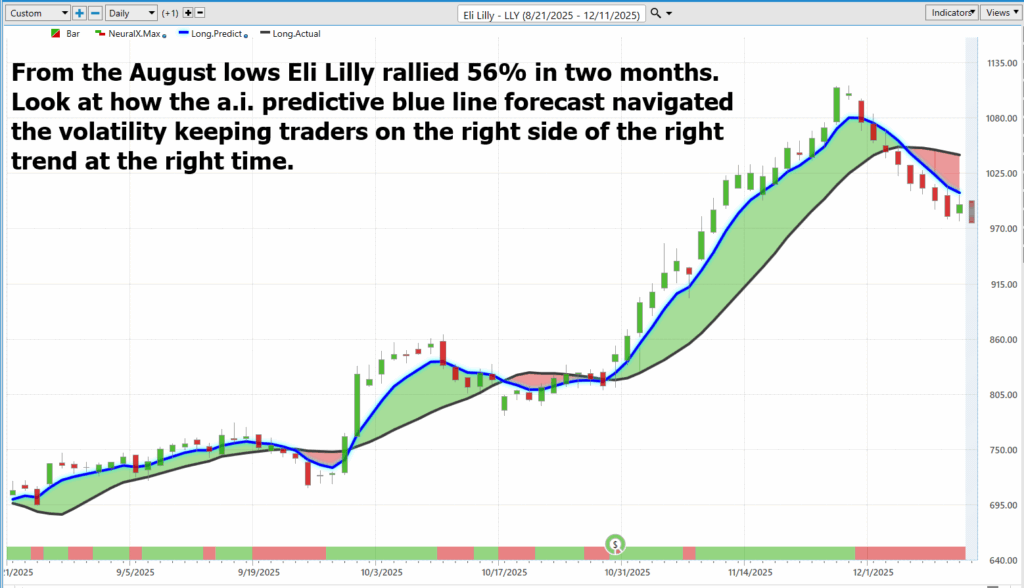
Eli Lilly didn’t just rally 56 percent from the August lows — it took off like a pharmaceutical bottle rocket, leaving anyone who blinked staring at a contrail of missed opportunity. And while the market wobbled around like a caffeinated toddler, the AI’s predictive blue line did its best impression of a designated driver, steering traders through every pothole of volatility and gently reminding them that staying on the right side of the right trend isn’t rocket science, it’s just good navigation. In a year full of chaos, confusion, and headlines that aged faster than milk, this chart shows the one thing that still works: follow the trend, trust the math, and let the machines keep you pointed in the direction your account balance prefers — up.
The Industrials sector spent long stretches of the year lagging the S&P 500, struggling to keep pace with the market’s dominant performers. But when the sector finally broke into outperformance mode, leaders like CAT, GEV, and RTX carried the charge. Even so, the Industrials sector ETF, XLI, is up a respectable 17 percent year to date.
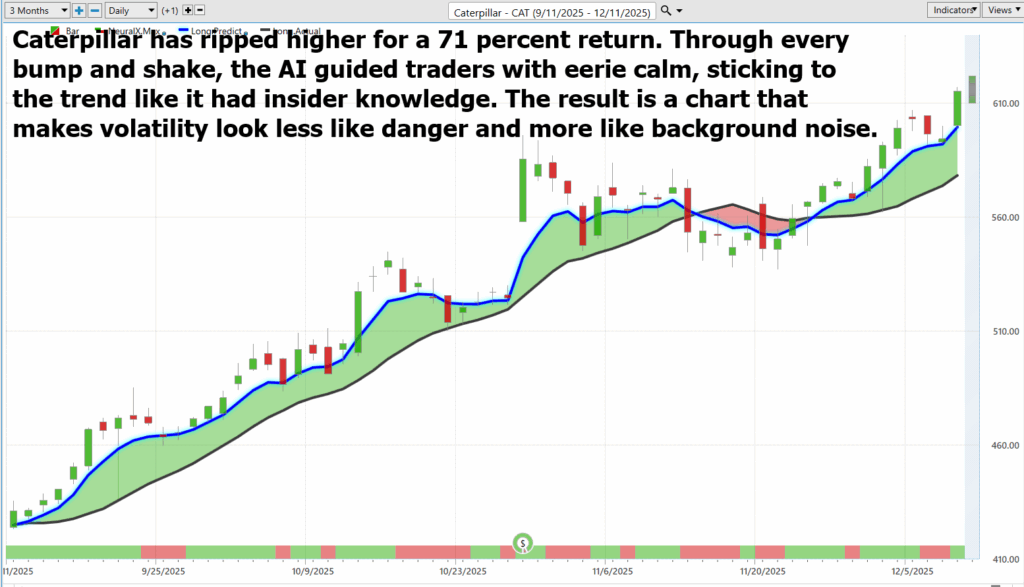
Caterpillar has spent the last few months behaving like a caffeinated construction worker on a mission, tearing higher and racking up a 71 percent return while the rest of the market debated whether gravity still applies. Through every hiccup, wobble, and nervous-market fainting spell, the A.I. calmly steered traders through the mess like a GPS that never yells “recalculating.” And as this chart shows, when the machines keep their cool and the trend keeps marching, even the volatility starts looking like part of the entertainment.

At its core, the data shows a simple truth: traders who track sector leadership aren’t guessing — they’re aligning themselves with the same institutional forces that drive the market’s most meaningful moves. Outperformance, in this context, isn’t a matter of luck but the predictable outcome of disciplined observation and a willingness to filter out everything that doesn’t meet the standard. And in a market saturated with noise and distraction, it’s the traders who follow the true leaders who ultimately become leaders themselves.
In the end, the market rewards those who pay attention to the right things. Not the rumors. Not the headlines. Not the noise that fills the financial airwaves 24 hours a day. It rewards those who can separate strength from weakness, leaders from followers, and substance from distraction. And that is precisely why traders who track sector leadership consistently enjoy an edge — they’re aligning their decisions with the same institutional forces that shape the market’s biggest winners.
But here’s the deeper truth: even the sharpest human mind can only track so much. The market moves at machine speed, money rotates in and out of sectors without warning, and leadership can shift in hours—not weeks. Great traders understand this, and that’s why they rely on tools that amplify their awareness.
VantagePoint A.I. trading software doesn’t get tired, emotional, or distracted. It scans every sector, every stock, and every shift in leadership with relentless precision, keeping you focused on what truly matters: who is winning right now and where they are headed next.
Imagine the confidence that comes from having this level of clarity. No more guessing. No more chasing shiny stories or reacting late to moves that were obvious to the institutions days earlier. With VantagePoint guiding your attention, you stop drowning in information and start navigating with purpose.
If you’re ready to experience this for yourself, I invite you to join our Free Live Online Masterclass. You’ll see the A.I. in action — tracking trends, identifying leaders, and revealing opportunities that most traders overlook until it’s too late. This is your chance to step into the world of focused, advantage-driven trading, where clarity replaces confusion and confidence replaces hesitation.
Attend the Masterclass, and let VantagePoint show you how to stay on the right side of the right trend at the right time.
It’s not magic.
It’s machine learning.
THERE IS A SUBSTANTIAL RISK OF LOSS ASSOCIATED WITH TRADING. ONLY RISK CAPITAL SHOULD BE USED TO TRADE. TRADING STOCKS, FUTURES, OPTIONS, FOREX, AND ETFs IS NOT SUITABLE FOR EVERYONE.IMPORTANT NOTICE!
DISCLAIMER: STOCKS, FUTURES, OPTIONS, ETFs AND CURRENCY TRADING ALL HAVE LARGE POTENTIAL REWARDS, BUT THEY ALSO HAVE LARGE POTENTIAL RISK. YOU MUST BE AWARE OF THE RISKS AND BE WILLING TO ACCEPT THEM IN ORDER TO INVEST IN THESE MARKETS. DON’T TRADE WITH MONEY YOU CAN’T AFFORD TO LOSE. THIS ARTICLE AND WEBSITE IS NEITHER A SOLICITATION NOR AN OFFER TO BUY/SELL FUTURES, OPTIONS, STOCKS, OR CURRENCIES. NO REPRESENTATION IS BEING MADE THAT ANY ACCOUNT WILL OR IS LIKELY TO ACHIEVE PROFITS OR LOSSES SIMILAR TO THOSE DISCUSSED ON THIS ARTICLE OR WEBSITE. THE PAST PERFORMANCE OF ANY TRADING SYSTEM OR METHODOLOGY IS NOT NECESSARILY INDICATIVE OF FUTURE RESULTS. CFTC RULE 4.41 – HYPOTHETICAL OR SIMULATED PERFORMANCE RESULTS HAVE CERTAIN LIMITATIONS. UNLIKE AN ACTUAL PERFORMANCE RECORD, SIMULATED RESULTS DO NOT REPRESENT ACTUAL TRADING. ALSO, SINCE THE TRADES HAVE NOT BEEN EXECUTED, THE RESULTS MAY HAVE UNDER-OR-OVER COMPENSATED FOR THE IMPACT, IF ANY, OF CERTAIN MARKET FACTORS, SUCH AS LACK OF LIQUIDITY. SIMULATED TRADING PROGRAMS IN GENERAL ARE ALSO SUBJECT TO THE FACT THAT THEY ARE DESIGNED WITH THE BENEFIT OF HINDSIGHT. NO REPRESENTATION IS BEING MADE THAT ANY ACCOUNT WILL OR IS LIKELY TO ACHIEVE PROFIT OR LOSSES SIMILAR TO THOSE SHOWN.


