


This week’s ai stock spotlight is Arrowhead Pharmaceuticals ($ARWR)
$ARWR is a biotech company working in RNA interference (RNAi), developing gene-silencing therapies for “undruggable” targets. They are headquartered in Pasadena, California, employs a staff of 376 workers, and is led by CEO Christopher Anzalone. The company originally was Arrowhead Research and rebranded to reflect its pharmaceutical ambitions. ARWR’s mission: to use RNA interference (RNAi) and its proprietary TRiM™ platform to silence genes tied to disease, even in places (like the brain) where delivery is historically difficult.
In practice, the business model is: discover or engineer a gene target (or disease pathway), develop an RNAi / gene-silencing therapeutic, partner or license to large pharma for late-stage trials and commercialization, and collect milestone payments and royalties. It’s not selling pills today; it’s selling potential. That means your faith is as important as the science. The company also sometimes takes programs through early clinical stages itself to increase value before handing off.
Competition is brutal. You’ve got Ionis (which works in oligonucleotide therapies), Alnylam, and a host of smaller RNA/oligo biotech plays. These are companies racing to see who can safely and effectively silence genes, deliver across the blood–brain barrier, avoid immune reactions, and win over regulators. Any of them could beat Arrowhead or be beaten by Arrowhead depending on trial results or IP moves.
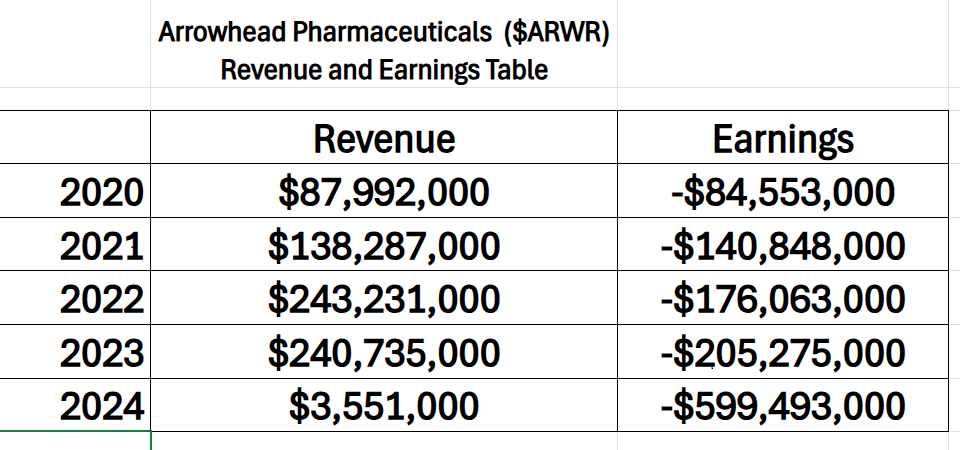
It’s still unprofitable and burning cash, but recent licensing deals (Sarepta, Novartis) provide lifelines and validation. Over the last 5 years they have burned through $1.3 billion in losses. But because this is biotech, cash is king. License deals inject cash and extend runway; clinical wins or FDA nods reduce risk. But a failed trial or delay can wipe your upside. As of now, the finances are precarious but not collapsing — with enough faith in the pipeline and recent deals to keep the story alive.
Here’s what could light a fire under Arrowhead ($ARWR): First, they just cut a fat deal with Novartis — $200 million upfront with the chance at $2 billion more if things go right. That’s like getting a signing bonus the size of a small country just to prove you’re legit. Then there’s the older Sarepta deal — more gene-silencing work, more validation, more cash. If their drug plozasiran gets the FDA thumbs-up, that’s huge — it’s like passing the final boss level in biotech.
On top of that, every time their partners hit milestones, Arrowhead pockets more money. They’re even fighting Ionis in court over patents, win that and they lock in more turf. And if they can pull off delivering RNA drugs straight into the brain, well, that’s the kind of breakthrough that makes headlines and stock charts explode. In short: this stock has real shots at jackpots, but you better believe the swings will be big.
Arrowhead’s world isn’t exactly a calm stroll in the park — it’s more like crossing a swamp full of alligators while wearing bacon-scented flip-flops. One clinical trial goes wrong, and boom — the stock sinks like a rock tossed in a swimming pool. Even when the science looks solid, the FDA — the school principal of medicine — can still hold things up, and nothing freaks investors out faster than a delay.
Money? Yeah, they burn through it. If they can’t snag more deals, they’ll sell more stock, and that dilutes what current holders own. Meanwhile, they’re in a lawsuit cage match with Ionis, and if they lose, their upside shrinks fast. Add in hungry competitors and a market that runs on mood swings, and you’ve got a stock that can rocket one month and nosedive the next. It’s dangerous, but that’s the thrill ride traders signed up for.
If you’re a trader, $ARWR is the kind of name that either makes you look like a genius or leaves you wondering whether biotech is cursed. This is classic high-risk / high-reward territory. The story elements are there: core technology (RNAi / TRiM™), partnerships with heavy hitters (Novartis, Sarepta), pipeline depth, legal drama, and a desperate need to monetize before the cash runs dry.
Don’t mistake ARWR for a safe dividend or steady growth, it’s a speculative swing asset. But if you believe in the platform, the partnerships, and you have the stomach for volatility and biotech drama, this is a name to watch closely around catalysts (trial results, license deals, legal rulings). Position tight, size modestly, and be ready to act quickly — because in biotech, narratives change overnight.
In short: $ARWR isn’t for the faint of heart, but for traders who live on adrenaline and don’t fear drawdowns, it offers real upside asymmetry. Let the science and news lead the way — backed by strict risk controls — and you might find yourself rewarded when the next big readout or deal drops.
In this stock study, we’ll analyze the key indicators and metrics that guide our decisions on whether to buy, sell, or stand aside on a particular stock. These inputs serve as both our framework and behavioral compass, rooted in data and powered by predictive intelligence.
- Wall Street Analysts Ratings and Forecasts
- 52-Week High and Low Boundaries
- Best Case/Worst-Case Analysis
- VantagePoint A.I. Predictive Blue Line
- Neural Network Forecast (Machine Learning)
- VantagePoint A.I. Daily Range Forecast
- Intermarket Analysis
- Our Suggestion
While our decisions are ultimately anchored in artificial intelligence forecasts, we briefly review the company’s fundamentals to better understand the financial environment it operates in. For $ARWR this context helps us assess the quality of the A.I. signal within a broader economic and industry backdrop.
Wall Street Analysts Forecasts
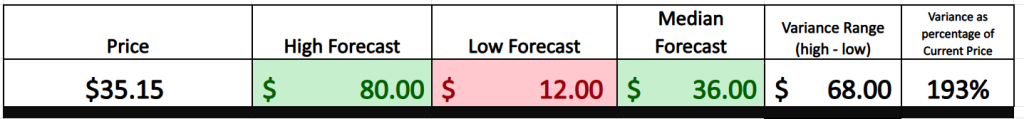
Wall Street’s got 11 analysts throwing darts at Arrowhead, and the “average” target is $36. Big whoop. The real story isn’t the middle number — it’s the gap between the bulls and the bears. One camp says this thing can run to $80, the other swears it’s worth only $12. That’s a $68 spread on a $34 stock. Let that sink in. These aren’t bored Reddit posters guessing in between Monster Energy chugs — these are professionals who live and breathe this company, comb through every line of every filing, and still come out with forecasts that look like they’re describing two completely different planets.
That variance is the proof in the pudding. It tells you volatility isn’t just possible — it’s already baked into the batter. When experts who watch this stock like hawks can’t even agree on whether it’s going to triple or get cut in half, you know you’re sitting on a live wire. Forget the average — that’s just math trying to make chaos look polite. The only number that matters to a trader is the spread, and Arrowhead’s spread screams: expect big swings.
52 Week High and Low Boundaries
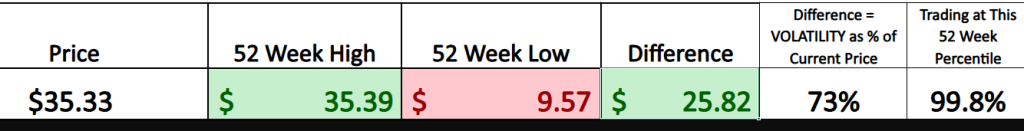
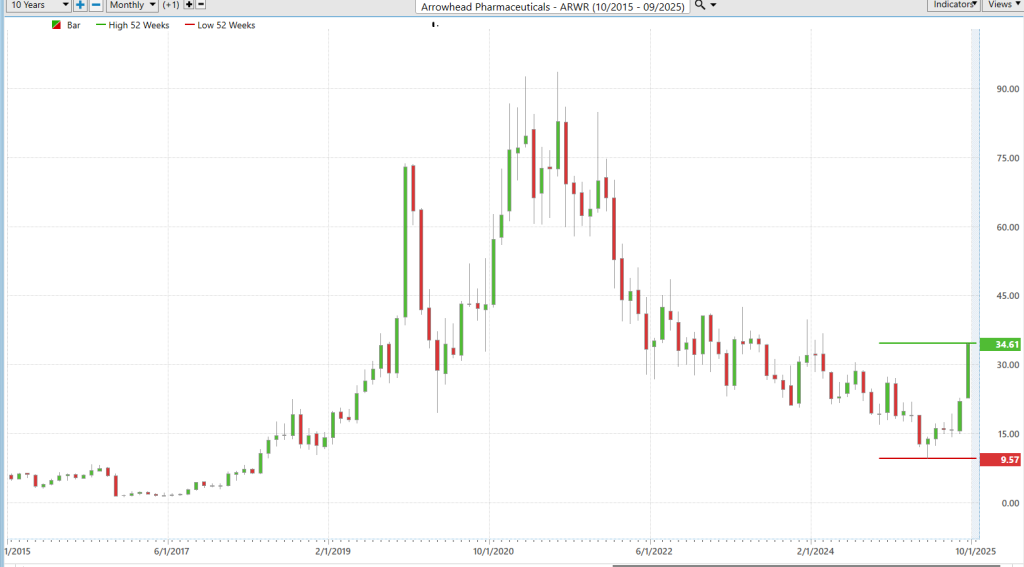
Traders love the 52-week high and low because it’s the stock market’s way of saying: here’s the line between winners and losers. The low is where despair lives, where bagholders grumble and accountants cry. The high, on the other hand, is where champagne corks pop, bonus checks get fatter, and everybody pretends they saw it coming all along. It’s not complicated — if a stock is hugging its high, it’s telling you investors want in. If it’s dragging along near the low, it’s the equivalent of being picked last in gym class.
Look at these charts of Arrowhead Pharmaceuticals ($ARWR). The stock’s been to the bottom — $9.57, where hope was on life support — and it’s now clawed its way back to $35.33, brushing right up against the 52-week high of $35.39. That’s a difference of nearly 73% volatility baked into the current price. And where’s it trading? Practically on the ceiling. At the 99.8th percentile, this thing isn’t just knocking on the door, it’s kicking it down.
And that’s the whole point: traders chase strength, not pity parties. Stocks that keep punching through 52-week highs are the ones that get the momentum crowd piling in, the hedge funds sniffing around, and the day-traders dancing on their chairs. ARWR’s message right now is simple — strong stocks keep getting stronger. And those are the stocks every trader wants in their portfolio.
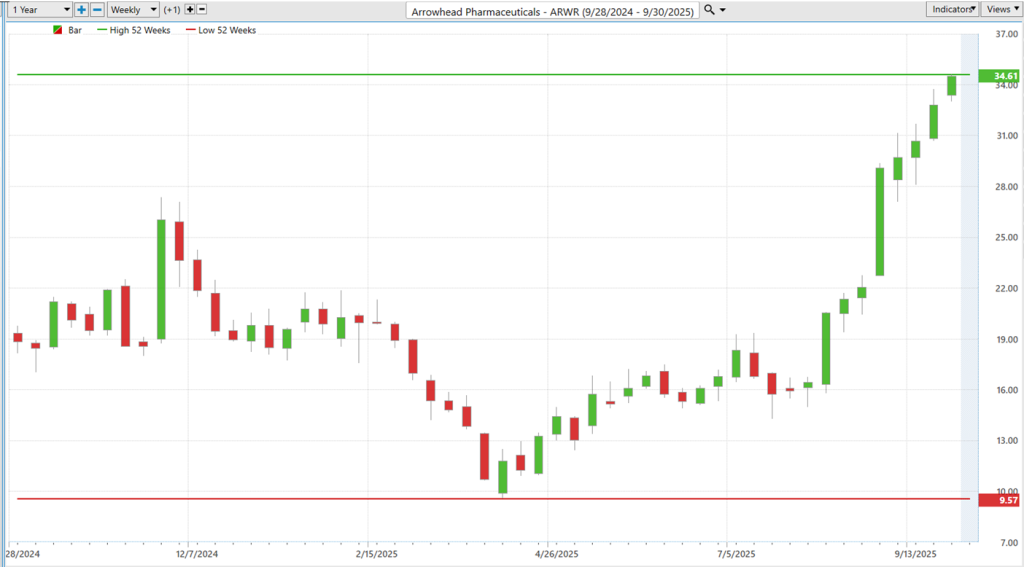
Take a good look at the 10-year chart of $ARWR — it doesn’t look like a stock, it looks like a biotech electrocardiogram. Spikes, crashes, flatlines, and sudden jolts of life… the whole medical drama right there in green and red candles. That’s why you’ve got to zoom out. Only then do you see the bigger story: Arrowhead has always been volatile, but over the long haul the trajectory bends upward. Traders chasing short-term thrills see the heart attacks; investors who study the 10-year chart see the pulse of a company fighting its way forward.
Best-Case/Worst-Case Scenario Analysis
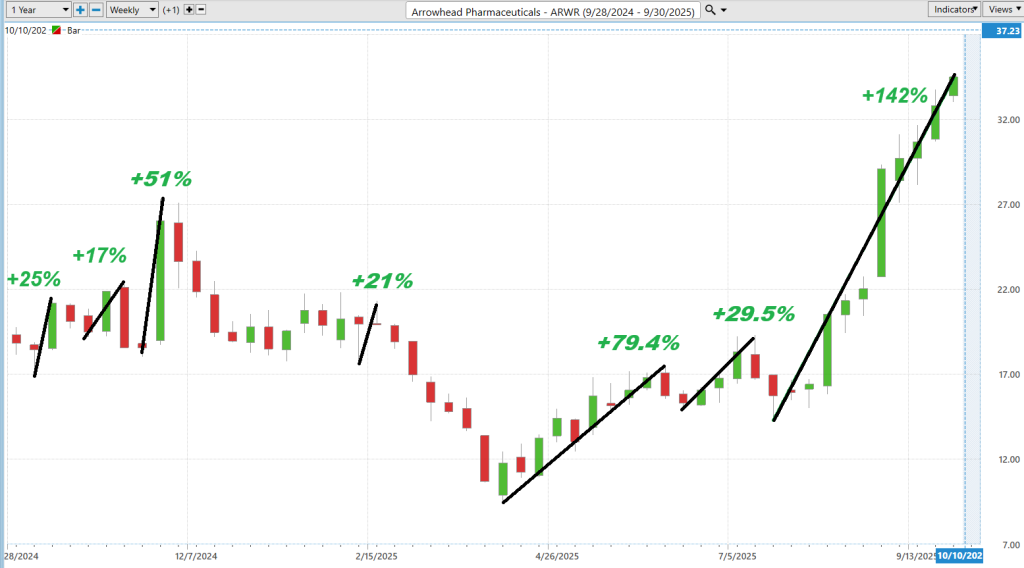
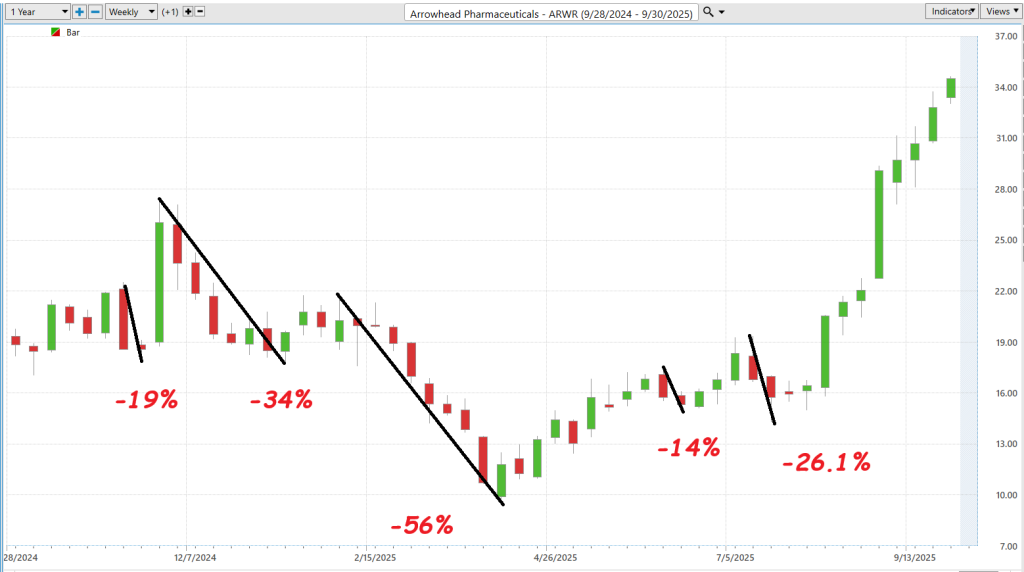
When you look at these next two charts of Arrowhead Pharmaceuticals, what you see is the essence of volatility laid bare. In the past year, ARWR has been capable of breathtaking rallies — up more than 142% in a single stretch — while also suffering punishing declines, with one selloff wiping out 56% of its value. These are not abstract numbers on a spreadsheet; they are the lived reality of trading biotech, where the swings are as dramatic as the science behind the drugs.
The most practical way to make volatility real is to measure both the magnitude of the rallies and the depth of the declines. That exercise strips away hype and exposes the truth: this is a stock that can double investors’ money in months but can also cut it in half just as quickly. For traders, that range is both the risk and the opportunity.
So, take these charts for what they are — an unvarnished guide to trading $ARWR. It’s not just another biotech name; it’s a proving ground where momentum and discipline collide. Respect the swings and you may be rewarded. Forget them, and you’ll be reminded, brutally, of just how fast this market can turn.
We start with the best-case scenario:
Followed by the worst-case scenario:
If you really want to know what kind of beast you’re trading, you can’t just glance at one number and call it a day — you’ve got to drag the thing into the light and poke it from every angle. That’s what this performance grid does for Arrowhead Pharmaceuticals ($ARWR). Over the past year it’s up nearly 80%, which already makes the Nasdaq, the S&P, the Dow, and the poor Russell 2000 look like they’ve been napping through homeroom. But zoom into six months and ARWR is up a ridiculous 182%. That’s not performance — that’s a biotech rocket strapped to caffeine.
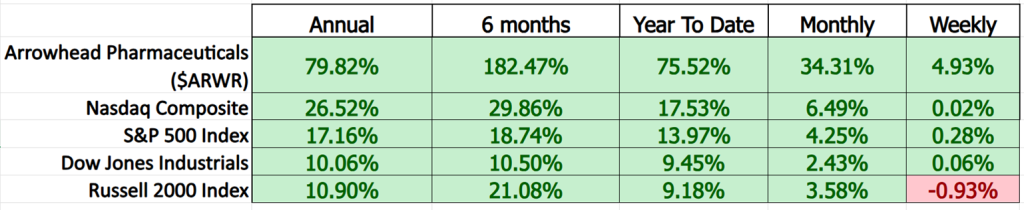
And here’s the point: you don’t get the full picture until you slice the data across different timeframes. Year-to-date it’s up 75%, monthly 34%, and even week-to-week it’s still cranking out nearly 5%. Compare that to the indexes, where the “big dogs” of the S&P and Dow are trudging along in single digits. It’s like putting a greyhound on the same racetrack as a couple of basset hounds — the comparison is almost unfair, but it tells you who’s got the legs.
So, when traders talk about “knowing your stock,” this is what they mean. Looking at one timeframe is like judging a marathoner after they’ve run to the mailbox. To appreciate the full story, you’ve got to check the performance over weeks, months, and years. And when you do that with ARWR, the message is obvious: this isn’t some sleepy index tracker — it’s a high-voltage biotech with the kind of juice that traders dream about, and the kind of volatility that’ll humble you if you’re not paying attention.
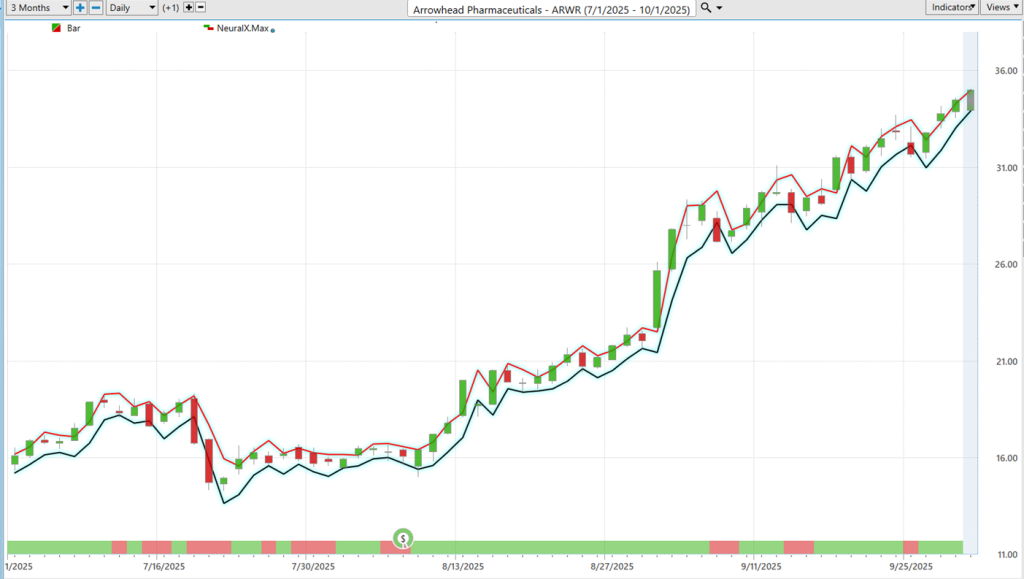
Vantagepoint A.I. Predictive Blue Line
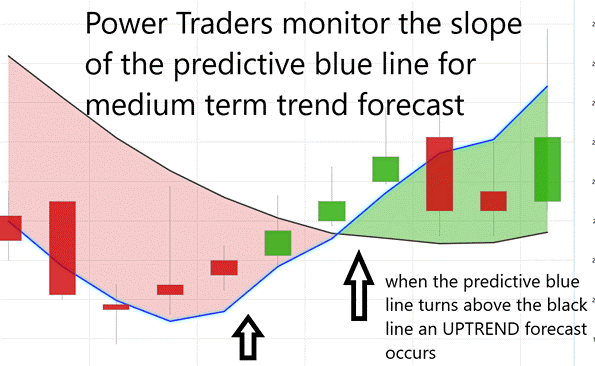
The predictive blue line in VantagePoint’s A.I. system is meant to act as a forward-looking compass, guiding traders through the chaos of daily price action. The rules are deceptively simple: when the blue line crosses above the black line — the actual moving average — the trend is expected to turn higher. When it dips below, the forecast is for weakness ahead. Traders use it not as a crystal ball but as a probability-weighted signal, a way to stack the odds in their favor when volatility makes the future feel unknowable.
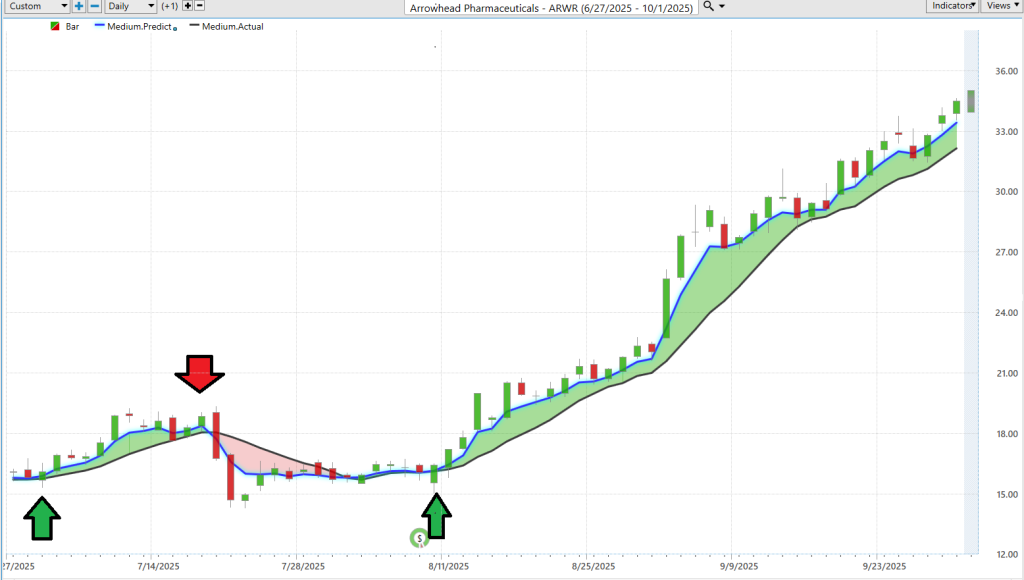
Now look at the last three months of Arrowhead Pharmaceuticals ($ARWR). This chart reads like a textbook case of what the blue line is built to do. In early July, the predictive line began to roll over, dipping beneath the actual average just as the stock stumbled, warning of short-term weakness. That stretch in mid-July into early August was choppy, red candles piling up, and the A.I. stayed defensive — signaling caution as the stock searched for a floor.
But in early August, the narrative flipped. The blue line turned up, crossed decisively above the black line, and never really looked back. From that moment, $ARWR entered a steady climb, with the A.I. keeping traders in the trade despite the inevitable pullbacks. The predictive model navigated the volatility by filtering out the noise — holding long through August and September as the stock went from the low 20s to the mid-30s. That’s the power of the signal: not eliminating risk but keeping traders aligned with the prevailing trend when emotions might otherwise shake them out.
Neural Network Forecast (Machine Learning)
A neural network for trading is basically a digital brain built out of math. Instead of thinking about pizza or recess, this brain chews through mountains of market data — prices from years ago, how other markets are moving, weird little technical squiggles on charts, even global connections that would make your head hurt. It passes all this data back and forth between thousands of “neurons” (little calculators), each one deciding what matters most. After enough passes, the system starts spotting patterns no human could see unless they had a thousand eyes and never slept.
Does this mean it predicts the future like some Wall Street fortune teller? Nope. What it spits out is more like odds at a racetrack. It tells you, “Hey, the chances are higher that the market might go up… or down… right about here.” The neural index, for example, is like a short-term warning light. It flips red when weakness is likely over the next couple of days. And sure enough, prices usually stumble right after. The predictive blue line? That’s its way of saying which direction the trend is leaning, so you can ride along without getting bucked off.
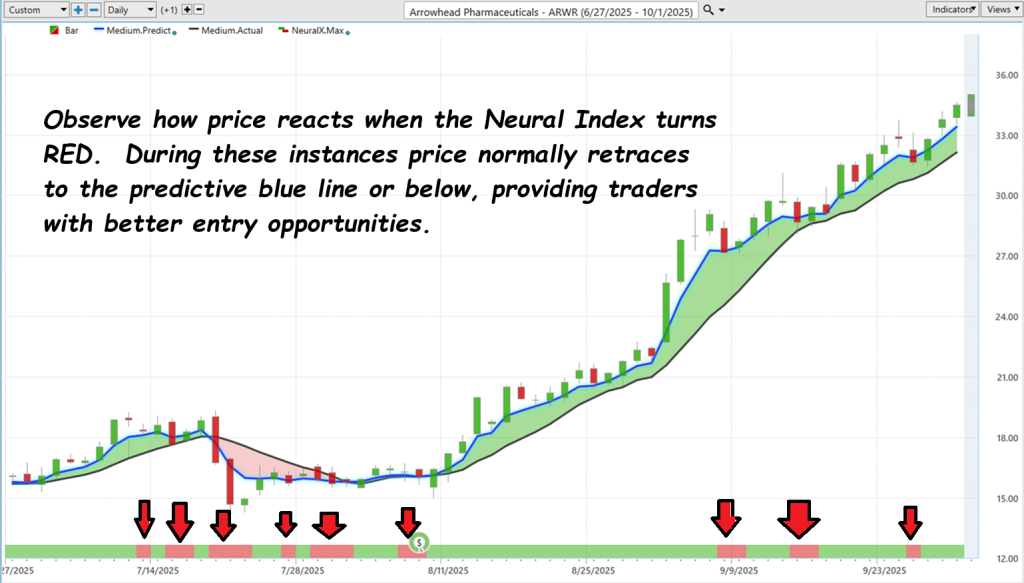
Here’s the real kicker: the network gives traders a head start. Instead of reacting after the market already smacks you in the face, you can prepare for it — tighten up your risk, adjust your plan, or brace for turbulence. In crazy markets like biotech stocks, where prices can rocket one day and crater the next, that little slice of anticipation can mean the difference between surfing the wave and drowning under it. Think of it less like magic and more like having a weather forecast — maybe it’s not perfect, but you’d still rather pack an umbrella before the storm hits.
VantagePoint A.I. Daily Range Forecast
What traders crave, is not more chaos — it’s clarity. And clarity, in these markets, comes from having a systematic method that takes the guesswork out of timing entries and exits. That’s exactly what the VantagePoint A.I. Daily Range Forecast provides.
ARWR isn’t some sleepy blue-chip — it moves. On average, you’re talking about 5.6% swings daily, 13.4% weekly, and nearly 32% monthly. That’s volatility by any definition. But here’s the point: it’s volatility you can measure, and if you can measure it, you can trade it.
Here are the average trading ranges for the daily, weekly and monthly time frames:
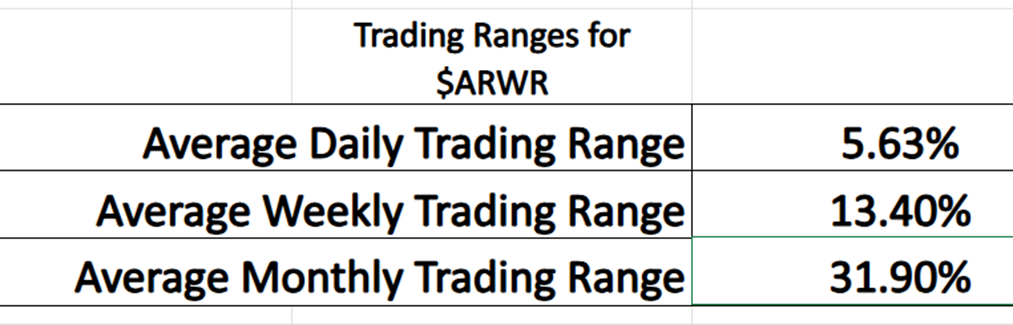
Look closely at the following chart: those red and green candles may look unruly, but the A.I.’s range forecast wraps around them like a map, spelling out where the risk is low, where the opportunity lies, and when to step aside. The trends aren’t muddled, they’re clearly defined — showing traders the road forward in real time.
Put the two visuals together and you’ve got a powerful story. Yes, $ARWR is volatile. But the daily range forecast gives you the potential playbook, and the average ranges give you the scale of opportunity. For disciplined traders, this isn’t about being tossed around by a wild market. It’s about harnessing the energy of volatility, turning what looks like disorder into the very structure of possible profit.
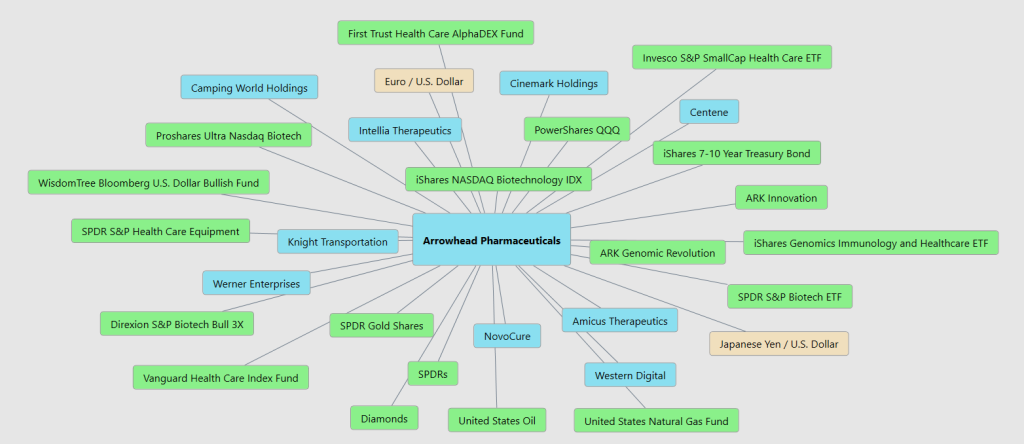
Intermarket Analysis
Arrowhead Pharmaceuticals ($ARWR) isn’t just some lonely science fair project — it’s strapped into a whole amusement park of markets that yank and tug it around. When biotech buddies like the XBI or QQQ blast off on hot trial results or juicy partnership news, Arrowhead rides shotgun, grinning ear to ear. But the villains lurk in the shadows: Treasury bonds tank when interest rates jump, the dollar flexes like a bully on the playground, and suddenly ARWR face-plants like a kid on roller skates.
This is intermarket analysis — translation: everything’s connected, and it’s a mess. Oil spikes, gold glitters, or currencies wobble, and the ripple hits biotech whether the lab coats like it or not. One sector’s victory lap can mean another’s funeral march. The trick isn’t to memorize every connection, it’s to know which ones matter most: biotech news, bonds, and the dollar. That’s where the leash is tied.
Bottom line? Don’t get hypnotized by the circus lights. Arrowhead’s fortunes swing on drug data and big-pharma partnerships, but the broader market mood sets the stage. If you ignore those crosscurrents, you’ll wake up broke and confused, wondering how your “sure thing” stock got eaten alive by a bond tantrum or a dollar rally. Pay attention, or this biotech stock will chew you up and spit you out — probably before lunch.
Our Suggestion
Let’s step back and look at Arrowhead Pharmaceuticals the way a persuasive copywriter might — because in biotech, perception often fuels price as much as performance.
The last two earnings calls tell a familiar story in this industry: dazzling promises paired with daunting costs.
And that brings us to the central issue: the cash burn. Arrowhead has been torching money for five years straight, and the most recent quarter was no exception, with $146 million disappearing in just one quarter. Analysts expect a full-year burn north of half a billion dollars. That would make even seasoned traders swallow hard. Management insists they’ve built in safety nets — the Sarepta deal, other licensing agreements, and a supposed multi-year runway — but the market knows those lifelines only hold if the clinical data cooperates and the partnerships deliver. If one of those pillars crumbles, the runway shortens fast.
So why has the stock soared this year? The answer is part psychology, part timing. The Sarepta deal was a big headline that injected both capital and credibility. Investors love a blockbuster partnership — it feels like validation that the science works and the company matters. Add to that the growing momentum behind plozasiran, speculation about regulatory milestones, and a broader wave of enthusiasm in the RNAi space, and you’ve got a recipe for traders piling in. This is classic biotech: asymmetric risk. The downside is ugly but finite, while the upside — if just one of these therapies lands — is massive. Layer in management’s reassurance that cash should last into 2028, and the fear of running out of money (the biggest killer in biotech) fades, leaving room for hope to do its work.
Here’s the bottom line: ARWR is a firecracker with a long fuse. The glow is real, the potential explosive, and traders are right to pay attention. But don’t let the confidence on the earnings calls fool you into thinking the risks have vanished. This company is still bleeding cash. Its deals are life preservers that may or may not hold. And yet — this is exactly why traders are drawn in. The volatility, the promise, the chance to ride a rocket if the science pays off.
In biotech, there are no free rides. If you trade $ARWR, do it with your eyes wide open. Respect the risks, manage your stops, and remember: the story here isn’t about certainty. It’s about possibility. And possibility, in markets, is often enough to move mountains.
Practice great money management on all your trades.
If you choose to get involved in $ARWR, position sizing is critical.
Use the VantagePoint A.I. Daily Range Forecast for short tern trading opportunities.
It’s not magic.
It’s machine learning.
Disclaimer: THERE IS A HIGH DEGREE OF RISK INVOLVED IN TRADING. IT IS NOT PRUDENT OR ADVISABLE TO MAKE TRADING DECISIONS THAT ARE BEYOND YOUR FINANCIAL MEANS OR INVOLVE TRADING CAPITAL THAT YOU ARE NOT WILLING AND CAPABLE OF LOSING.
VANTAGEPOINT’S MARKETING CAMPAIGNS, OF ANY KIND, DO NOT CONSTITUTE TRADING ADVICE OR AN ENDORSEMENT OR RECOMMENDATION BY VANTAGEPOINT AI OR ANY ASSOCIATED AFFILIATES OF ANY TRADING METHODS, PROGRAMS, SYSTEMS OR ROUTINES. VANTAGEPOINT’S PERSONNEL ARE NOT LICENSED BROKERS OR ADVISORS AND DO NOT OFFER TRADING ADVICE.


