


When Will A Bitcoin Reversal Occur?
One of the most polarizing topics in analyzing financial markets is the topic of Cryptocurrency and Bitcoin trend reversals. As you dig into this newly emerging field you will find an abundance of opinions and perspectives which clearly contradict one another regarding Bitcoin’s long-term use in the financial landscape. While this is frightening to many new investors, and responsible for unheard of volatility, we would argue that this is how price discovery occurs in free markets.
Supporters of Bitcoin argue that it’s vying to become the reserve currency of the world and, in so attempting it, is being forced to absorb all attackers to demonstrate its worthiness. Critics of Bitcoin contend that it is nothing more than a speculative bubble comparable to the tulip bulbs in the 1600’s in Holland and far too volatile to ever be considered a currency for the world. Amidst these two opposing viewpoints Bitcoin functions. And these dramatically opposing views are responsible for it having the greatest returns of any asset in history, as well as the greatest volatility.
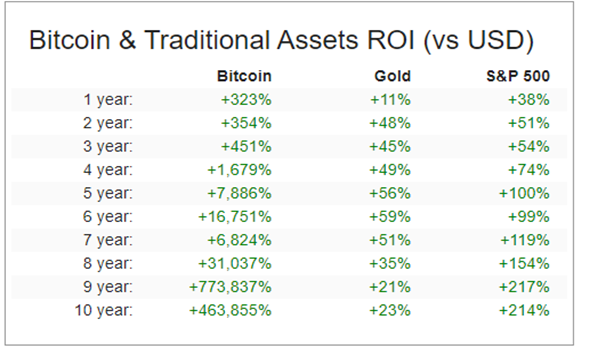
Even if you are a stalwart critic of Bitcoin, it’s important to compare its returns to those of more established and traditional asset classes. Here is a chart of the returns that Bitcoin has established over the last decade when compared to the S&P 500 and Gold.
But these types of returns come at the price of tremendous volatility. Over the last decade we have seen multiple corrections and pullbacks in Bitcoin which totaled more than 50%. Often these corrections happen in a very short period of time, and their abruptness leads critics to conclude and comment that the leading cryptocurrency was “always just a fad.”
The following graphic by the Visual Capitalist beautifully illustrates how violent these corrections have been.
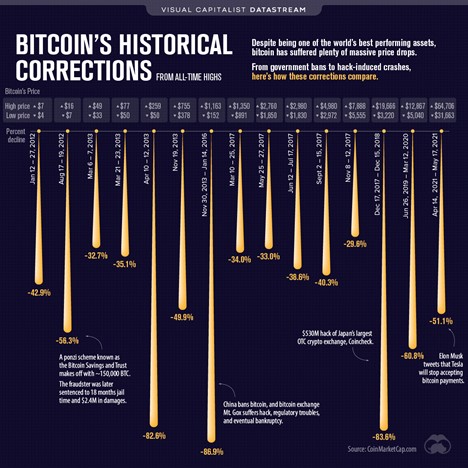
When you study this volatility, observe at how quickly these sudden drops occurred. Often it is a matter of days. Also look at how regularly they occur and what was attributed to cause the slide. As I write these words Bitcoin has experienced 6 pullbacks of over 50% over the last decade. Each time it has recovered and gone on to new market highs but usually it requires many months or possibly years for it to resume its upward trajectory.
This is not unlike the massive selloff that Amazon experienced in the dotcom bubble of the late 90’s. During this challenging time the premiere ecommerce titan lost more than 90% of its valuation over the period of two years.
The question immediately arises whenever you see a blue-chip asset experience a massive pullback, when and where will the Bitcoin trend reversal occur?
Bitcoin attracts two types of investors. The first is a long-term “HODLer” which plans on holding the asset for 4 years or longer. The second is a short-term trader who sees that the volatility in this asset class, presents a huge opportunity to ride a trend to profits.
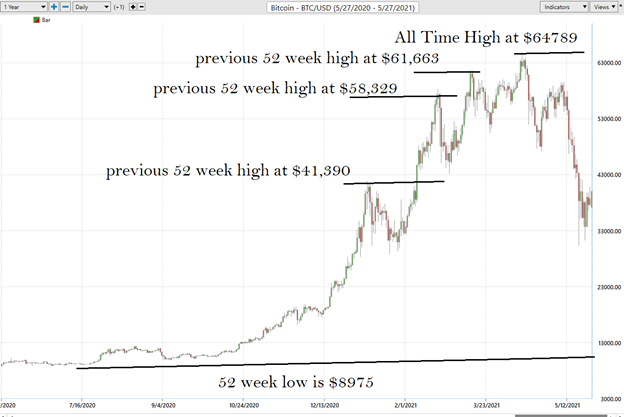
Let’s start our analysis with the commonsense metrics. Over the last 52 weeks Bitcoin has traded as high as $64,863 and as low as $8,975. This tells us that the annual trading range has been $55,888. The average weekly trading range is $1,074.76.
When we study the charts, we start by analyzing where the market is in relationship to its 52-week high and low.
Experience tells us that assets which successfully breach their 52-week highs on strong momentum tend to move higher, and vice-versa. The following 1-year Bitcoin chart shows the most recent 52 week high and low boundaries. Simply being aware of these boundaries has been invaluable for both traders and HODLer’s. Cross referencing this information with the VantagePoint Artificial Intelligence forecast provides a powerful indicator for finding entry points in strong trends.
While we do not create a valuation based upon fundamental factors, we study the fundamentals of a market to understand the financial landscape that an asset is operating under. Bitcoin operates by rewarding Bitcoin miners by paying them a total of 900 Bitcoins a day for protecting the integrity of the Bitcoin network. To understand the implications of this reality, simply compare the value of Bitcoins market cap to its daily supply. Currently, it has a market cap of roughly $770 billion dollars but only $36 million dollars of new Bitcoin at current prices are made available each day. This fact can and does potentially create a supply and demand imbalance in Bitcoin. When uptrends occur, a large scarcity of Bitcoin develops as miners hold on to their Bitcoin forcing prices higher.
The Vantagepoint A.I. Analysis
Whenever we look at an asset forecast, we always are comparing what the asset has done, to the artificial intelligence, which is computing its forecast based upon a proprietary intermarket analysis of the most closely correlated assets as well as a neural network computation.
The key to the Vantagepoint analysis is the predictive blue line. The slope and general direction of the blue line determines the trend forecast for the market.
The Vantagepoint Software has three separate modules which create a forecast for a Power Trader. They are the predictive blue line, the Neural Net, and the Intermarket Analysis.
An analogy is in order. Think of the underlying trend of the market as a river. A river is supported by smaller tributaries and streams. To navigate the river effectively and to avoid danger as much as possible we want to know the direction of the flow. Ideally, we want to be involved with a trend when all flows are pointing in the same direction.
To accomplish this objective, we need to rely upon a:
- Short Term forecast
- Medium-Term forecast
- Long Term forecast.
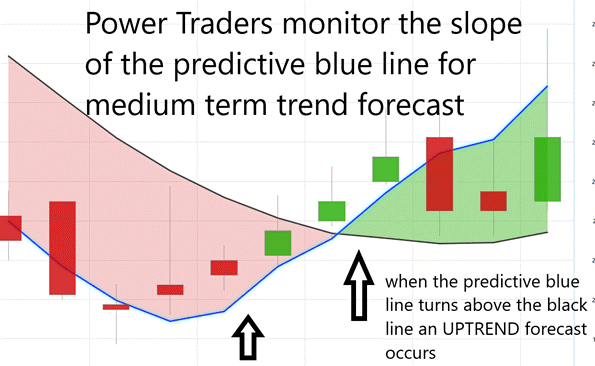
The predictive blue line also acts as value zone where in uptrends traders try to purchase the asset at or below the blue line. Power traders use the predictive blue line in helping to determine both the value zone as well as the trend direction.
The black line that you see that is a regular simple 10 period moving average.It’s a good measure of where market prices have been over a given period of time. But as traders we really need to understand is where our market price is moving going forward.
So, we compare that black line value on the chart to the predictive blue line, which is actually VantagePoint’s predictive indicator. VantagePoint performs what’s called intermarket analysis. That means there are known relationships as far as those neural networks are concerned that affect and drive the future price of lumber. That could be markets like the major lumber suppliers or the Russell 2000 or things like global currencies or global interest rates, or futures and commodity markets.
To understand and appreciate how powerful this indicator is, let me show it to you without any of the daily price bars on the chart.
- The slope of the predictive blue line determines the short-term trend. On the following graphic, monitor that you would want to buy when the slope of the blue line is going up.
- When the slope of the blue line is going sideways you would be anticipating sideways prices.
- Likewise, when the slope of the blue line is going down you would be anticipating lower prices.
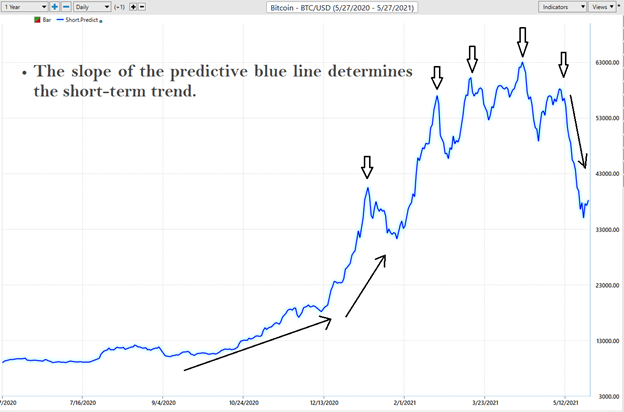
The predictive blue line above is used by aggressive short-term traders. It is calculated every day and its slope and overall direction determines the short-term trend forecast of the market.
But more conservative traders who look for long-term trends and confirmation would look at a long-term predictive blue line to help them navigate the volatility. The longer-term predictive blue line will have fewer forecasts because it focuses on a longer-term trend horizon to make its forecasts. Here is what the longer-term predictive blue line would look like:
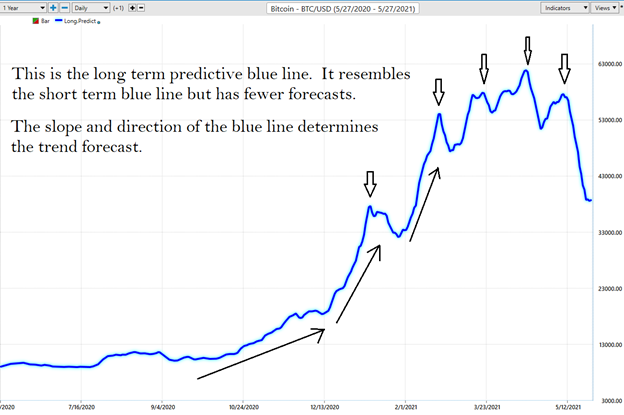
The power of combining both the long-term forecast and the short-term forecast is what gives the VantagePoint Software its unparalleled accuracy in predicting Bitcoin trend reversals.
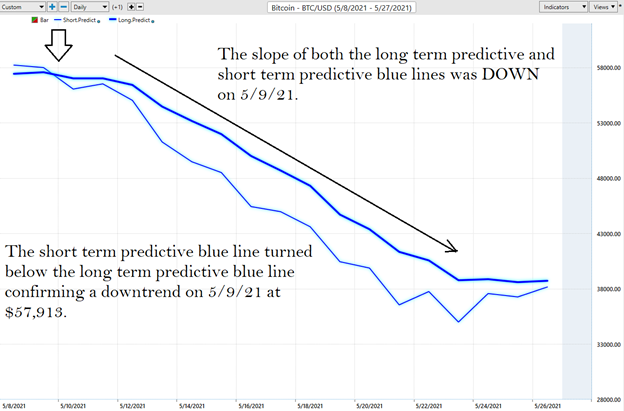
This next graphic simply overlays both previous charts and focuses on the time frame of May 8th to May 27th. By simply overlaying both blue lines on top of one another a Power Trader receives confirmation on the short-term trend and long-term trend both flowing in the same direction. (DOWN)
Here is the complete chart with the daily price bars so that you see the entirety of the trend that the artificial intelligence captured.
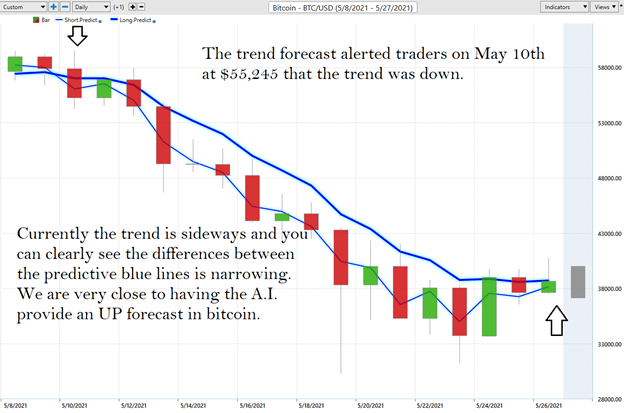
Observe “when” the SLOPE of the predictive blue line started moving lower and how price behaved.
- Many Power Traders look to try to SELL the asset at or above the predictive blue line, as that is considered to be the IDEAL VALUE zone for traders.
- Many Power Traders look to try to BUY the asset at or below the predictive blue line, as that is considered to be the IDEAL VALUE zone for traders.
During this recent sharp drop in Bitcoin Vantagepoint traders clearly knew and were alerted to the reality that the short-term forecast and long-term forecast were for LOWER prices.
At the bottom of the chart is the Neural Network Indicator which predicts future short-term strength and/or weakness in the market. When the Neural Net Indicator is green it communicates strength. When the Neural Net is Red it is forecasting short term weakness in the market.
We advocate that Power Traders cross reference the chart with the predictive blue line and neural network indicator to create optimal entry and exit points.
Power Traders are always looking to apply both the neural network and A.I. to the markets to find statistically sound trading opportunities.
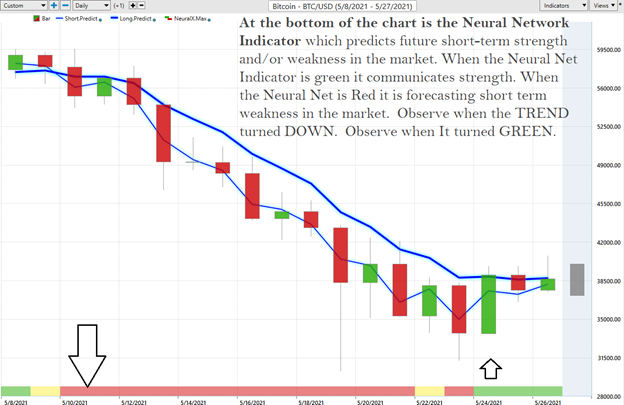
Please note that on May 10, 2021 the short term predictive blue line as well as the long term predictive blue line indicated that the trend was DOWN. This was confirmed by the NeuralNet which was also forecasting future price weakness in the Bitcoin market.
Also note that on 5/24/21 the NeuralNet turned green providing the first preliminary possibility that the sharp downtrend move had concluded.
Observe how the two pairs of predictive blue lines are moving closer together and converging, indicating an exhaustion of the downtrend which began on May 10, 2021 may be occurring.
What makes VantagePoint unique and distinct when compared to all other analytical tools is its patented and proprietary intermarket analysis.
Intermarket analysis is a method of analyzing markets by examining the correlations between different asset classes. In other words, what happens in one market could, and probably does, affect other markets, so a study of the relationship(s) is often very helpful to a trader.
Fine Tuning Entries and Exits of Bitcoin
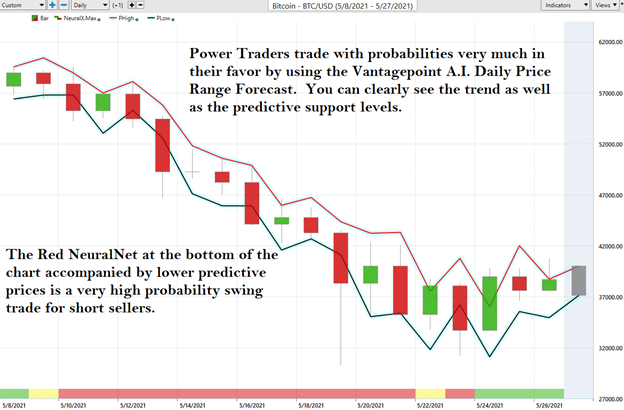
One of the powerful features in the Vantagepoint A.I. Software which Power Traders use on a daily basis is the Price Range prediction forecast.
This forecast is what permits Power Traders to truly fine tune their entries and exits into the market.
At 6:30pm after the market close the software updates and all of the price predictions change based upon what the machine learning, A.I., neural networks, and intermarket analysis anticipate moving forward.
Here is the price chart of Bitcoin during the most recent drop featuring the Daily Price Range forecast with the NeuralNet Index at the bottom of the chart. Day traders who are looking for short term swings in the markets focus on the daily price ranges to place their entry and exit orders.
By utilizing both of these tools simultaneously Power Traders can locate precision entries and exits with high probabilities of success and are capable of exploiting short-term swing trading opportunities.
Traders use these Vantagepoint tools either independently or together to find great trading opportunities. This is the power at your fingertips when you use artificial intelligence to do your trend analysis. The slopes of the price channels above clearly delineate the trends.
Intermarket Analysis of Bitcoin
We live in a global marketplace. Everything is interconnected. The billion-dollar question for traders is always what are the key drivers of price for the underlying asset that I am trading? What influences a Bitcoin trend reversal?
What makes Vantagepoint unique and distinct when compared to all other analytical tools is its patented and proprietary intermarket analysis.
Intermarket analysis is a method of analyzing markets by examining the correlations between different asset classes. In other words, what happens in one market could, and probably does, affect other markets, so a study of the relationship(s) is often very helpful to a trader.
There is great value to be had in studying and understanding the key drivers of Bitcoin’s price action. While the headlines were screaming about Elon Musk tweeting, let’s look at the most highly correlated financial assets at present to Bitcoins price action.
- U.S. Ten Year Treasury Notes
- U.S. Dollar Index
- S&P 500 Index
- Light Sweet Crude
These four markets have been the key drivers in Bitcoin’s price action. As bonds tumble and interest rates go up the perspective among institutional traders buying U.S. Treasuries becomes less risky. There is tremendous power in intermarket analysis as it immunizes you from fake news reports in the media. Elon Musk can tweet all day and all night and he may get credit for the fall in Bitcoin’s price, but the key drivers of price are telling you what is most statistically correlated to Bitcoin as the price drop is occurring.

Instead of looking at financial markets or asset classes on an individual basis, intermarket analysis looks at several strongly correlated markets, or asset classes, such as other stocks, currencies, ETF’s, and commodities. This type of analysis expands on simply looking at each individual market or asset in isolation by also looking at other markets or assets that have a strong relationship to the market or asset being considered. The Vantagepoint software analyzes the top 31 drivers of an assets price. This analysis will often show ETF’s which are big owners of the underlying asset, but it will also uncover other markets which are statistically correlated to the trend you are analyzing. Traders often find other blossoming opportunities when engaging in Intermarket Analysis.
Our Suggestion for Bitcoin
Bitcoin will continue to be amongst the most volatile assets in the financial markets. As we noted earlier in this blog post, Bitcoin has seen numerous 80%+ drops in the past few years. This should be considered normal for an asset that is vying to become the currency reserve of the world.
Volatile markets present tremendous opportunity and risk to traders. As we have outlined in this post, we make all of our trading evaluations by focusing on the artificial intelligence forecast, the NeuralNet and the daily price range forecast. At the time of this writing, the indicators are all in a sideways trend but looking like within they are nearing a point where an UP forecast occurs again.
By applying each of the elements in the Vantagepoint A.I. forecast and assembling them together you put the probabilities of success in your favor. Here is a quick snapshot of the daily Bitcoin price chart with the Vantagepoint A.I. trend forecast at the present time:

An uptrend is defined as a series of higher highs and higher lows.
A downtrend is defined as a series of lower highs and lower lows.
The chart above looks to us like the downtrend is completing.
The artificial intelligence is confirming that aspect of the analysis.
The current trend is sideways.
We anticipate short term choppy price action before an UPTREND forecast occurs.
We are waiting for the artificial intelligence to signal when that time occurs.
Bitcoin is a phenomenally volatile trading instrument. We have it on our radar and are awaiting the next UPTREND opportunity.
When the reversal occurs, you can rest assured that the artificial intelligence will alert the Vantagepoint Family of this development.
Let’s Be Careful Out There!
It’s Not Magic. It’s Machine Learning.
Disclaimer: THERE IS A HIGH DEGREE OF RISK INVOLVED IN TRADING. IT IS NOT PRUDENT OR ADVISABLE TO MAKE TRADING DECISIONS THAT ARE BEYOND YOUR FINANCIAL MEANS OR INVOLVE TRADING CAPITAL THAT YOU ARE NOT WILLING AND CAPABLE OF LOSING.
VANTAGEPOINT’S MARKETING CAMPAIGNS, OF ANY KIND, DO NOT CONSTITUTE TRADING ADVICE OR AN ENDORSEMENT OR RECOMMENDATION BY VANTAGEPOINT AI OR ANY ASSOCIATED AFFILIATES OF ANY TRADING METHODS, PROGRAMS, SYSTEMS OR ROUTINES. VANTAGEPOINT’S PERSONNEL ARE NOT LICENSED BROKERS OR ADVISORS AND DO NOT OFFER TRADING ADVICE.


