


This week’s ai stock spotlight is the Buckle ($BKE)
The Buckle isn’t just another mall store — it’s a cash-stacked denim machine with zero debt dragging it down. Half their sales come from their own private-label gear, which means they pocket the fat margins instead of handing them off to some outside brand. And while competitors like American Eagle and Abercrombie sprint and stumble, Buckle quietly pays you just for sticking around — steady quarterly dividends with the occasional big, juicy special payout. Best part? They hand traders a gift most retailers don’t: monthly sales updates that give you a fast pulse check on how the business is really doing.
Imagine a retailer from Nebraska that never quite got the memo that malls were supposed to be dead. That’s The Buckle, ticker BKE, and it’s still moving denim like it’s 1999 — except now it has an e-commerce tab and enough cash to wallpaper its HQ. The company employs about 8,000 people, which is just enough to fill a couple of high school football stadiums. Unlike some peers, Buckle didn’t pile up debt when times were good, so now it sits on a stack of cash and sends shareholders regular dividend checks, with the occasional Christmas bonus in the form of a “special dividend.” That’s the kind of Midwestern generosity you don’t see from, say, Gap.
Buckle’s playbook is straightforward. About half of its sales come from private-label jeans, shirts, and accessories. That means they’re not just reselling other brands but slapping their own label on products with better markups. It’s like running a lemonade stand but charging Starbucks prices. They make the most money when fashion tastes align with their in-house designs; when they don’t, markdowns start eating away at the margin pie.
In fiscal 2024, Buckle’s gross margin clocked in at about 48.7%. For a mall retailer, that’s not just good — that’s “finding a $20 bill in last year’s winter coat” good. Operating margin was nearly 20%. And despite mall traffic sagging for the last decade, they’ve managed to post positive comps in 2025 so far. Through August, sales were up about 7.2% year to date. That’s not Amazon-level growth, but for mall-based denim it’s respectable.
Let’s talk competitors. Buckle’s main rivals are the usual suspects of teenage mall culture: American Eagle (AEO), Abercrombie & Fitch (ANF), Urban Outfitters (URBN), Zumiez (ZUMZ), Tillys (TLYS), and good old Gap (GPS). Each of them has their own problems — Abercrombie has been busy with a brand makeover, Urban Outfitters sells to kids who’d rather thrift, and Gap has been trying to re-learn how to make jeans since the Obama administration.
Buckle differs from this group in three big ways. First, its private-label share of nearly 50% gives it pricing power and margin stability. Second, the company’s balance sheet looks like a neat freak’s sock drawer — no debt, tidy cash piles. Third, the stores lean on service: real people help you try on jeans. That’s either charmingly retro or hopelessly inefficient, depending on your view of the future.
The Buckle ($BKE) is a dividend darling. Regular quarterly payouts are 35 cents a share, and last December they dropped a $2.50 per share “special dividend” just for kicks. Owning BKE can be like renting out a vending machine — you don’t expect massive growth, but you keep getting quarters.
Over the past five years, The Buckle’s story has been one of sharp momentum, followed by a steady cool-down. In 2020, revenue sat just above $900 million, with earnings at $130 million. Then came the boom: 2021 and 2022 saw revenue climb past $1.3 billion and earnings nearly double to around $255 million, a surge fueled by a post-pandemic rebound in discretionary spending and shoppers eager to refresh wardrobes. But by 2023 and 2024, gravity reasserted itself. Sales slipped from their highs to $1.26 billion in 2023 and then $1.21 billion in 2024, with earnings sliding to $196 million. The pattern here isn’t complicated — it’s a classic case of peak-cycle consumer demand giving way to a tougher retail environment. For traders, this table is a reminder that Buckle isn’t immune to the rhythms of apparel retail: it can put up big numbers in the right macro climate, but it also lives and dies by consumer confidence, fashion cycles, and discretionary budgets. The company still produces healthy profits, but the glide path since 2022 suggests management’s biggest challenge ahead is defending margins while competing with faster-moving rivals.

What’s ahead? Opportunities lie in expanding online sales, which grew about 18% in Q2. They’ve got room to run because e-commerce is still a small slice of the pie. Holiday season is always the litmus test — will denim fly off the shelves or will markdowns chew up profits? And of course, there’s the gambler’s thrill of guessing if management will sprinkle another special dividend in December.
Risks? They’re obvious. Fashion missteps can sink margins. Mall traffic is a shaky foundation in an age where TikTok decides what people wear. Labor and rent costs don’t get cheaper. And competitors like Abercrombie and Urban Outfitters are outpacing Buckle on buzz. Even tariffs could rain on the parade by inflating sourcing costs.
So, what’s the verdict? If you’re bullish, you like the fact that Buckle is basically a cash cow mooing dividends and keeping its balance sheet cleaner than a Nebraska farmhouse kitchen. You like the monthly sales reports because they give you more frequent trading data than most retailers. And you like private-label margins that cushion downturns. If you’re bearish, you see a mall-based denim seller trying to fight the tide of fast fashion and e-commerce behemoths. You worry that one bad holiday season could unravel a lot of goodwill.
Here is a table which shows the performance of the Buckle to its main competitors across multiple time frames:

Traders should watch comps, private-label mix, digital growth, and dividend announcements. This isn’t a stock that will reinvent retail, but it’s one that can keep surprising you with its resilience. Think of it as the tortoise in a mall full of hares. And in markets, as in fairy tales, sometimes the tortoise pays a dividend.
In this stock study, we analyze the key indicators and metrics that guide our decisions on whether to buy, sell, or stand aside on a particular stock. These inputs serve as both our framework and behavioral compass, rooted in data and powered by predictive intelligence.
- Wall Street Analysts Ratings and Forecasts
- 52-Week High and Low Boundaries
- Best Case/Worst-Case Analysis
- VantagePoint A.I. Predictive Blue Line
- Neural Network Forecast (Machine Learning)
- VantagePoint A.I. Daily Range Forecast
- Intermarket Analysis
- Our Suggestion
While our decisions are ultimately anchored in artificial intelligence forecasts, we briefly review the company’s fundamentals to better understand the financial environment it operates in. For $BKE this context helps us assess the quality of the A.I. signal within a broader economic and industry backdrop.
Wall Street Analysts Price Forecasts

Wall Street’s view of The Buckle (BKE), is a reminder of just how thin the coverage can be for small-cap names. There aren’t many analysts spending their days digging into the company’s denim racks, but for the handful who do, the message is striking: they think the stock is priced too richly. The shares currently sit around $60.81, while the analyst forecasts cluster well below that — both the high and the median target stand at $54, and the low dips to $42. That’s a variance range of 20 percent from top to bottom. In other words, the professionals who make their livelihoods following this stock aren’t projecting any upside at today’s levels. Instead, they’re signaling caution — that this is a company with steady earnings but a valuation that looks stretched. For traders, that’s not a green light, but a flashing yellow: you can respect Buckle’s cash flow and dividends while recognizing that Wall Street, as it is, doesn’t see a bargain here.
52 Week High and Low Boundaries

If you ever wanted proof that stocks behave like a caffeinated teenager with car keys, look no further than Buckle’s 52-week chart. A year ago, this thing was sulking around $33.12, the market equivalent of skipping class. Fast forward and it’s now strutting up at $61.69, brushing right up against the 52-week high like the kid who suddenly shows up to prom in a rented tux and a questionable haircut. Traders love this picture not because it’s pretty, but because it tells you everything about the mood swings baked into a stock.The first question a savvy trader asks when staring at this chart is: how fast did it make the leap from loser to leader? Was it a slow grind — months of slogging higher? Or was it a sprint —panic buying, short covering, and a wave of “I’ll miss it if I don’t buy now”? The speed of that move says a lot about whether there’s conviction behind the rally, or if it’s just another market sugar high.
Now, look at the numbers in the second graphic. The distance between the high of $61.69 and the low of $33.12 — equals $28.57 — is the stock’s annual “playground.” Express that difference as a percentage of the current price, and you get 47%. That’s historical volatility in plain English: a measure of how much the stock bounces around in its sandbox. For traders, it’s not just an academic number — it’s the risk and opportunity rolled into one. Big ranges mean big chances to make money (or lose your shirt) if you time it wrong.
So why does this matter? Because the 52-week high and low are more than just bragging rights. They’re the guardrails of a stock’s reality check. Trading at 96.9% of its 52-week percentile means Buckle is about as close to the ceiling as it gets. Whether it breaks through or bounces back is the kind of question that keeps traders awake at night — and glued to charts like this one.

Best-Case/Worst-Case Scenario Analysis
short covering, and a wave of “I’ll miss it if I don’t buy now”? The speed of that move says a lot about whether there’s conviction behind the rally, or if it’s just another market sugar high.
Now, look at the numbers in the second graphic. The distance between the high of $61.69 and the low of $33.12 — equals $28.57 — is the stock’s annual “playground.” Express that difference as a percentage of the current price, and you get 47%. That’s historical volatility in plain English: a measure of how much the stock bounces around in its sandbox. For traders, it’s not just an academic number — it’s the risk and opportunity rolled into one. Big ranges mean big chances to make money (or lose your shirt) if you time it wrong.
So why does this matter? Because the 52-week high and low are more than just bragging rights. They’re the guardrails of a stock’s reality check. Trading at 96.9% of its 52-week percentile means Buckle is about as close to the ceiling as it gets. Whether it breaks through or bounces back is the kind of question that keeps traders awake at night — and glued to charts like this one.

The second chart highlights the ugliest stretches of uninterrupted selling — the stock slid 9.2%, then cratered another 36%, and later dropped 17.9% without taking much of a breath. For a trader, those moves weren’t just uncomfortable; they were portfolio gut-punches that underscored how quickly confidence can drain from a name.

Why are these streaks important? Because they frame risk and reward in the starkest terms possible. The declines remind traders of the downside lurking in small-cap retail, where sentiment can collapse overnight. The rallies, just as forcefully, prove the upside available when momentum flips and buyers flood in. Taken together, these uninterrupted runs are a crystal-clear picture of what traders are really managing: the constant balance between gut-churning drawdowns and exhilarating recoveries. It’s the very definition of risk and reward — spelled out in red and green bars.
What the performance comparison grid makes clear is that The Buckle (BKE), a small-cap specialty retailer out of Nebraska, has managed to outpace some of the most powerful engines in the global stock market. Over the last twelve months, the stock is up nearly 38%. Compare that with the Nasdaq Composite’s 27% gain and the S&P 500’s 17%, and you begin to appreciate the magnitude of the outperformance. Even more striking is the six-month number: Buckle is up 63.7% — more than double the Nasdaq and almost four times the S&P.

For traders, this isn’t just a statistical curiosity. It’s a reminder of how selective bets, even in unglamorous corners of the market, can trounce broad exposure to tech or blue chips. Buckle’s performance doesn’t come from revolutionary technology or trillion-dollar market caps; it comes from something far less headline-grabbing — selling jeans, controlling margins, and managing cash. And yet, the data shows that in just about every timeframe — year-to-date, monthly, weekly — the company has consistently outperformed the benchmark averages.
There’s a memorable lesson here: the indices tell the story of the market, but the outliers write the stories traders remember. Buckle, improbably, has been one of those outliers. In a world obsessed with the Magnificent Seven, a mall retailer from Nebraska has shown that performance leadership can come from the most unexpected places.
Vantagepoint A.I. Predictive Blue Line
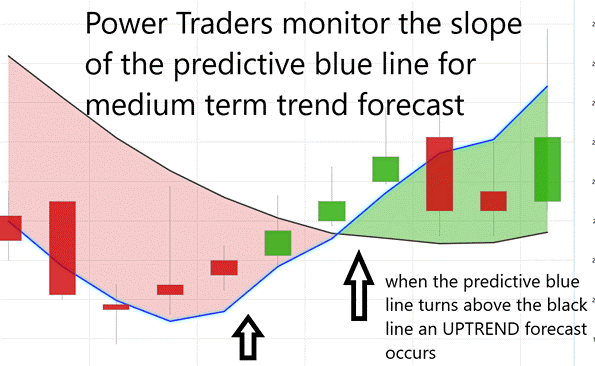
The rules of trading with VantagePoint’s predictive blue line are relatively straightforward, though their impact can be significant. The blue line is not a simple moving average — it’s a predictive indicator that recalculates daily, factoring in global intermarket data. The key rule is this: when the blue line crosses above the black line (the actual moving average), the forecast turns bullish, suggesting a buy opportunity. Conversely, when the blue line crosses below, it signals weakness, and traders are often advised to exit or short. The discipline comes from following those signals consistently, letting the model dictate entries and exits rather than emotions.
Now, let’s look at the attached chart. The forecast flipped bullish on April 4th at $35.54. Since then, the stock has staged an extraordinary rally, pushing into the $61 area — a gain of more than 70% in just over five months. What stands out here is not just the magnitude of the move, but the consistency of the trend: the blue line remained above the black line throughout the spring and summer, reinforcing the buy signal and helping traders stay in the trade even through normal pullbacks. For traders, this is the essence of what the predictive blue line aims to deliver: earlier entry points, fewer whipsaws, and the confidence to ride a trend until the forecast says otherwise.

In a market environment where headlines can shift sentiment overnight, the discipline of following an A.I.-driven signal has real appeal. The Buckle’s rally from the mid-30s into the 60s is a case study in how predictive analytics, when respected, can transform what might have been a short-term trade into a longer-term winning position.
Neural Network Forecast (Machine Learning)
A neural network, in trading terms, is essentially an artificial brain built to recognize patterns in the markets. It’s constructed by feeding vast amounts of historical and intermarket data — stocks, commodities, currencies, interest rates — into layers of interconnected “nodes” that process the information. Each layer passes signals to the next, adjusting weights and probabilities along the way. The end result isn’t a crystal ball, but a probability engine designed to pick up on relationships too complex or subtle for humans to detect.
For traders, the value is clear. Neural networks improve decision making by reducing guesswork. They highlight when conditions across multiple markets align to favor strength or weakness in a particular stock. Instead of relying on gut instinct alone, traders get a forward-looking gauge — one that updates daily based on shifting inputs.
Now, take a look at the attached chart of The Buckle (BKE). At the base, you see the Neural Index. When it’s green, price has pushed solidly higher — note the strong uptrend that followed those signals. But when the index turns red, that’s the system warning of near-term weakness. In practice, that means traders should expect price to pull back, often slipping below the predictive blue line until conditions reset.

The lesson here is straightforward: the Neural Index isn’t about predicting the next tick; it’s about giving traders an edge in timing — knowing when to lean into a move and when to step aside. In markets where timing is everything, that edge can make all the difference.
VantagePoint A.I. Daily Range Forecast

Folks, let’s talk about opportunity wrapped in volatility. Take a look at these trading range metrics for Buckle: the average daily range sits at 2.76%, the weekly expands to 6.5%, and the monthly balloons to more than 14%. That’s real movement. For traders, it means there’s plenty of meat on the bone. These aren’t the slow-grinding names that sit flat and sap your capital; this is a stock that gives you room to maneuver, room to trade, and room to win.
Now here’s where it gets even better. Look at the VantagePoint A.I. Daily Range Forecast. What you’re seeing isn’t guesswork, it’s precision. Every single trading day, the forecast draws the guardrails — an expected high, an expected low. That’s exact guidance. Instead of wondering where the stock might stall or bounce, traders are handed a clear map of what’s probable. And the chart doesn’t just show the levels — it shows the trend, drawn out and reinforced day after day.

So while the volatility provides the fuel, the forecast provides the steering wheel. Buckle’s got the moves, VantagePoint brings the control, and together they create exactly the kind of environment active traders crave: volatility you can trade, not just volatility you can fear.
Intermarket Analysis
Smart traders know: intermarket analysis isn’t voodoo, it’s the master key to the markets. Everything is connected. When interest rates rise, the cost of money rises — and stocks, commodities, and currencies all react. When oil drops, it puts extra cash in consumers’ pockets. When the dollar flexes, it shifts the cost of imports and exports. Miss these connections and you’re trading blind. See them clearly, and you’re one of the few who can consistently get on the right side of the big moves.
Now let’s put this lens on The Buckle (BKE). This small-cap retailer lives and dies by consumer confidence. Rising rates and stubborn inflation? They crimp spending. Falling energy prices and a booming stock market? They free up wallets and supercharge retail. In short, BKE doesn’t move in isolation — it dances to the rhythm of the entire economy. Bonds whisper clues, commodities send signals, and the dollar adds its own push or pull.
So what really drives the stock higher? Earnings that surprise. Same-store sales climbing double digits. Smart merchandising that leans on private labels and margin-rich product lines. And don’t forget: a dividend near 8% makes it a stock that pays you while you wait. But this is retail — competition is fierce, trends shift fast, and economic headwinds can slam the brakes without warning.
Trading Buckle (BKE) isn’t just about staring at its price chart — it’s about seeing the hidden strings yanking it around, from oil and the dollar to rivals like American Eagle and ETFs like the Russell 2000. One ripple in bonds, gold, or currencies can slam retail stocks higher or drag them into the dirt, and if you’re blind to those connections you’re the sucker at the table. This intermarket map is your X-ray vision — the unfair advantage that shows you exactly who’s pulling the levers before the crowd wakes up.
Bottom line: if you understand how the invisible threads of intermarket forces tug on BKE’s story, you don’t just see a retailer. You see a roadmap. One that can take you from catching fads too late to catching opportunities early — before the crowd catches on.

Our Suggestion
In the last two earnings calls, Buckle has delivered more than just modest results — it’s shown sustained growth, margin improvement, and strategic discipline. In Q2 FY2025, the company reported net sales of $305.7 million, up 8.3% year-over-year, while comparable same-store sales rose about 7.3%. Online sales grew 17.7%, showing that digital isn’t just a footnote but a meaningful lever. Gross margin nudged up as well, and operating income climbed to $56.3 million, or about 18.4% of net sales, versus 17.1% a year ago.
Yes, the company is growing — not at breakneck startup speed, but in a healthy, sustainable fashion. Women’s merchandise and kids’ lines are outperforming, while online channels continue to expand. Physical store count remains stable: 440 stores across 42 states, with a modest net of new openings, remodels, and closures. Liquidly is strong: almost $300 million in cash and short-term investments, no long-term debt, solid working capital.
The stock is accelerating because momentum, credibility, and expectations are combining. The rising trajectory of sales (both in-store comps and digital), combined with margin expansion, is building confidence. Investors see that Buckle is doing more than just keeping up — it’s pulling ahead in margin, executing on its product mix, and not getting bogged down by debt or liquidity stress. Those “average trading ranges” we discussed also point to volatility; but where there’s volatility, there’s opportunity — and Buckle’s performance is giving traders tangible proof.
Management’s future objectives are equally telling: they’re focused on refining and reinforcing what’s already working. They plan selective store openings and some remodeling to keep their brick-and-mortar footprint fresh; they continue to invest in the digital experience; and they’re emphasizing product categories — women’s, kids, private label — with higher margin potential. Inventory efficiency is on the agenda, as is keeping operating leverage (costs vs. revenue) in check. They haven’t raised formal guidance aggressively, but their commentary and investments imply that they believe they can do better than flat growth.
So are they hitting their targets, and are they organized for future success? I’d say yes — so far. Buckle is showing consistency: sales, margins, digital growth, and store execution are all aligned in a positive direction. It has the capital structure to support scale and withstand pressure. But it’s not without risks: product mix (footwear still weak), macroeconomic pressure (rates, inflation, consumer sentiment), and fashion shifts remain wildcards. If management continues walking the line — executing patiently, keeping costs disciplined, investing in what works — then Buckle isn’t just riding a trend; it could very well become a benchmark in specialty retail for balancing growth with prudence.
If you’re serious about finding high-probability setups, put Buckle (BKE) on your trading radar right now. This stock has the volatility and momentum to generate numerous trading opportunities in the months ahead. But remember: the difference between amateurs and pros isn’t who finds the trade — it’s who manages the money. Protect every position with discipline. Respect risk. Guard your capital like it’s irreplaceable — because it is. And when you do step in, give yourself the edge: use the VantagePoint A.I. Daily Range Forecast to see the expected high and low each day, so you’re never trading blind. That’s how you turn raw opportunity into repeatable success.
It’s not magic.
It’s machine learning.
Disclaimer: THERE IS A HIGH DEGREE OF RISK INVOLVED IN TRADING. IT IS NOT PRUDENT OR ADVISABLE TO MAKE TRADING DECISIONS THAT ARE BEYOND YOUR FINANCIAL MEANS OR INVOLVE TRADING CAPITAL THAT YOU ARE NOT WILLING AND CAPABLE OF LOSING.
VANTAGEPOINT’S MARKETING CAMPAIGNS, OF ANY KIND, DO NOT CONSTITUTE TRADING ADVICE OR AN ENDORSEMENT OR RECOMMENDATION BY VANTAGEPOINT AI OR ANY ASSOCIATED AFFILIATES OF ANY TRADING METHODS, PROGRAMS, SYSTEMS OR ROUTINES. VANTAGEPOINT’S PERSONNEL ARE NOT LICENSED BROKERS OR ADVISORS AND DO NOT OFFER TRADING ADVICE.


