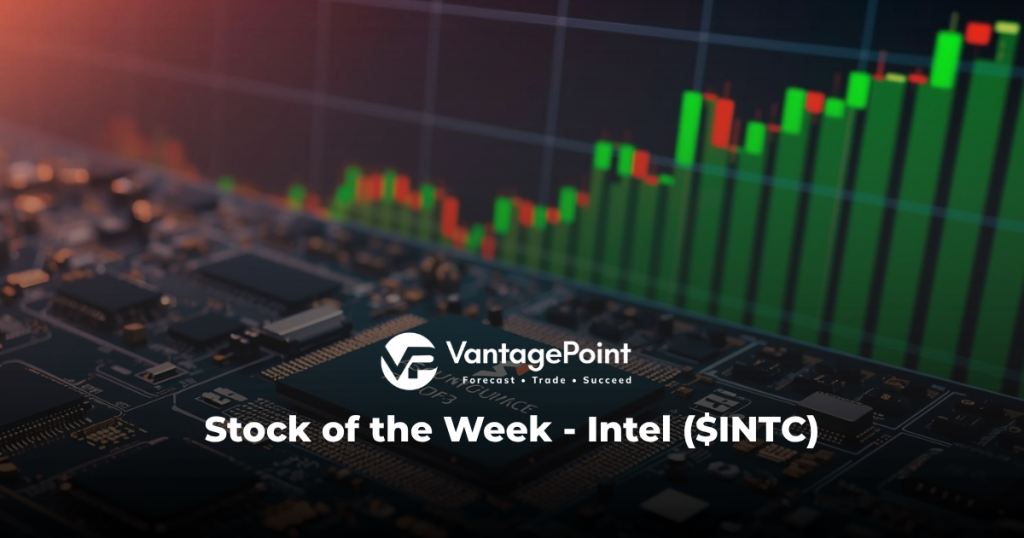


The AI stock spotlight this week is Intel ($INTC)
Intel is one of those companies that feels like it’s been around since the invention of electricity, and for a while it practically was electricity for the tech world. Here’s the quick-and-dirty history, served in five bites instead of a textbook: founded in 1968 by two semiconductor pioneers who wanted to make memory chips and ended up reshaping computing; built its mission around putting brains inside machines so humans could avoid thinking too hard; hit its golden years in the 80s and 90s when “Intel Inside” meant money in the bank; stumbled badly in the 2010s while competitors sprinted ahead; and today sits as a geopolitical chess piece masquerading as a chip company that still matters because the world runs on silicon and somebody has to make it.
Intel makes the tiny electronic brains that power everything from laptops to data centers, but the real story is not what it makes. It is how it makes money and where that money is leaking. The company has historically been a design-and-manufacture powerhouse, meaning it both invents chips and builds them. That used to be like owning both the recipe and the restaurant. Lately it has been more like owning the recipe while your kitchen keeps catching fire.
The business breaks down into a few key segments. The Client Computing Group is the bread-and-butter PC business. It sells processors for desktops and laptops, which is less glamorous than it sounds but still throws off serious cash when the PC cycle cooperates. The Data Center and AI group is where the future is supposed to live. These chips power cloud computing, enterprise servers, and artificial intelligence workloads. That is where the real money is supposed to grow, and also where the fiercest competition lives.
Then there is Intel Foundry, the new experiment. This is Intel trying to become a contract manufacturer for other companies, essentially copying the playbook of Taiwan Semiconductor. If it works, Intel becomes infrastructure. If it fails, it becomes a very expensive science project.
Revenue is driven mostly by PC demand and server demand, with hyperscale cloud players like Amazon, Microsoft, and Google acting as key customers. When those companies spend, Intel eats. When they pause, Intel feels it immediately. The company is headquartered in Santa Clara, California, led by CEO Pat Gelsinger, who returned like a former general trying to rebuild a weakened army. Intel employs well over 100,000 people globally, which is both impressive and expensive.
Competitively, Intel is in a knife fight. AMD has taken meaningful share in CPUs. Nvidia has effectively monopolized the AI acceleration market. Taiwan Semiconductor dominates advanced manufacturing. Intel is trying to fight all three at once, which is a bit like entering a boxing match against three opponents and hoping they politely take turns.
Financially, Intel is a story of transition, and transitions are messy. Revenue has been inconsistent, reflecting weak PC demand and uneven data center growth. Margins, once the envy of the industry, have compressed significantly as Intel spends aggressively to catch up in manufacturing. This is not a company trimming costs. This is a company writing large checks to build factories and reclaim relevance.
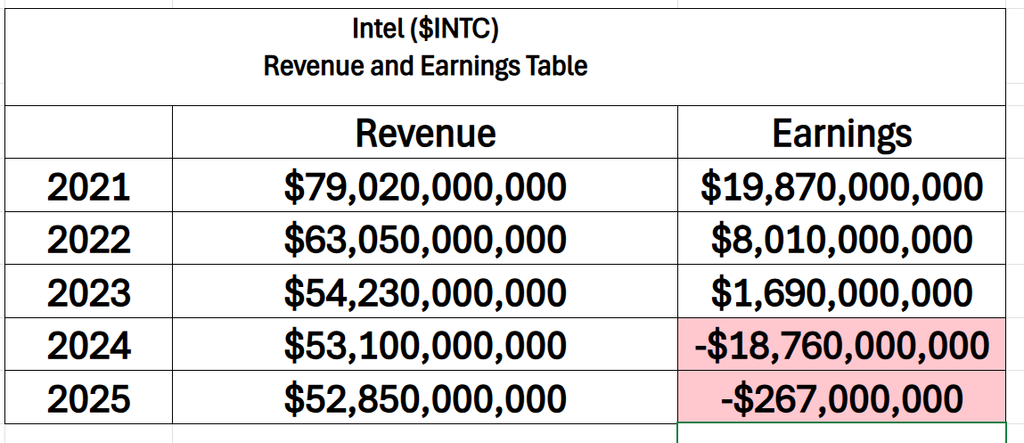
There was a time when Intel’s income statement read like a monument to inevitability. In 2021, nearly $80 billion in revenue and almost $20 billion in earnings suggested a company not just participating in the digital economy, but defining it. What followed looks less like a normal cyclical downturn and more like a structural reset. Revenue has fallen by roughly $27 billion not because the world stopped needing chips, but because Intel lost its grip on where the growth was happening. The personal computer market cooled after a pandemic surge, data center customers diversified away, and the most lucrative segment in modern computing, artificial intelligence, was largely captured by rivals. At the same time, Intel made a deliberate decision to spend aggressively, pouring tens of billions into new manufacturing capacity in an attempt to reclaim technological leadership. In other words, the company chose to trade present-day income for a shot at future relevance.
That decision shows up clearly in the earnings line, which didn’t just shrink, it collapsed into the red. This was not a simple margin squeeze. It was the consequence of a business model under reconstruction. Building semiconductor fabs is one of the most capital-intensive endeavors in the global economy, and Intel is doing it while competing against companies that already have scale advantages. Add in pricing pressure, market share losses in key segments, and the lag between investment and payoff, and the result is a financial profile that looks almost unrecognizable compared to its former self. The market is not confused about what Intel is trying to do. The real question, and the one embedded in these numbers, is whether this is the cost of a comeback or the price of arriving late to a race that has already been decided.
Cash is still there, but it is being deployed aggressively. Capital expenditures are massive because semiconductor fabs cost billions and do not come with a satisfaction guarantee. Debt has risen, not to catastrophic levels, but enough to remind traders that this turnaround is not free.
The capital intensity is the key point most traders misunderstand. Intel is not just selling chips. It is building the factories that build the chips. That means years of upfront investment before returns show up. Traders expecting quick margin expansion are often disappointed because the company is essentially pouring concrete and installing machinery before it sees a payoff.
What traders are asking right now comes down to three questions, and they are not subtle.
First, can Intel actually catch up in manufacturing? The roadmap says yes. History says maybe. The answer matters because manufacturing leadership is the foundation of everything else.
Second, can Intel compete in AI? Right now, Nvidia owns that narrative. Intel is trying to wedge itself into the conversation with new products, but traders are skeptical until they see real adoption and revenue.
Third, will the foundry strategy work? If Intel becomes a major contract manufacturer, it opens an entirely new revenue stream. If not, it risks becoming a very expensive detour.
Recent news flow has been dominated by updates on manufacturing progress, AI chip announcements, and government support. The U.S. government has effectively decided that domestic semiconductor production is a national priority, which means Intel has a political tailwind in the form of subsidies and incentives. That is real and not just a headline.
What is actually new is the acceleration of that support and the continued rollout of Intel’s process technology roadmap. What is already priced in is the idea that Intel is in a turnaround. Nobody thinks this is the old Intel printing money from PCs alone.
What Wall Street may be missing is the timing mismatch. The market tends to price in success early, but the actual financial benefits of these investments could take years. Expectations can run ahead of reality, which creates volatility.
Where expectations could be wrong is in assuming a smooth comeback. Turnarounds are rarely smooth. They look more like a series of stumbles punctuated by occasional bursts of brilliance.
Over the past 90 days, the rally has been driven by a mix of optimism around AI exposure, confidence in the manufacturing roadmap, and broader strength in semiconductor stocks. When the sector moves, laggards often get pulled along, especially if they have a credible comeback story.
Year-to-date, the gains have been supported by improving sentiment rather than explosive financial results. The narrative has shifted from “Intel is broken” to “Intel might be fixable.” That is often enough to move a stock.
Compared to the broader semiconductor ETF, Intel has been more of a catch-up trade than a leader. The sector itself has been buoyed by AI enthusiasm, and Intel has benefited from being adjacent to that theme, even if it is not the main character.
The narratives that helped include AI demand, U.S. semiconductor independence, and the idea of a multi-year turnaround. The data points that actually mattered were updates on process technology, capital investment plans, and any signs of stabilization in core businesses.
Analysts generally support the long-term story, but their track record on Intel has been mixed. They have a habit of projecting clean recoveries in a business that rarely behaves cleanly. When analysts assume execution will be flawless, history suggests caution.
On the opportunity side, there is a real chance Intel pulls this off. If it regains manufacturing leadership and builds a successful foundry business, the upside is substantial. It transforms from a struggling incumbent into a critical piece of global infrastructure.
The biggest upside surprise would be meaningful traction in AI chips. If Intel suddenly starts taking share in that market, the stock does not drift higher. It jumps.
On the risk side, execution is everything. Delays in manufacturing, cost overruns, or weak demand can derail the story quickly. The company is spending enormous sums, and if the returns do not materialize, the market will lose patience.
The single biggest blind spot is timing. Traders often underestimate how long it takes for capital-intensive investments to pay off. This is not a software company flipping a switch. This is heavy industry with long cycles.
Looking ahead, there are a few key catalysts that matter.
Earnings reports are always at the top of the list. They provide updates on revenue trends, margins, and progress on the turnaround. If Intel shows improvement in data center or foundry metrics, the stock reacts.
Product launches and technology milestones are next. Any evidence that Intel is hitting its manufacturing roadmap or delivering competitive AI products can shift sentiment quickly.
Government funding announcements and partnerships also matter. They reinforce the idea that Intel is not just a company but a strategic asset.
In the end, Intel is not for everyone. It is not a clean momentum play like the hottest AI names, and it is not a stable dividend machine like a utility. It sits in the uncomfortable middle, where hope and skepticism wrestle daily.
This is a stock for traders who understand narratives and are willing to bet on a turnaround with a long runway. It rewards patience when things go right and punishes it when they do not.
For the trend to continue, Intel must show steady progress in manufacturing and at least some credible traction in AI and foundry services. The story needs to move from promises to proof.
Early warning signs would include missed milestones, deteriorating margins without a clear payoff, or continued loss of share in key markets. Those are signals that the comeback is stalling.
Intel is trying to climb back to the top of a mountain it used to own. The path is steep, the air is thin, and the competition is already at the summit. Traders just need to decide whether they believe the climber still has the legs
for it.
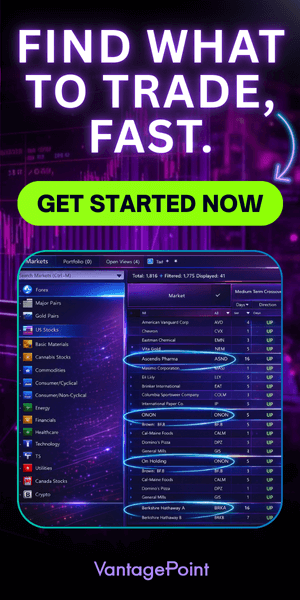
In this weekly stock study, we will look at an analysis of the following indicators and metrics, which serve as our guidelines in determining whether to buy, sell, or stand aside on a particular stock:
Wall Street Analysts Ratings and Forecasts
52 Week High and Low Boundaries
Best-Case/Worst-Case Analysis
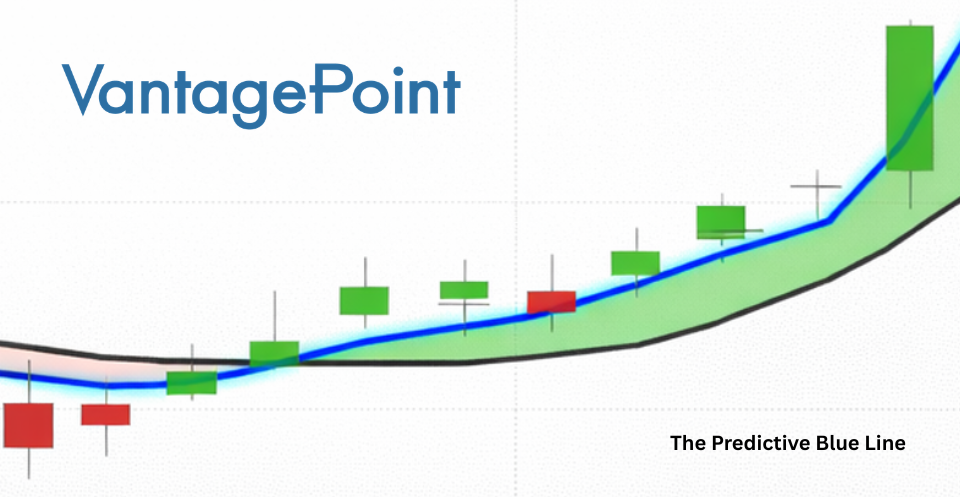
VantagePoint AI Predictive Blue Line
Neural Network Forecast (Machine Learning)
VantagePoint AI Daily Range Forecast
Intermarket Analysis
Our Suggestion
While our decisions are ultimately guided by artificial intelligence forecasts, we still take a brief look at the fundamentals to understand the financial landscape in which $INTC is operating.
Wall Street Analysts Price Forecasts
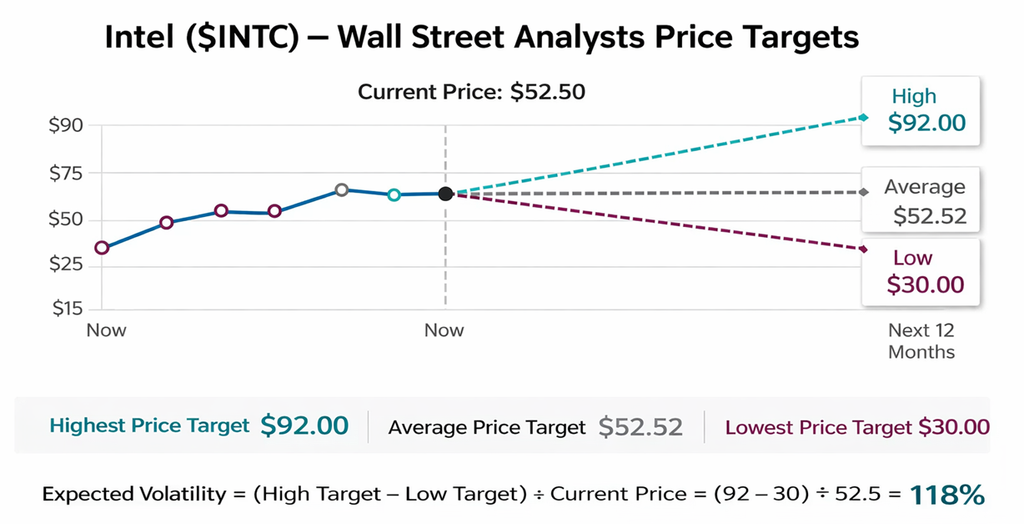
This is a disagreement dressed up as precision. We focus our attention on the variance between the highest price forecast and the lowest. This is the expected volatility moving forward.
A 118% expected volatility range tells you everything you need to know. Wall Street is not aligned. One camp believes Intel is on the verge of a full-scale comeback with manufacturing dominance and AI relevance. Another camp sees a capital-intensive turnaround that could stall under its own weight. When analysts are this far apart, it is not insight. It is uncertainty with a price tag attached.
For traders, this creates opportunity and risk in equal measure. The upside case is massive if Intel executes. A move toward $92 implies a complete re-rating of the business. But the downside to $30 is not theoretical. It reflects real concerns about execution, margins, and competition. This is a wide battlefield, not a narrow trade. Position sizing matters more than conviction.
Here is the part Wall Street tends to get wrong. Analysts often assume smooth progress in messy turnarounds. Intel’s history suggests anything but smooth. The average target sitting right at the current price is the most honest number on the board. It is the market saying, “Show me.” Until Intel proves it can convert spending into sustainable earnings growth, the stock will trade on narrative, not certainty.
52 Week High and Low Boundaries
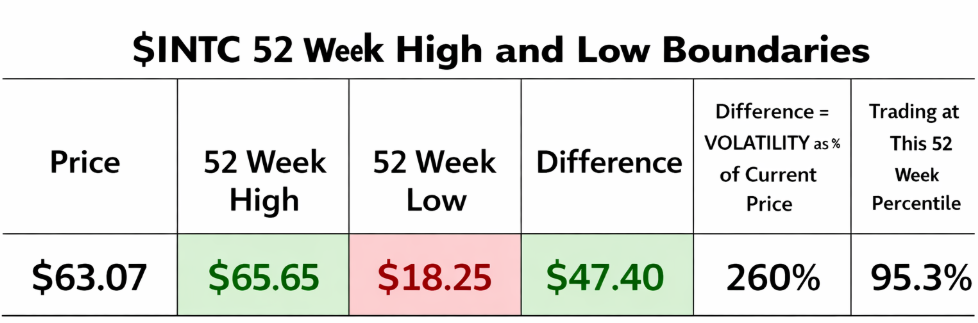
This is not a calm stock. This is a stock that has already proven it can move 260% inside a single year. That is not volatility. That is extreme movement. Intel has gone from a deeply discounted, left-for-dead name to something traders are now chasing near the highs. When a stock shows you that kind of range, it is telling you exactly what it is capable of doing in both directions.
At 95% of its 52-week range, price is sitting right near the ceiling. That means traders are not buying value. They are buying momentum and belief. The market is pricing in improvement, execution, and a comeback story that is still unfolding. You are no longer early. You are participating in a move that is already mature, where expectations are elevated and mistakes get punished faster.
For traders, this is where discipline matters most. The upside can still exist, but the easy money has already been made. Risk is no longer theoretical. It is immediate. If the narrative continues to improve, the stock can grind higher or break out. But if anything cracks, expectations, execution, or sentiment, this positioning leaves very little margin for error. This is no longer a question of whether Intel can move. It is a question of whether you are entering at the right point in the move.
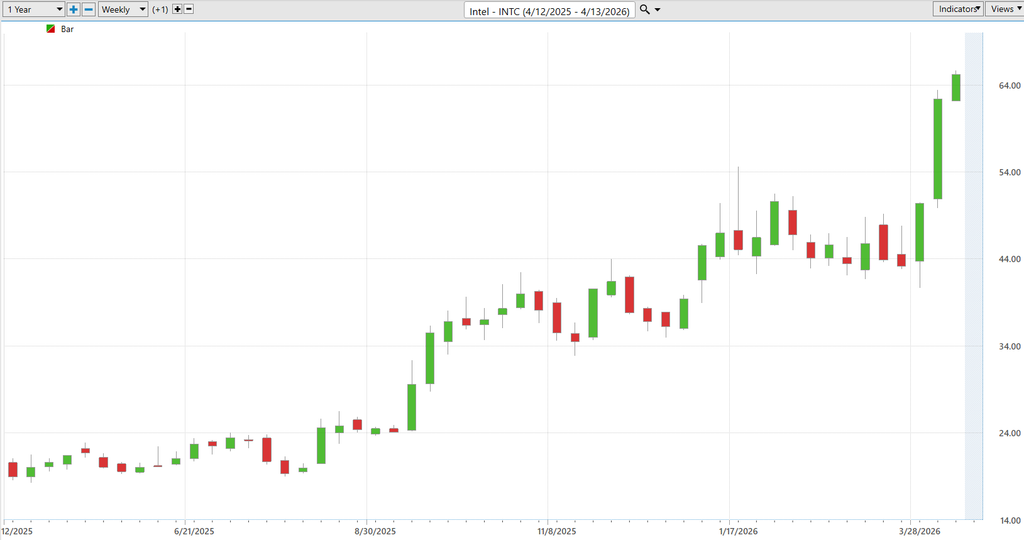
The 52 week chart tells a bold, persuasive story: $INTC has broken decisively out of its range and is advancing with conviction, the kind of move that attracts attention and capital alike. But the 10-year chart introduces a note of caution that a wise trader cannot ignore. This is not the first time Intel has climbed to these levels. In fact, this zone has repeatedly acted as a ceiling, stopping prior advances cold and sending the stock back down with equal force. The implication is clear. While the recent breakout signals strength, the stock is now approaching a level where history suggests sellers may reappear. In advertising, we would call this a moment of maximum promise paired with maximum resistance. The opportunity is real, but so is the risk.
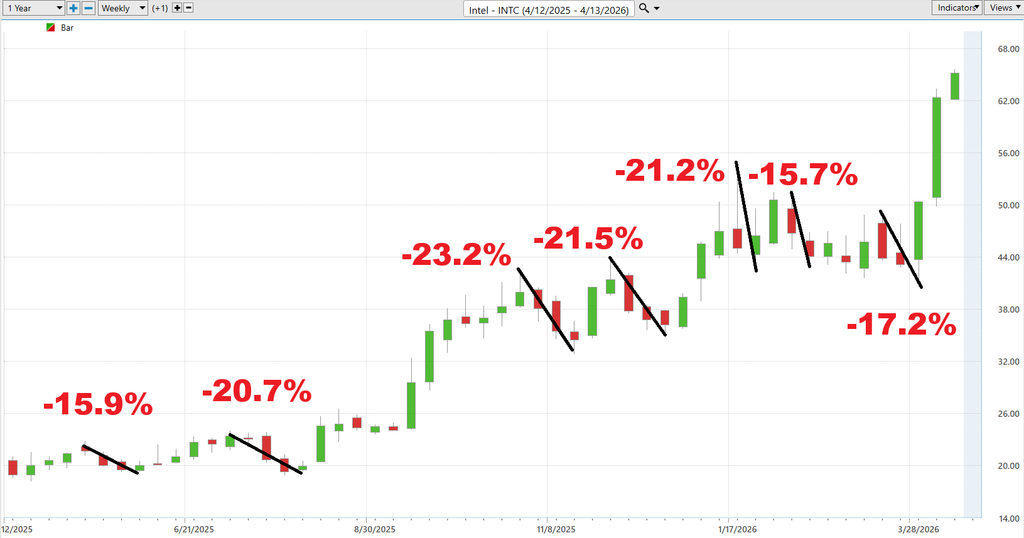
Best-Case/Worst-Case Scenario Analysis
Over the past year, Intel has repeatedly delivered pullbacks in the range of -15% to -23%. These are not rare events. They show up consistently across the chart. The market has a habit of punishing this stock quickly when momentum stalls or expectations wobble. These declines are sharp, fast, and uncomfortable. If you are not prepared for a 20% drawdown, you are not prepared to hold this stock. This is not weakness. This is the cost of admission.
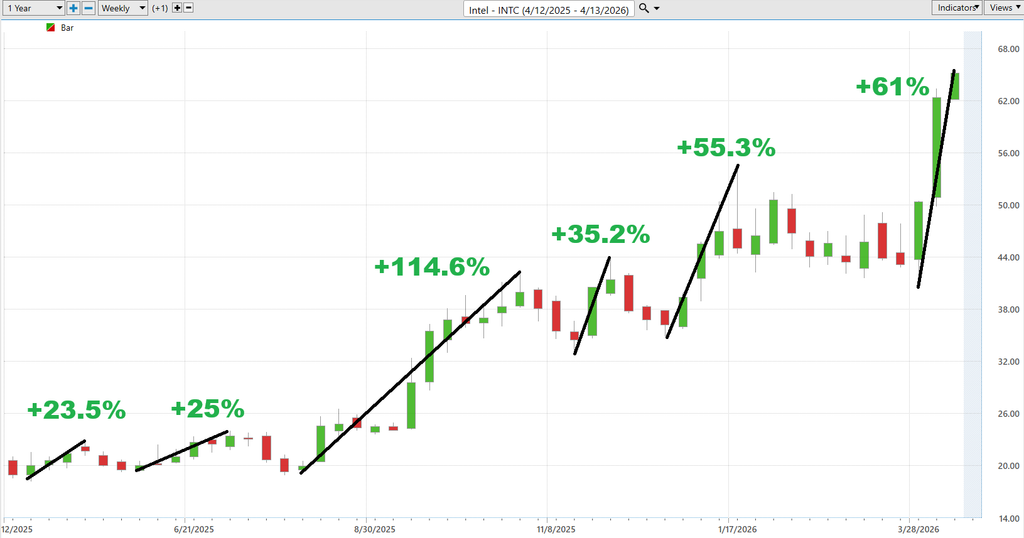
On the flip side, the rallies tell an even louder story. Intel has produced upside moves of +23%, +25%, +35%, +55%, and even +114%. That is not normal. That is explosive behavior. When this stock trends, it does not drift. It moves with authority. The +114% run stands out as a reminder that when sentiment flips and capital flows in, Intel can reprice aggressively and without warning.
Here is what matters for traders.
This is not a smooth trend. This is a volatile staircase. Big advances followed by meaningful pullbacks. The opportunity exists because of that volatility, not in spite of it. The best trades come from understanding that both sides of this behavior are normal. Working through this exercise creates a realistic risk and reward framework moving forward. You now know what the stock is capable of on both sides. Great traders do not guess. They measure. Understanding that Intel can deliver 30% to 60% upside waves while also producing 15% to 23% drawdowns allows for intelligent position sizing and disciplined decision-making before entering the trade.
If you are chasing strength near the highs, you must respect the historical reality that a 15% to 23% pullback can happen at any time. That is not a prediction. That is a pattern.
At the same time, if the trend continues and Intel stays in favor, the upside is not capped at single-digit gains. History shows that 30% to 50% upside waves are entirely possible, with occasional outlier moves far beyond that.
Next we compare $INTC to the broader stock market averages.
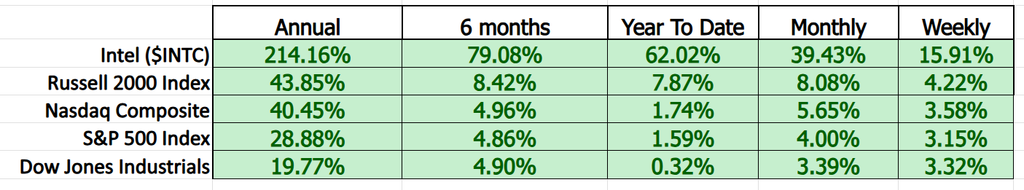
Intel is not just outperforming. It is separating itself from the field in a way that demands attention. Over the past year, Intel has delivered a +214% return, while the closest benchmark, the Russell 2000, sits at just +43%. The Nasdaq Composite is at +40%, the S&P 500 at +28%, and the Dow at +19%. That is not a small edge. That is dominance. When a stock is outperforming every major index by that magnitude, it is not noise. It is leadership.
That leadership is not confined to one timeframe. Over the past six months, Intel is up +79% while every major index remains in the single digits. Year to date, Intel has gained +62%, while the S&P 500 and Nasdaq are barely positive. Even at the monthly and weekly levels, Intel continues to lead with +39% over the past month and +15.9% over the past week, consistently outpacing every benchmark. This is not a one-time surge. This is persistent relative strength across all timeframes.
For traders, this simplifies the decision-making process. You are not looking at a stock that is keeping pace with the market. You are looking at a stock that is outperforming it across the board. That tells you where capital is flowing. It tells you what institutions are accumulating. The only real question is not whether Intel is strong. The data makes that clear. The question is whether you are aligned with that strength or fighting against it.
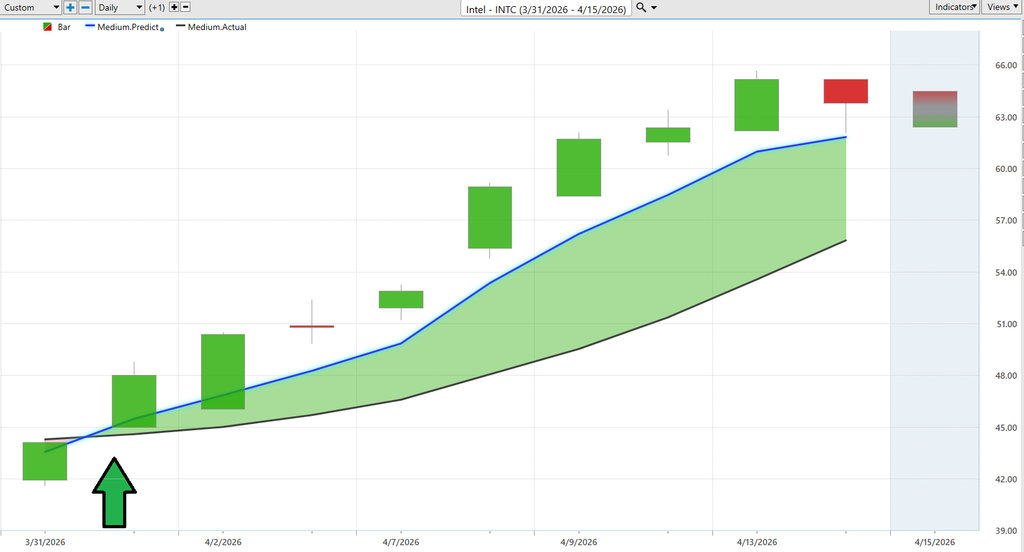
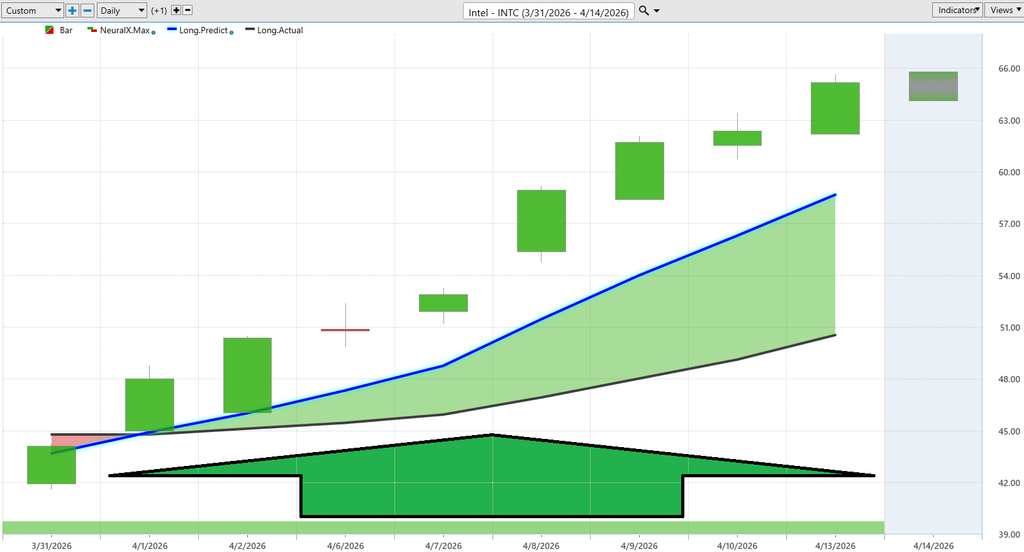
VantagePoint AI Predictive Blue Line
There is a subtle but important shift happening beneath the surface of Intel’s recent price action, and it is not coming from the headlines. It is coming from the slope of the predictive blue line. Over this short window, the blue line has turned decisively higher and remains above the actual price baseline, creating a widening gap that suggests forward expectations are improving faster than the market has fully priced in. This is not just a trend. It is a signal that the underlying data driving the forecast is strengthening, and in this framework, slope is the GPS.
What stands out is the consistency. The predictive blue line is not spiking erratically. It is rising in a controlled, persistent fashion, while the actual price follows behind it. That separation, with price lagging but moving in the same direction, defines what traders would recognize as a value zone. It is the space where pullbacks tend to find support because the forecasted trend remains intact. In practical terms, it suggests that weakness is being absorbed rather than accelerating, and that buyers are stepping in at increasingly higher levels.
The real takeaway is not just that Intel is moving higher. It is how it is moving higher. When the predictive blue line leads and price follows, it creates a framework where traders are not reacting to price alone but positioning around expectation. As long as that slope continues upward and the relationship between the two lines remains intact, the trend remains constructive. The moment that relationship compresses or reverses, that is when the signal changes. Until then, the data is pointing in one direction, and the market, for now, appears to be following it.
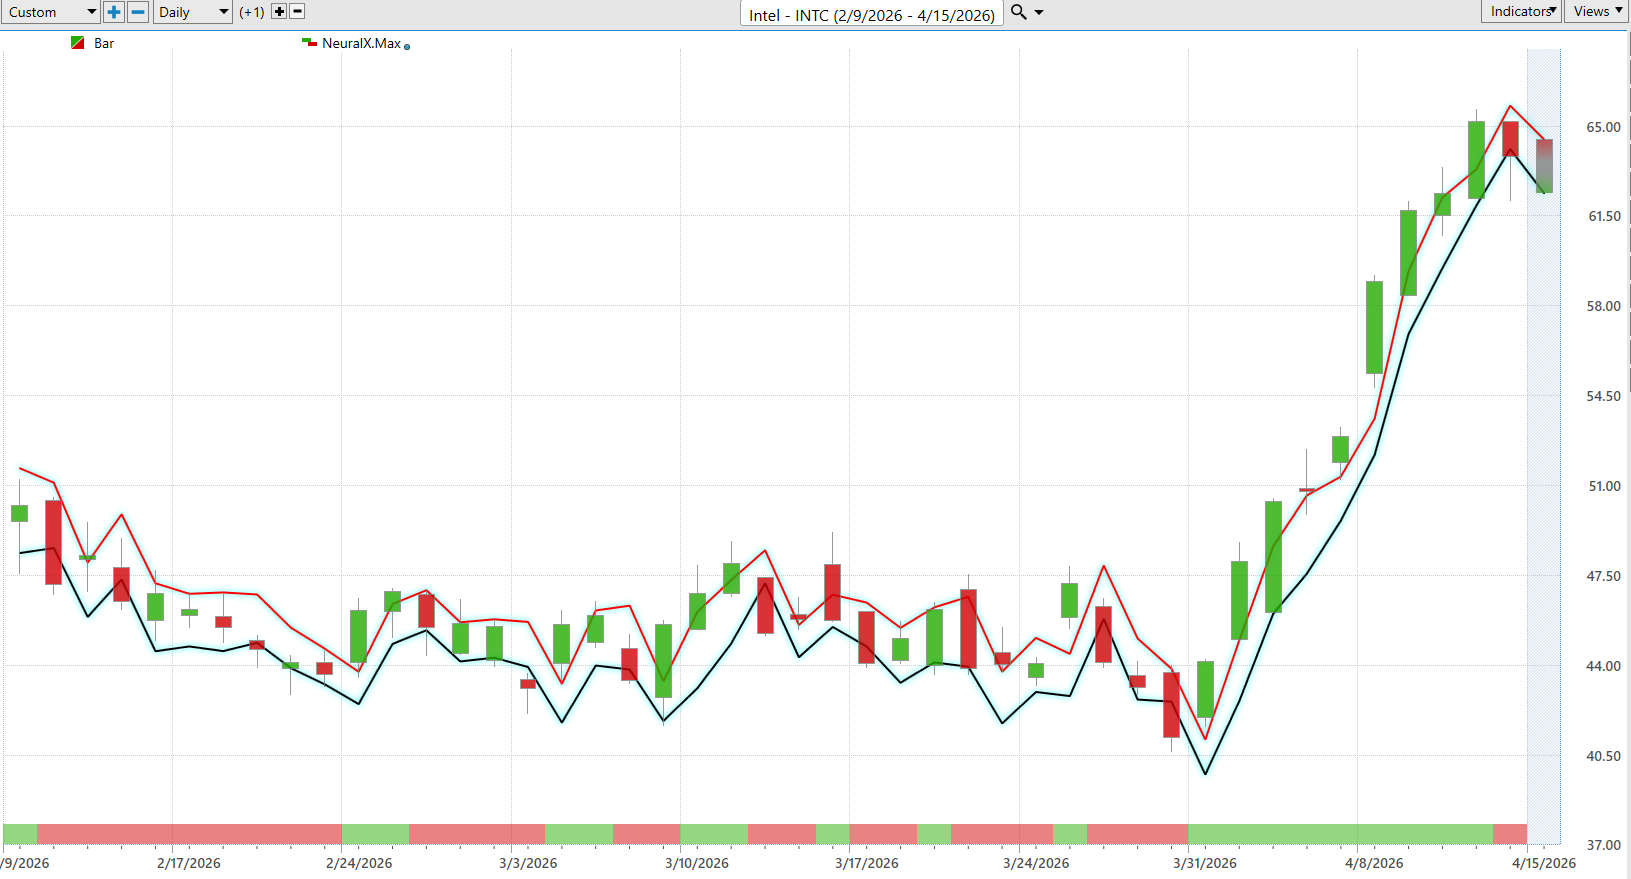
VantagePoint AI Neural Index (Machine Learning)
What stands out immediately is not just the strength in Intel’s price action, but the consistency of the signal underneath it. The Neural Index has remained firmly positive throughout this stretch, aligning with the steady advance in price. This matters because the Neural Index is not reacting to what has already happened. It is attempting to forecast the next 48 to 72 hours. When that signal stays positive during an uptrend, it suggests that short-term strength is not being exhausted. It is being reinforced.
There are no meaningful periods of sustained weakness in the signal. You do not see prolonged flips to red or hesitation that would typically precede a pullback. Instead, the pattern reflects continuation. That alignment between the Neural Index and the rising price structure creates what traders would recognize as a high-probability environment. It is not just that the stock is moving higher. It is that the forward-looking signal is confirming that move in real time.
The implication is straightforward. As long as the Neural Index remains positive, the path of least resistance stays higher. The first sign of trouble will not come from price alone. It will come from a shift in that short-term forecast, where the Neural Index begins to turn negative and stays there. Until that happens, the signal suggests that momentum remains intact and that pullbacks, if they occur, are more likely to be pauses within a continuing trend rather than the start of a reversal.
VantagePoint AI Daily Range Forecast
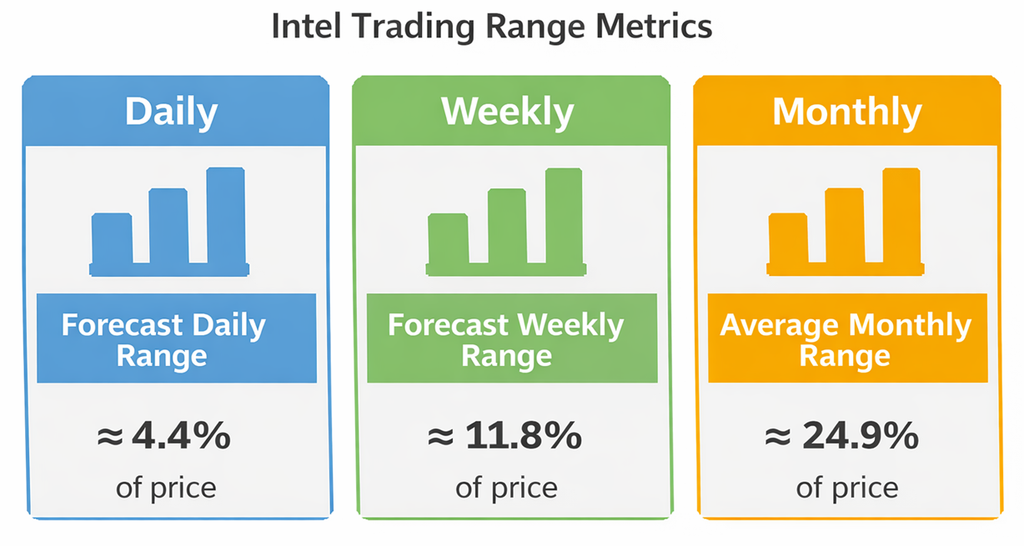
Volatility is the price of admission if you are planning on trading this stock. The graphic lays it out clearly. Intel is operating with an expected daily range of 4.4%, a weekly range of 11.8%, and a monthly range of 24.9% of price. What all traders need and want is a guidance system like a GPS that provides the exact coordinates of what is expected the following trading day. This is what the VantagePoint A.I. Daily Range Forecast delivers.
What traders often lack is not information, but a framework. Volatility, in its raw form, is everywhere. It is quoted, modeled, debated. But in real time, it remains frustratingly difficult to apply. What traders actually need is something closer to a navigation system, a volatility GPS that translates potential into expectation. That is where the VantagePoint AI daily range forecast becomes relevant. It takes what would otherwise be a broad, abstract measure of movement and converts it into a forward-looking map, one that outlines where price is likely to travel within a given session.
Look more closely at how price behaves around those forecast ranges and a pattern begins to take shape. Movement is not as random as it first appears. Price tends to operate within those boundaries, oscillating between them while still respecting the underlying trend. This is where more experienced traders begin to distinguish themselves. They are not trying to predict every tick. They are identifying, in advance, where opportunity and risk are likely to emerge. In that sense, the daily range forecast does something subtle but important. It reframes volatility, not as something to fear or react to, but as a structure that can be understood and, with discipline, used.
Intermarket Analysis
You already use intermarket analysis. You just hadn’t packaged it into a repeatable system. Now you have. This is your framework for answering the only question that matters: what is actually moving the stock?
Intermarket analysis is simple. No stock moves alone. It sits in the middle of a network. Indexes, sector ETFs, interest rates, currencies, commodities. The graphic is your map. It shows you the connections so you can stop guessing and start seeing.
Not all drivers matter equally. Equities and sector strength come first. That is where capital flows. Bonds and interest rates come next. They control the cost of money. Then come currencies and commodities. They shape margins and global demand. This is the order of influence.
When you put it together, the picture becomes clear. The stock is reacting, not acting. Price is the result of pressure from multiple directions. Your job is to read that pressure before it shows up in the chart. That is the edge.You already use intermarket analysis. You just hadn’t packaged it into a repeatable system. Now you have. This is your framework for answering the only question that matters: what is actually moving the stock?
Intermarket analysis is simple. No stock moves alone. It sits in the middle of a network. Indexes, sector ETFs, interest rates, currencies, commodities. The graphic is your map. It shows you the connections so you can stop guessing and start seeing.
Not all drivers matter equally. Equities and sector strength come first. That is where capital flows. Bonds and interest rates come next. They control the cost of money. Then come currencies and commodities. They shape margins and global demand. This is the order of influence.
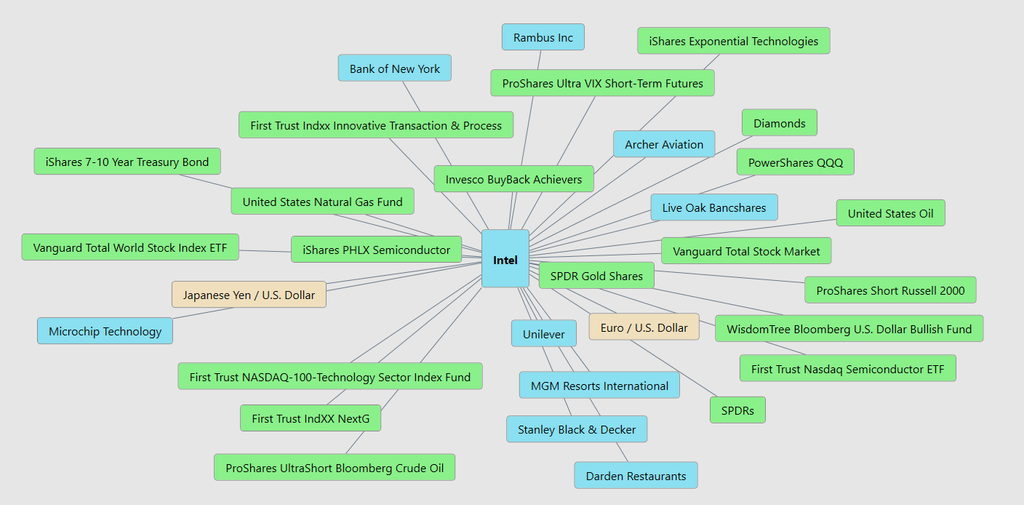
When you put it together, the picture becomes clear. The stock is reacting, not acting. Price is the result of pressure from multiple directions. Your job is to read that pressure before it shows up in the chart. That is the edge.
Our Suggestion
Intel’s last two earnings calls tell a simple story. Management is still in turnaround mode, but they are executing better than they were a year ago. They are hitting some of their objectives, especially around stabilizing the core business and moving forward with their foundry strategy. It is not perfect, but it is progress. The tone has shifted from defensive to cautiously constructive.
Confidence is there, but it is measured. Leadership is not pounding the table. They are signaling that the plan is working, but it will take time. You can hear it in how they talk about manufacturing, AI positioning, and partnerships. They believe they are back in the game, but they are not claiming victory.
They are very aware of the risks. Execution risk is still front and center. Building fabs, competing with entrenched players, and catching up in process technology is not easy. They also acknowledge the cyclical nature of semiconductors. Demand can turn quickly, and inventory cycles can still create pressure. This is not a blind optimism story.
What is driving the current trend is belief. Not perfection. The market is responding to improvement, not completion. AI demand, data center recovery, and the idea that Intel can become a major foundry player again are pulling capital into the stock. The trend is being driven by rising expectations. The key question is whether execution can keep up with that belief.
The next earnings call for $INTC is expected on April 23, 2026, after the market close.
Expectations are modest, and that’s the key point. Analysts are looking for a slight loss or near break-even performance, which tells you the market is not expecting perfection. The focus is not on headline numbers. It is on whether the turnaround continues to show progress.
What matters more is the narrative going into the call. Intel is coming in with momentum. AI demand, data center strength, and recent partnerships are driving optimism. At the same time, there is still skepticism about how fast Intel can convert that demand into consistent profitability.
So the setup is clear. Expectations are low enough to be beatable, but the bar for confidence is higher. The market is not asking, “Did they hit the quarter?” It is asking, “Is the turnaround real and sustainable?”
For traders, the message here is refreshingly simple. This is a company that knows where the gold is buried and also knows where the landmines are. That makes it interesting. It also makes it dangerous. And after the kind of run Intel just had, charging in now without a plan is less “strategic trading” and more “running with scissors.”
So keep $INTC on your radar, but don’t fall in love with it. This thing moves. That’s the whole appeal. Volatility is not a bug, it’s the feature. Use the daily range forecast like a road map instead of guessing which way the wind is blowing. If you’re going to play the game, at least know the size of the field.
And for heaven’s sake, practice money management. Not the kind you promise yourself after a bad trade, the kind you actually use before one. Position size like you plan to survive. Because in a stock like this, survival is what earns you the right to come back tomorrow.
Let’s be careful out there.
It’s not magic.
It’s machine learning.
Disclaimer: THERE IS A HIGH DEGREE OF RISK INVOLVED IN TRADING. IT IS NOT PRUDENT OR ADVISABLE TO MAKE TRADING DECISIONS THAT ARE BEYOND YOUR FINANCIAL MEANS OR INVOLVE TRADING CAPITAL THAT YOU ARE NOT WILLING AND CAPABLE OF LOSING.
VANTAGEPOINT’S MARKETING CAMPAIGNS, OF ANY KIND, DO NOT CONSTITUTE TRADING ADVICE OR AN ENDORSEMENT OR RECOMMENDATION BY VANTAGEPOINT AI OR ANY ASSOCIATED AFFILIATES OF ANY TRADING METHODS, PROGRAMS, SYSTEMS OR ROUTINES. VANTAGEPOINT’S PERSONNEL ARE NOT LICENSED BROKERS OR ADVISORS AND DO NOT OFFER TRADING ADVICE.