


The Current Status of Lumber
Chances are you’ve heard that over the past year Lumber prices have skyrocketed. The housing markets nationally are booming and the demand for lumber is outpacing what the sawmills are capable of providing.
How has this occurred?
The economic shutdown which occurred in 2020 completely decimated lumber harvesting. While a large section of the economy could work their jobs remotely, the lumber industry has to be in the forests harvesting timber for supply to exist and come to market. Since that did not occur during 2020 a giant supply-demand imbalance was created by economic shutdown and the end result is much higher prices.
Lumber tariffs had prices already rising a year ago, but then when the pandemic hit, production completely stopped. The expectation was that housing demand would dry up. But instead, after a brief pause, it came roaring back. The low-interest rate, easy money environment has the real estate market booming and this super trend caught homebuilders and lumber producers off guard. The lumber industry is struggling to ramp up supply as exploding demand is clashing with limited production, resulting in giant price hikes and an overall shortage.
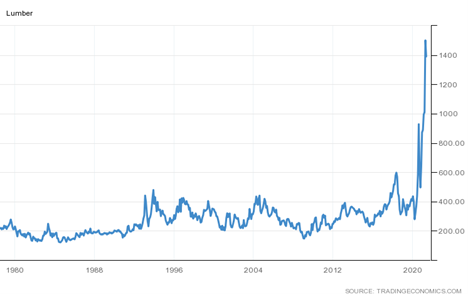
Monthly Lumber Prices 1978 to 2021
The stock market has more than doubled from the COVID-19 low in late March 2020, but lumber prices have more than quadrupled during the same time frame. While most stock investors don’t pay close attention to them, commodity prices do influence the share prices of natural resource companies. And one commodity that has been making headline news lately is lumber.
Overall, lumber doesn’t get much attention because the business is pretty straightforward. The industry grows trees until they are mature, then harvest them and cut them down into basic materials for building and consumer products. The recent price move in lumber is a classic textbook example of a supply and demand imbalance. Add to this imbalance trade tensions with Canada, a major lumber producer, resulting in higher duties and tariffs you can quickly understand why supply has become so limited.
Wood woes for 2021 continue as suppliers confront the harsh volatility of massive price increases. Producers are increasing supplies to the market which should result in normalized pricing over the next 18 months. Rising prices of lumber is keeping many customers from completing projects. Things like homes and sheds are being delayed because customers can’t afford the materials to complete them. The average price has increased $36,000 on an average American new home due to the supply and demand imbalance of lumber used to build that home.
What impact will expensive lumber have?
For traders who are risk-tolerant looking at lumber futures is one alternative, but it is considered high risk. Futures are highly leveraged instruments where you put up a good faith deposit of around 20% of the contracts value to control 100% of a lumber quantity. The lumber futures contract size of 110,000 board feet is roughly equivalent to a single railcar or nearly 5 truckloads. Margin requirements to trade lumber futures contracts are roughly $3,000 per contract.
Alternatives in the wood products industry are lumber companies like Weyerhaeuser (NYSE:WY), Louisiana-Pacific (NYSE:LPX), and Rayonier (NYSE:RYN). These shares have generally pressed higher over the past several months, as higher lumber prices have boosted their prospects for outsized profits over the shorter term.
Let’s start our analysis with the commonsense metrics. Over the last 52 weeks, Lumber has traded as high as $1733.50 and as low as $346.10. This tells us that the annual trading range has been $1387.40. The average weekly trading range is $26.68.
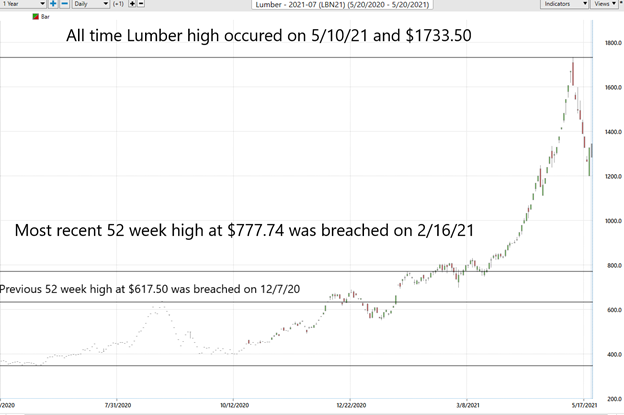
When we study the charts, we start by analyzing where the market is in relationship to its 52-week high and low. Experience tells us that assets which successfully breach their 52-week highs on strong momentum tend to move higher, and vice-versa. The following 1-year Lumber chart shows the most recent 52 week high and low boundaries.
What is fascinating about the chart is the breach of the most recent 52 week high at 777.74 on 2/16/21. This was the highest lumber price in the history of the Lumber futures contract going back to the 1970’s on the Chicago Mercantile Exchange.
In trading when an asset breaks out to new all-time highs it clearly points out that something truly unusual has occurred. It might be a supply/demand imbalance or industry disruption. We pay attention to this metric on an annual basis, but we also caution traders to look at the charts from a much larger time frame because while these moves are rare, they are immensely powerful and profitable when they do occur.
While we do not create a valuation based upon fundamental factors, we study them to understand the financial landscape that the company is operating under. There is tremendous power in being aware of an asset when it is trading at 52-week highs. At these points we pay particularly close attention to the Vantagepoint A.I. forecast.
VantagePoint’s A.I. Analysis
Whenever we look at an asset forecast, we always are comparing what the stock has done, to the artificial intelligence, which is computing its forecast based upon a proprietary intermarket analysis of the most closely correlated assets as well as a neural network computation.
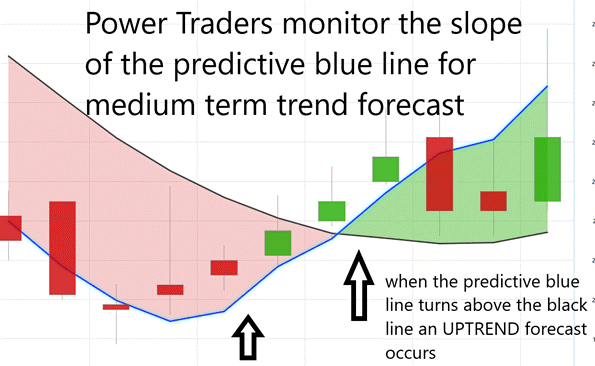
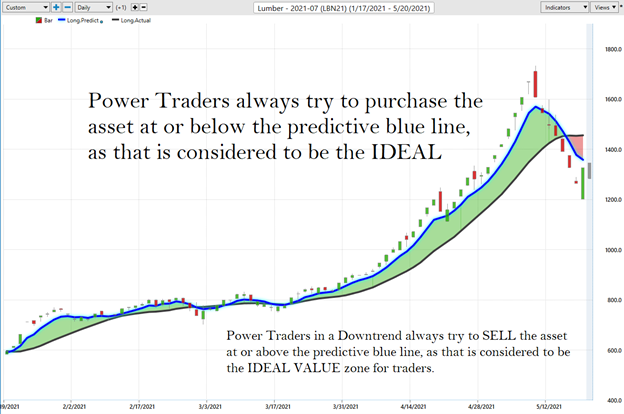
The key to the VantagePoint analysis is the predictive blue line. The slope and general direction of the blue line determines the medium forecast for the market.
The Vantagepoint Software has three separate modules which create a forecast for a Power Trader. They are the predictive blue line, the Neural Net, and the Intermarket Analysis.
The predictive blue line also acts as value zone where in uptrends traders try to purchase the asset at or below the blue line. Power traders use the predictive blue line in helping to determine both the value zone as well as the trend direction.
The black line that you see that is a regular simple 10 period moving average.It’s a good measure of where market prices have been over a given period of time. But as traders we really need to understand is where our market price is moving going forward.
So, we compare that black line value on the chart to the predictive blue line, which is actually VantagePoint’s predictive indicator. VantagePoint performs what’s called intermarket analysis. That means there are known relationships as far as those neural networks are concerned that affect and drive the future price of lumber. That could be markets like the major lumber suppliers or the Russell 2000 or things like global currencies or global interest rates, or futures and commodity markets.
To understand and appreciate how powerful this indicator is, let me show it to you without any of the daily price bars on the chart.
- The slope of the predictive blue line determines the short-term trend. On the following graphic, monitor that you would want to buy when the slope of the blue line is going up.
- When the slope of the blue line is going sideways you would be anticipating sideways prices.
- Likewise, when the slope of the blue line is going down you would be anticipating lower prices.
Observe “when” the SLOPE of the predictive blue line started moving higher and how price behaved.
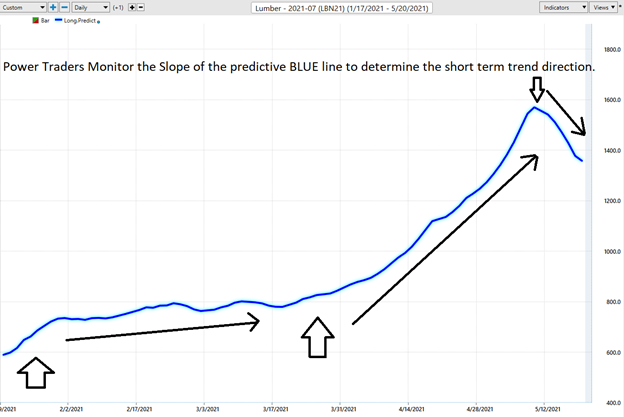
Here is the same chart with the accompanying daily price bars. As you look through this chart study how:
- Power Traders always try to purchase the asset at or below the predictive blue line, as that is considered to be the IDEAL VALUE zone for traders.
- Power Traders always try to SELL the asset at or above the predictive blue line, as that is considered to be the IDEAL VALUE zone for traders.
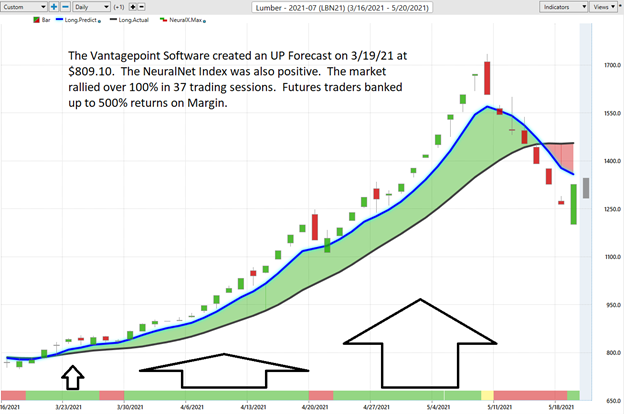
At the bottom of the chart is the Neural Network Indicator which predicts future short-term strength and/or weakness in the market. When the Neural Net Indicator is green it communicates strength. When the Neural Net is Red it is forecasting short term weakness in the market.
We advocate that Power Traders cross reference the chart with the predictive blue line and neural network indicator to create optimal entry and exit points.
Power Traders are always looking to apply both the neural network and A.I. to the markets to find statistically sound trading opportunities.
Power Traders have had multiple opportunities to exploit nice gains in Lumber by monitoring the artificial intelligence forecasts. Over a period of 37 trading sessions prices increased over 100%.
Fine Tuning Entries and Exits
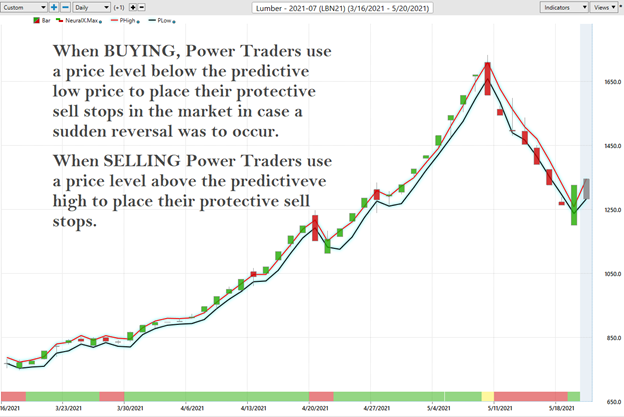
One of the powerful features in the VantagepPoint Software which Power Traders use on a daily basis is the Price Range prediction forecast.
This forecast is what permits Power Traders to truly fine tune their entries and exits into the market.
At 6:30pm after the market close the software updates and all of the price predictions change based upon what the machine learning, A.I., neural networks, and intermarket analysis anticipate moving forward.
Here is the price chart of Lumber during the most recent runup featuring the Daily Price Range forecast with the NeuralNet Index at the bottom of the chart. Day traders who are looking for short term swings in the markets focus on the daily price ranges to place their entry and exit orders.
By utilizing both of these tools simultaneously Power Traders can locate precision entries and exits with high probabilities of success and are capable of exploiting short term swing trading opportunities.
Traders can use these Vantagepoint tools either independently or together to find great trading opportunities. This is the power at your fingertips when you use artificial intelligence to do your trend analysis. The slopes of the price channels above clearly delineate the trends.
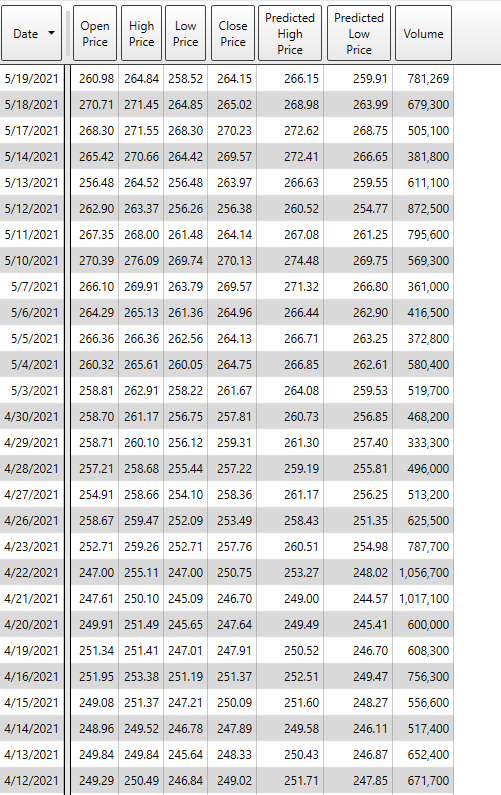
The Vantagepoint software also allows this information to be generated in a tabular format.
Intermarket Analysis
We live in a global marketplace. Everything is interconnected. The billion-dollar question for traders is always what are the key drivers of price for the underlying asset that I am trading?
What makes VantagePoint unique and distinct when compared to all other analytical tools is its patented and proprietary intermarket analysis.
Intermarket analysis is a method of analyzing markets by examining the correlations between different asset classes. In other words, what happens in one market could, and probably does, affect other markets, so a study of the relationship(s) is often very helpful to a trader.
There is great value to be had in studying and understanding the key drivers of Lumbers price action. Please note that in the attached graphic are all three of the major companies mentioned earlier in this report. Rayonier, Weyerhaeuser, and Lousiana Pacific. All of these companies are affected greatly in terms of harvest, shipping, or supplying the underlying lumber asset to their customers.
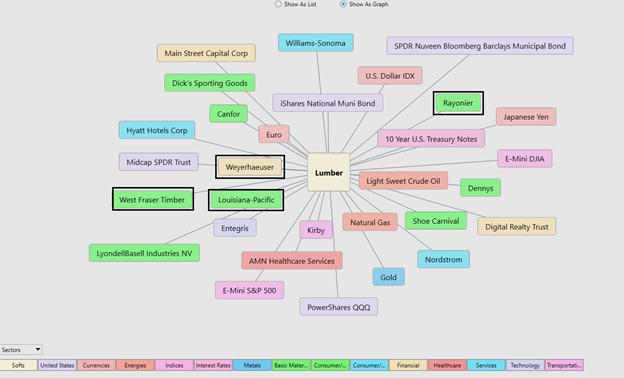
Small changes in Interest rates, Crude Oil Prices, and the Volatility of the dollar amongst thousands of other variables affect the decisions companies must make to survive in these very challenging times. Trying to determine what these factors are is one of the huge problems facing investors and traders.
There is great value to be had in studying and understanding the key drivers of Lumbers price action. universe and the most statistically correlated assets. These factors are all displayed from a standpoint of statistical correlations which show the strongest interconnectedness of prices.
Instead of looking at financial markets or asset classes on an individual basis, intermarket analysis looks at several strongly correlated markets, or asset classes, such as other stocks, currencies, ETF’s, and commodities. This type of analysis expands on simply looking at each individual market or asset in isolation by also looking at other markets or assets that have a strong relationship to the market or asset being considered. The VantagePoint software analyzes the top 31 drivers of an assets price. This analysis will often show ETF’s which are big owners of the underlying asset, but it will also uncover other markets which are statistically correlated to the trend you are analyzing. Traders often find other blossoming opportunities when engaging in Intermarket Analysis.
Our Suggestion
Lumber has temporarily peaked but there are still huge supply and demand balances based upon the economic shutdown. As lumber producers come back online and start harvesting their timberlands more supply will allow an equilibrium in prices to be created. However, this could easily take 12 to 18 months to accomplish and in the interim we will see huge spikes in volatility in Lumber and the top lumber producing companies.
We approach our analysis not from a fundamental valuation perspective but from a pure trader’s viewpoint.
We have had it on our radar many times over the past year and will continue to monitor it for solid trading opportunities. Currently the trend is down and on sharper rallies the A.I. will advise us to look for selling opportunities above the predictive blue line.
Our stock suggestion – Follow the A.I. trend analysis and practice good money management on all of your trades. Lumber has proven over and over again to be a good candidate for short-term swing trading opportunities.

As more and more lumber comes to the market, we think there is great value in the shipping, rail, and transportation companies which benefit from more supplies coming to the marketplace. One of our favorite stocks in this regard is Old Dominion (ODFL). A chart of Old Dominion is below. Over the last 71 days, it is up 26.87% or $56.20 per share. We expect the current uptrend to close shortly but we will have ODFL on our radar and look for buying opportunities at lower levels when the A.I. forecasts. Many rail, shipping, and transportation companies are trading at ten-year highs indicating that moving scarce products to market is a valuable activity that companies will pay a premium for.
Let’s Be Careful Out There!
Remember, It’s Not Magic.
It’s Machine Learning.
Disclaimer: THERE IS A HIGH DEGREE OF RISK INVOLVED IN TRADING. IT IS NOT PRUDENT OR ADVISABLE TO MAKE TRADING DECISIONS THAT ARE BEYOND YOUR FINANCIAL MEANS OR INVOLVE TRADING CAPITAL THAT YOU ARE NOT WILLING AND CAPABLE OF LOSING.
VANTAGEPOINT’S MARKETING CAMPAIGNS, OF ANY KIND, DO NOT CONSTITUTE TRADING ADVICE OR AN ENDORSEMENT OR RECOMMENDATION BY VANTAGEPOINT AI OR ANY ASSOCIATED AFFILIATES OF ANY TRADING METHODS, PROGRAMS, SYSTEMS OR ROUTINES. VANTAGEPOINT’S PERSONNEL ARE NOT LICENSED BROKERS OR ADVISORS AND DO NOT OFFER TRADING ADVICE.

