
This week’s stock analysis is MODERNA (MRNA).
In January 2021, we posted our first weekly stock study of Moderna. You can find it here.
Over the past several weeks MRNA has received a tremendous boost as it will be added to the S&P 500 Index. This acknowledgment from the financial community has added a lot of enthusiasm to Moderna’s long term prospects.
In this weekly stock study, we will look at and analyze the following indicators and metrics which are our guidelines which dictate our behavior in deciding whether to buy, sell, or stand aside on a particular stock.
- Wall Street Analysts’ Estimates
- 52-week high and low boundaries
- Vantagepoint A.I. Forecast (Predictive Blue Line)
- Neural Network Forecast
- Daily Range Forecast
- Intermarket Analysis
- Our trading suggestion
We don’t base our trading decisions on things like earnings or fundamental cash flow valuations. However, we do look at them to better understand the financial landscape that a company is operating under.
Wall Street Analysts’ Estimates of MRNA
The 13 analysts offering 12-month price forecasts for Moderna Inc have a median target of $194.00, with a high estimate of $299.00 and a low estimate of $83.00. The median estimate represents a -35.52% decrease from the last price of $300.88. The current consensus among 18 polled investment analysts is to buy stock in Moderna Inc. This rating has held steady since June, when it was unchanged from a buy rating.
Up until the last quarter the company has not been profitable, but its balance sheet has been gradually improving. In 2020, Moderna reported a loss of $1.96 per share on $803 million in sales. Sales soared, but losses deepened. For the current quarter MRNA is reporting $5.96 earnings per share on sales of $4.2 billion. In 2021, analysts expect MRNA to earn roughly $26.20 per share on $18.8 billion in total sales. Should this occur, it would swing earnings from large losses a year ago to a company finally being profitable and viable. Likewise, sales would then soar by a quadruple-digit percentage.
The argument in favor of buying MRNA today is that its future revenue from vaccine sales will likely be even larger than today’s. Should additional booster shots be needed to address the different COVID-19 variants. At the present time, it is uncertain whether the market has fully priced into Moderna’s valuation the future sales of booster shots. If “no boosters are needed,” it likely would not threaten the stock price very much, as it doesn’t imply any major revenue changes from what is currently anticipated.
There is no way in advance to predict the regulators’ behavior, so we focus on short term swing trading opportunities in MRNA as its volatility is exactly what a Power Trader is looking for.
52-Week High and Low Boundaries
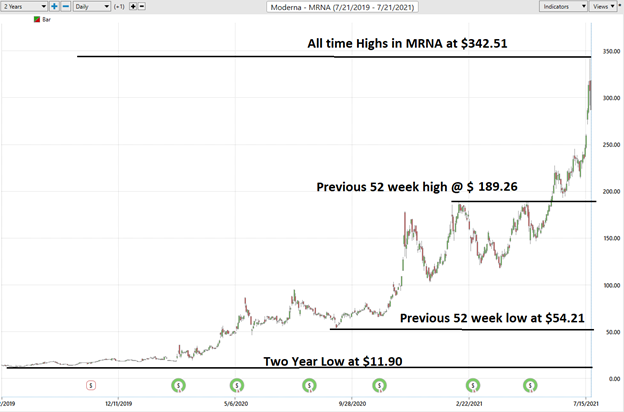
Looking at the Two-Year Long-Term chart of MRNA is very instructive. We can see over a two-year time frame it has traded as low as $11.90 and as high as $342.51. Over the last two years the average weekly trading range of MRNA is $3.18. This metric is just a baseline number that we want to be aware of when looking to exploit a trend. Naturally using the artificial intelligence, we look to amplify that value greatly whenever we trade the underlying asset for whatever time frame we are in the market.
Any trader who invested $10,000 in Moderna two years ago would be sitting on over $222,300 worth of open profits today.
When we last reported on MRNA in January we expected the 52-week high at $189.26 to provide continued resistance to the market. That price level acted as solid resistance to the market for the next 5 months. We urged VantagePoint Power Traders to follow the A.I. forecast daily as MRNA had proven to be a very volatile asset. Observe that when the 52-week high was successfully breached in on June 3, 2021, how quickly the market accelerated to current levels of around $300 per share.
We quote from the January 2021 Stock Study on MRNA:
“We emphasize the 52-week high as a price level all traders should be very aware of when choosing market selection and deciding on a trading strategy. When we zoom out on Moderna we can very quickly see, what we expect to see, whenever price approached its 52-week high level. At first the area acted as very solid resistance. But when the level is successfully breached, which occurred in early April 2020, the stock exploded higher and has never returned to those levels. On Wall Street, the adage is buy low, sell high. While that is a worthy objective some big money has been made by focusing on solid trends and focusing your money on learning to buy high and sell higher.
We are advocates of becoming extremely aware, at all times of the 52-week trading range of any stock that we are looking to either trade or invest in. The 52-week high boundary often acts as major resistance to a stock advance until it is breached. Once a stock successful closes above its 52-week high, it is very common for a stock to continue to move higher. We do not take this on faith but apply our artificial intelligence to this reality to be able to fine tune our entries and exits.
Please observe on the long-term chart above how the previous 52-week high acts as major resistance to MRNA. Once MRNA breached that price level it has gone on to move substantially higher in a very short period. Traders have gone on to see 5-fold increase in this stock since the 52-week high level was breached.”
Vantagepoint A.I. Forecast (Predictive Blue Line)
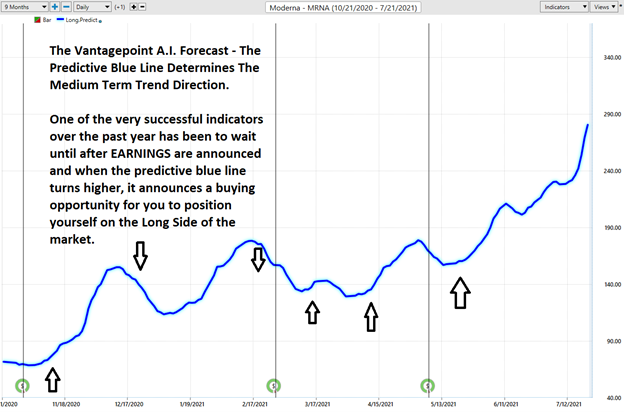
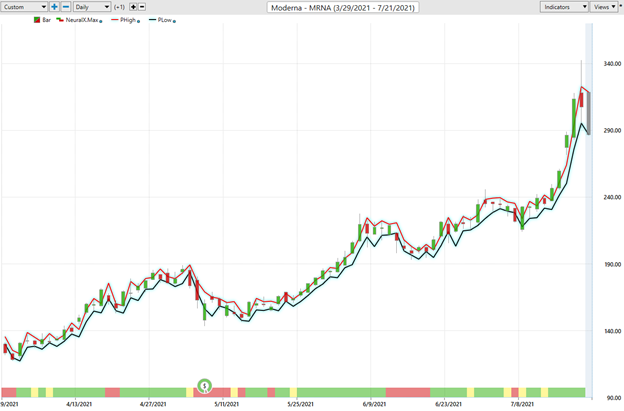
On the following chart you will see the power of the VantagePoint Predictive blue line which determines the medium term trend price forecast for MRNA.
The long black vertical lines are the dates of the earnings announcements. By simply eyeballing the chart you can quickly conclude that one of the most successful trading actions in MRNA, over the past year has been to wait until after EARNINGS are announced and then when the predictive blue line turns higher it announces a BUYING opportunity for you to position yourself on the long side of the market.
We are going to zoom in and magnify on the last 77 days of price action so you can recognize the power of the artificial intelligence forecast.
The guidelines we abide by are as follows:
- The slope of the predictive blue line determines the trend and general direction of MRNA
- Ideally, the VALUE ZONE is determined to buy the asset at or below the predictive blue line.
Power Traders use the predictive blue line in helping to determine both the value zone as well as the trend direction. The slope of the blue line is a forecast of future trend direction.
Using VantagePoint Software and the artificial intelligence, traders are alerted to trend forecasts by monitoring the slope of the predictive blue line. The black line is a simple 10 day moving average of price which simply tells you what has occurred in the market. The predictive blue line also acts as value zone where in uptrends traders try to purchase the asset at or below the blue line.
In studying the chart above, pay close attention to the relationship between the black line and predictive blue line. The black line is just a simple 10 day moving average. It’s calculated by taking the closing prices of the last 10 days and dividing that sum by 10. All the black line tells you is what has occurred. It tells you where prices have been and what the average price over the last ten days is.
The predictive blue line, however, utilizes the VantagePoint-patented Neural Network and Intermarket Analysis to arrive at its value. It looks at the strongest price drivers of an asset through artificial intelligence and statistical correlations to determine its value.
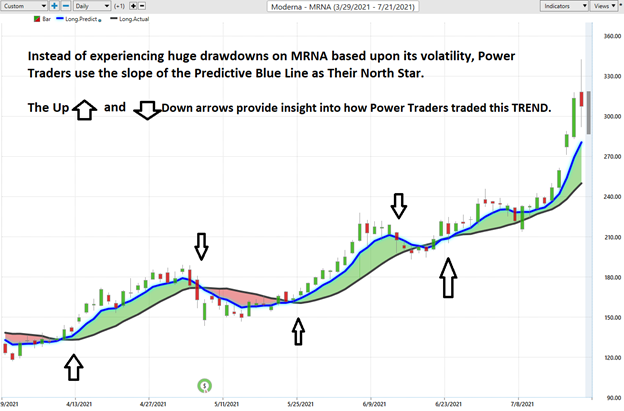
The chart above shows the price action from March 29, 2021 till July 21, 2021. In this time frame MRNA stock has moved from under $120 per share to as high as $342.51. Observe how the market has had four advances in this time frame and three relatively steep declines.
The rallies ranged from as short as 9 days to as long as 24 days.
The declines ranged from 4 to 11 days.
In other words, the market takes longer to rally than it does to fall.
This price volatility is ideal for SWING traders who can exploit the upside without having to experience the steep decline.
Neural Network Indicator of MRNA
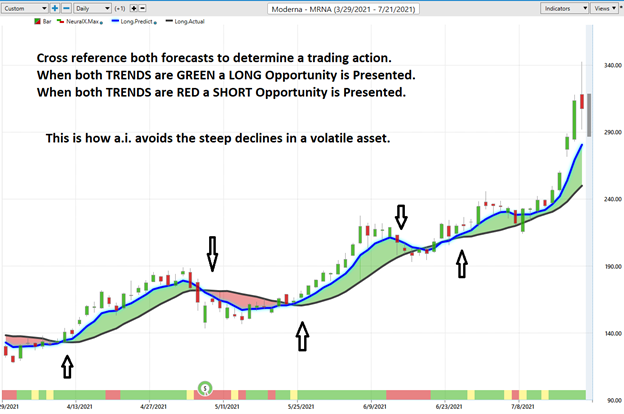
At the bottom of the chart is the Neural Network Indicator which predicts future strength and/or weakness in the market. When the Neural Net Indicator is green it communicates strength. When the Neural Net is red it is forecasting short term weakness in the market.
We advocate that Power Traders cross reference the chart with the predictive blue line and neural network indicator to create optimal entry and exit points.
Traders look for confirmation on the NeuralNet to position themselves LONG or SHORT in the market. In other words, when the A.I. forecast is green, and The Neural Net is green, that presents a buying opportunity.
The inverse is also true, when the A.I. forecast is red and the NeuralNet is red, that is a SELLING opportunity. The arrows on the chart below highlight the trading zones where Power Traders would’ve been using double confirmation to BUY and SELL in cross referencing the A.I. forecast with the NeuralNet.
Power Traders are always looking to apply both the Neural Network and A.I. to the markets to find statistically sound trading opportunities.
VantagePoint Software Daily Price Range Prediction
One of the powerful features in the VantagePoint Software which Power Traders use on a daily basis is the Price Range prediction forecast.
This forecast is what permits Power Traders to truly fine tune their entries and exits into the market.
Every day traders are faced with the anxiety and frustration of wondering where they should be looking to buy and sell the market. VantagePoint’s A.I. makes this decision super easy with the Daily Price Range Forecast.
Here is the price chart of MRNA during the most recent three-month run up featuring only the Daily Price Range forecast.
This chart helps traders decide where stop placement should occur. Observe how placing protective sell stops below the dark line on the chart was a powerful way to minimize risk on this trade.
See how the upper and lower bands of the price range forecast for a very clear channel of trading activity as well. Swing traders are always looking to buy towards the bottom of the predicted channel and try to sell above the top band.
Intermarket Analysis of Moderna (MRNA)
Power lies in the way we respond to the truth we understand.
Sometimes the only way we can understand the truth of the financial marketplace is by simply looking at the most statistically correlated markets to the price of an asset we are trading or investing in.
We live in a global marketplace.
Everything is interconnected.
Interest rates, Crude Oil Prices, and the volatility of the Dollar amongst thousands of other variables affect the decisions companies must make to flourish and prosper in these very challenging times. Trying to determine what these factors are is one of the huge problems facing investors and traders.
You always have a choice. You can tune in to the talking heads in the media who spin talking points which promote fear. Or you can rely on facts to base your decision making on.
Within the following Intermarket Analysis graphic, you will see the 31 markets that are the key drivers to MRNA’s price.
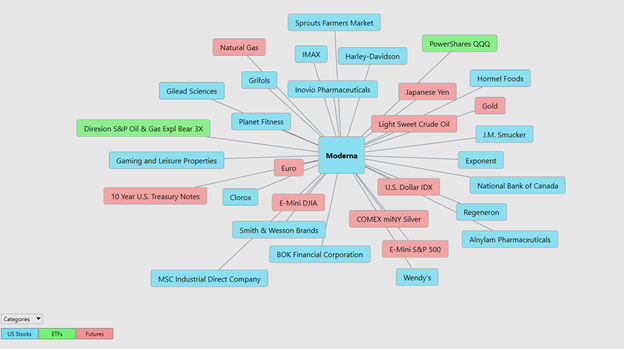
Analyzing a top performing asset like MRNA with Intermarket analysis opens opportunities to study the charts, A.I. and neural networks for these interconnected assets and uncover true gems.
There is great value to be had in studying and understanding the key drivers of MRNA’s price action. This graphic provides a microcosmic view of what factors are driving the Vaccine universe and the most statistically correlated assets. These factors are all displayed from a standpoint of statistical correlations which show the strongest interconnectedness of prices.
Moderna has proven to be extremely volatile, it has presented traders with incredible trading opportunities over the past two years. We think it should be at the top of your trading radar because of its vast volatility. When huge breaks occur in the price the indicators, we have shared in this stock study prove to be extremely valuable in uncovering short term trading opportunities.
Trading Suggestion for MRNA
Thanks to the demand for the MRNA coronavirus injection, Moderna (NASDAQ:MRNA) is one of the hottest companies on the market right now. It will be included in the S&P 500 Index which means that it will receive even greater attention from traders and investors. With the pandemic continuing throughout the world, MRNA has struck lucrative agreements with third world nations to deliver its product. The result is this should be very lucrative for quite some time.
We continue to rely on the Vantagepoint A.I. forecast to determine our trading behavior. At present we think that the recent high at $342.51 will provide short term resistance. This stock could still pull back to $261 from current levels and maintain its uptrend status. Longer-term support exists at $214 which is over $86 from where MRNA is currently trading. That type of volatility of roughly 27% to 30% is quite common in a stock like MRNA which has a very strong powerful narrative.
Our suggestion is traders study each indicator which we have outlined in this weekly stock study to arrive at a statistically sound trading decision.
Our recommendation is identical to what we stated in our January analysis of MRNA stock. Follow the A.I. trend analysis and practice good money management on all your trades.
Recently, MRNA won a supply agreement for 20 million coronavirus shots in Argentina. The company also announced it has a seasonal flu vaccine in the pipeline which is also in high demand.
The stock is currently overvalued by Wall Street Analysts. However, as MRNA sells its vaccine into the third world these analysts will upgrade their valuations creating even more volatility in this asset. The 13 analysts offering 12-month price forecasts for Moderna Inc have a median target of $194.00, with a high estimate of $299.00 and a low estimate of $83.00. That spells huge price swings anyway you look at it.
This is an asset that is sure to be very volatile. With the A.I. in your corner, the volatility is an opportunity to be embraced instead of feared.
Let’s Be Careful Out There!
Disclaimer: THERE IS A HIGH DEGREE OF RISK INVOLVED IN TRADING. IT IS NOT PRUDENT OR ADVISABLE TO MAKE TRADING DECISIONS THAT ARE BEYOND YOUR FINANCIAL MEANS OR INVOLVE TRADING CAPITAL THAT YOU ARE NOT WILLING AND CAPABLE OF LOSING.
VANTAGEPOINT’S MARKETING CAMPAIGNS, OF ANY KIND, DO NOT CONSTITUTE TRADING ADVICE OR AN ENDORSEMENT OR RECOMMENDATION BY VANTAGEPOINT AI OR ANY ASSOCIATED AFFILIATES OF ANY TRADING METHODS, PROGRAMS, SYSTEMS OR ROUTINES. VANTAGEPOINT’S PERSONNEL ARE NOT LICENSED BROKERS OR ADVISORS AND DO NOT OFFER TRADING ADVICE.