
This week’s stock analysis is Regeneron (REGN).
Regeneron Pharmaceuticals, Inc. is an American biotechnology company headquartered in Westchester County, New York, about 25 miles north of Midtown Manhattan. The company was founded in 1988. It is headquartered 25 miles outside of New York City in Tarrytown, New York. Originally focused on neurotrophic factors and their regenerative capabilities, giving rise to its name, the company then branched out into the study of both cytokine and tyrosine kinase receptors.
Over the last year with the pandemic and economic lockdown which ensued we have seen great interest in biotech and pharmaceutical stocks that can address the threats posed by the COVID-19 virus. Investors have given coronavirus vaccine stocks a lot of attention. But treatment makers, such as Regeneron Pharmaceuticals deserve to be on your radar.
Regeneron recently brought its antibody cocktail to market for combating COVID-19. Patients who received the therapy had much lower hospitalization rates for COVID-19 than the general public. This product brought in $144 million of sales in Q4, with the U.S. government ordering 300,000 doses. One powerful driver in the stocks recent price action is that the company recently received FDA approval on this biologic. On June 4, 2021, the FDA authorized lower 1,200 mg intravenous and subcutaneous dose of Regen-Cov antibody cocktail to treat patients with Covid-19. Since the announcement the stock has rallied $141 per share in the last 54 trading sessions.
Overall, Regeneron generates approximately $2.3 billion in revenue per quarter, and it generated $961 million in profit. Revenue and profit both grew at nearly 30% year over year. A big driver behind its momentum lies in its commitment to research and development. The company estimates it spent $2.8 billion of its sales on research efforts last year and has very high hopes for its antibody cocktail to treat Covid-19.
In this weekly stock study, we will look at and analyze the following indicators and metrics as are our guidelines which may help us in deciding whether to buy, sell, or stand aside on a particular stock.
- Wall Street Analysts’ Estimates
- 52-week high and low boundaries
- Vantagepoint A.I. Forecast (Predictive Blue Line)
- Neural Network Forecast
- Daily Range Forecast
- Intermarket Analysis
- Our trading suggestion
We don’t base our trading decisions on things like earnings or fundamental cash flow valuations. However, we do look at them to better understand the financial landscape that a company is operating under.
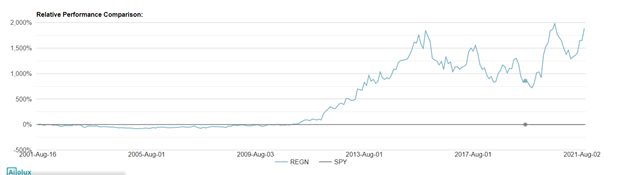
REGN has been a favorite Wall Street growth stock for the last 15 years. Since October 2005 the stock has risen 7,616% while the S&P 500 Index in the same time frame has risen 274%. With this type of explosive exponential growth, REGN has made many traders extremely wealthy.
Wall Street Analysts’ Estimates
The 21 analysts offering 12-month price forecasts for Regeneron Pharmaceuticals Inc have a median target of $675.00, with a high estimate of $906.00 and a low estimate of $545.00. The median estimate represents a +4.17% increase from the last price of $647.96. Looking at this wide divergence of opinion is something that Power Traders love to see because the stock demonstrates the potential for being a higher-than-normal volatility play. Currently the stock is undervalued and Power Traders could focus on limited risk options strategies to harness volatility.
52-Week High and Low Boundaries
Looking at the Long-Term chart of REGN provides us with the 52-week high and low boundaries.
Over the past year we have seen REGN trade as low as $441 and as high as $650.59. The annual trading range has been $209.59. This tells us that the average weekly trading range for REGN is $4.03 or roughly 6/10th of 1%.
We look to amplify this value greatly when trading with the artificial intelligence.
Best Case – Worst Case Scenario
When we study the long term 52-week chart we can look at the best case and worst-case scenarios just to get an eyeball perspective of the risk and volatility of this asset. This is worth doing anytime you invest or trade to monetarily understand what the potential risks and rewards have been over the past year.
The worst-case scenario for bulls would have been to blindly purchase REGN at $630 on 8/19/2020. In this worst-case scenario, the market slid $187 a share or almost 30% in the next 136 trading sessions before finding a bottom and rallying sharply to new 52-week highs.
The best-case scenario on REGN would have occurred if an investor/trader was lucky enough to buy REGN at its yearly lows on 3/4/21 at $441 per share. In this best case scenario, REGN has rallied 46% over the last 116 trading sessions. I point out this best case – worst case scenario just to outline what the risk reward profile of this asset has been over the past year.
It is worth doing this type of baseline analysis because it allows you to quickly compare the performance of REGN to the major broad market indexes. Over the past year REGN has been a major laggard. REGN is up only 4.3% in the last 52 weeks compared to the S&P 500 which is up 31.4% in the same time frame. So, in REGN we have an asset which historically has massively outperformed the S&P 500 Index, but over the past year it has lagged way behind. In the past year the worst case downside was -30% and the best case upside was +46%. In between those boundaries is where all the price action occurred. Yet over the past 20 years REGN has absolute gains 1889.7% better than the S&P 500. This is a powerful narrative that can quickly see REGN post huge gains in the near future.
We advise Power Traders to always place close attention the 52-week high and low boundaries as these markers often provide great trading opportunities and create a great deal of volatility in an asset.
REGN is currently trading at a NEW 52-week high. By analysts estimates it is still slightly undervalued. We expect the current 52-week high at $630 to provide a good deal of both support and resistance in REGN. The upside potential is great but so is the risk.
Earnings dates have also been a key driver in REGN price action as is indicated by the dark vertical lines on the 52-week chart. The next REGN earnings call is slated for November 21, 2021.
These factoids on REGN’s price action are worth noting as they will shape how we potentially look to position ourselves using OPTION tactics.
Vantagepoint A.I. Forecast (Predictive Blue Line)
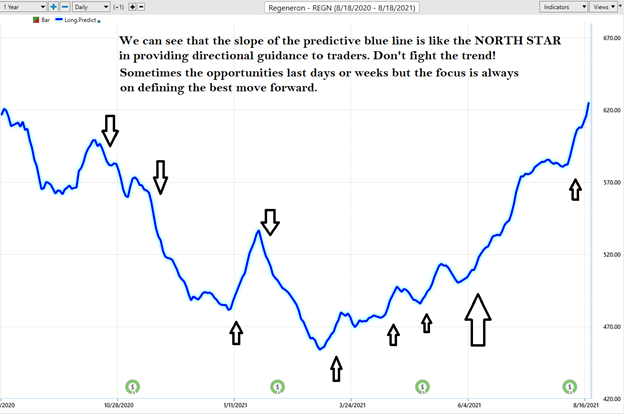
On the following chart you will see the power of the VantagePoint Predictive blue line which determines the medium term trend price forecast.
The guidelines we abide by are as follows:
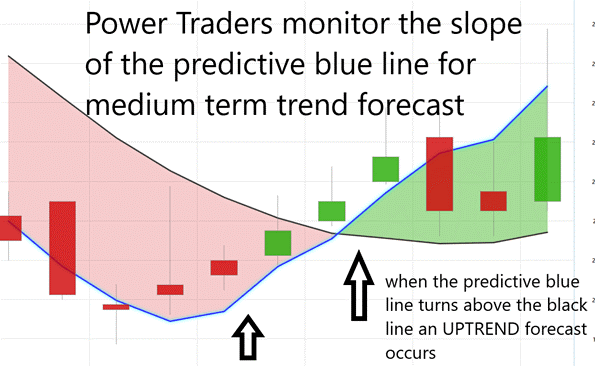
- The slope of the predictive blue line determines the trend forecast and general direction of REGN
- Ideally, the VALUE ZONE is determined to try and buy the asset at or below the predictive blue line, or to sell the asset above the predictive blue line during a downtrend.
Naturally when the predictive blue line slopes lower traders would be anticipating lower prices and either moving to the sidelines or hedging their positions.
Using VantagePoint Software and the artificial intelligence, traders are alerted to trend forecasts by monitoring the slope of the predictive blue line.
The predictive blue line, however, utilizes the VantagePoint-patented Neural Network and Intermarket Analysis to arrive at its value. It looks at the strongest price drivers of an asset through artificial intelligence and statistical correlations to determine its value.
What is fascinating about the chart is that by simply eyeballing the 52-week chart we can see that the slope of the predictive blue line is like the NORTH STAR in providing directional guidance to traders. In other words, don’t fight the trend. The trading opportunities might last a few days or several weeks, but the focus is always to keep the trader on the right side of the asset at the right time. The blue line ALWAYS determines the forecast and the best move forward.
Neural Network Indicator (Machine Learning)
At the bottom of the chart is the Neural Network Indicator which predicts future short-term strength and/or weakness in the market. When the Neural Net Indicator is green it communicates strength. When the Neural Net is Red it is forecasting short term weakness in the market. When it is yellow it is anticipating sideways prices.
A Neural Net is a computational learning system that uses a network of functions to understand and translate massive amounts of data into a desired output, consistently monitoring itself and improving its performance.
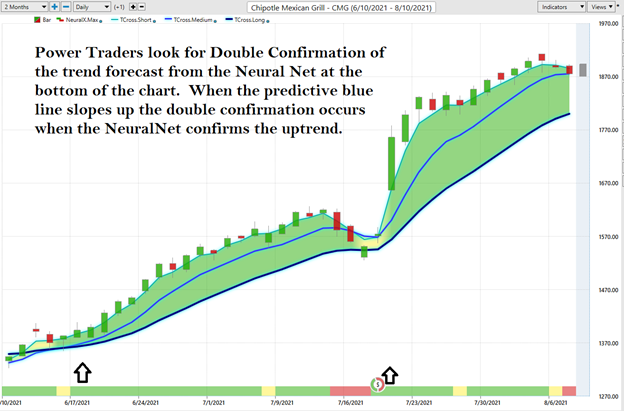
We advocate that Power Traders cross reference the chart with the predictive blue line and neural network indicator to create optimal entry and exit points.
Traders look for confirmation on the NeuralNet to position themselves LONG or SHORT in the market. In other words, when the A.I. forecast is green, and The Neural Net is green, that presents a buying opportunity.
The inverse is also true, when the A.I. forecast is red and the Neural Net is red, that is a SELLING opportunity. The arrows on the chart below highlight the trading zones where Power Traders would’ve been using double confirmation to BUY in cross referencing the A.I. forecast with the NeuralNet.
Power Traders are always looking to apply both the Neural Network and A.I. to the markets to find statistically sound trading opportunities.
VantagePoint Software Daily Price Range Prediction
We will zoom in on the last 3 weeks of price action so that you can see for yourself how the A.I. and machine learning combine to create a very accurate daily price range forecast that keep traders focused on optimal trade placement.
One of the powerful features in the VantagePoint Software which Power Traders use daily is the Price Range prediction forecast.
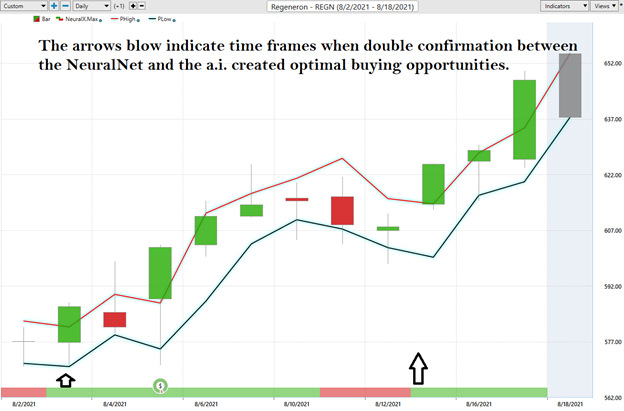
This forecast is what permits Power Traders to truly fine tune their entries and exits into the market.
The arrows on the chart above are specific time frames when the NeuralNet and the Price Range forecast provided a double confirmation buying opportunity. Power Traders were buying under $586 and under $625 and saw the market rally very explosively over the last 3 weeks.
Every day traders are faced with the anxiety and frustration of wondering where they should be looking to buy and sell the market. VantagePoint’s A.I. makes this decision super easy with the Daily Price Range Forecast.
For short term traders the important question that they have to confront every day is where should I buy? Where should I place my stop? Where should I sell? The Vantagepoint Daily Price Range forecast answers this question with precision.
This chart helps traders decide where stop placement should occur. Observe how placing protective sell stops below the dark line on the chart was a powerful way to minimize risk on this trade.
See how the upper and lower bands of the price range forecast for a very clear channel of trading activity as well. Swing traders are always looking to buy towards the bottom of the predicted channel and try to sell above the top band.
Intermarket Analysis
Power lies in the way we respond to the truth we understand.
One of the supremely important questions in trading is what is driving the price? Headlines often create interesting narratives. But these “stories” only capture the imagination. Traders want and need to understand the cause and effect of price movement.
The only way to get an answer to this important question is through intermarket analysis which looks at statistical price correlations of assets.
We live in a global marketplace. Everything is interconnected.
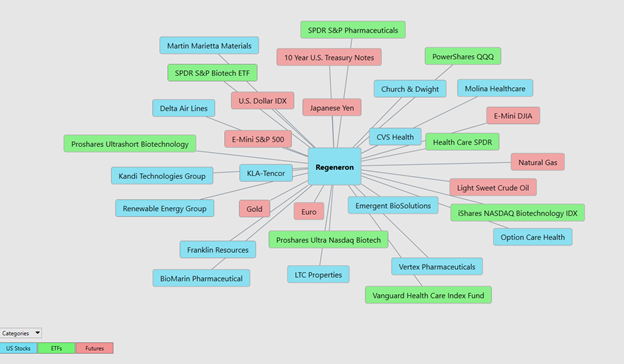
Interest rates, Crude Oil Prices, and the volatility of the Dollar amongst thousands of other variables affect the decisions companies must make to flourish and prosper in these very challenging times. Trying to determine what these factors are is one of the huge problems facing investors and traders.
You always have a choice. You can tune in to the talking heads in the media who spin talking points which promote fear. Or you can rely on facts to base your decision making on.
Within the following Intermarket Analysis graphic, you will see the 31 markets that are the key drivers to REGN’s price.
There is great value to be had in studying and understanding the key drivers of REGN’s price action. This graphic provides a microcosmic view of what factors have been driving REGN higher. You will find a handful of biotech and pharmaceutical ETF’s whose price action is very statistically correlated to REGN.
Trading Suggestion
The age-old question for traders and investors is to find a way to position themselves in an asset while simultaneously reducing risk. This is much easier to accomplish for savvy option traders because options have built in risk management features.
We like the REGN narrative and think the upside can be explosive. We like the reality that the stock is still slightly undervalued, and the most optimistic Wall Street Analysts still think the stock has potential to run to $906.
But the risk is also much greater. Whenever we encounter this type of potentially bullish scenario we review and asses our bullish options strategy possibilities. The challenge with options is that when you buy them you create a limited risk profile. When you create (SELL) options you are obligated to the terms of the contract which sometimes can create theoretical unlimited risk. But risk-aware Options traders can simultaneously buy and sell options to create risk-reward profiles that effectively manage their risk better than just being long the underlying security.
We have written many articles in the past about options that we would urge you to study. We will link to them below. If you are not familiar with options our advice is to paper trade them for at least 6 months before you enter any real time trading. All options are deteriorating assets so even though you can have limited risk, most Options traders will often lose in their trading because they never learn how to manage the risk on their positions.
Traditionally whenever you expect higher prices in the underlying asset you could:
- Buy Call Options – (limited risk/unlimited reward)
- Sell Put Options – (limited reward/cost of the stock is your risk)
- Create Covered Calls (limited reward/reduced risk)
(Buy The Stocks and Sell Call Options against it.)
We like the idea of owning REGN in here, but we think that the 52-week high is going to face some choppy headwinds. On breaks in the stock, we would look to purchase call options, sell put options or enter in covered call options positions. Each of these tactics have different risk-reward profiles but we think they are warranted at the present time.
The narrative in REGN is explosive. Even without the antibody cocktail the company is still growing at 30% year over year. This has all of the markings of a well-established uptrend that we look to participate in using limited risk strategies.
Our recommendation is to follow the A.I. trend analysis as outlined in this stock study and practice good money management on all trades.
We will re-evaluate based upon:
- New Wall Street Analysts’ Estimates
- New 52-week high and low boundaries
- Vantagepoint A.I. Forecast (Predictive Blue Line)
- Neural Network Forecast
- Daily Range Forecast
It’s Not Magic.
It’s Machine Learning.
Disclaimer: THERE IS A HIGH DEGREE OF RISK INVOLVED IN TRADING. IT IS NOT PRUDENT OR ADVISABLE TO MAKE TRADING DECISIONS THAT ARE BEYOND YOUR FINANCIAL MEANS OR INVOLVE TRADING CAPITAL THAT YOU ARE NOT WILLING AND CAPABLE OF LOSING.
VANTAGEPOINT’S MARKETING CAMPAIGNS, OF ANY KIND, DO NOT CONSTITUTE TRADING ADVICE OR AN ENDORSEMENT OR RECOMMENDATION BY VANTAGEPOINT AI OR ANY ASSOCIATED AFFILIATES OF ANY TRADING METHODS, PROGRAMS, SYSTEMS OR ROUTINES. VANTAGEPOINT’S PERSONNEL ARE NOT LICENSED BROKERS OR ADVISORS AND DO NOT OFFER TRADING ADVICE.