


This week’s stock analysis the ProShares UltraPro Short $SQQQ ETF
This week we are going to look at the ProShares Inverse ETF $SQQQ. This is a reverse ETF on the Nasdaq 100 Index. The first unique characteristic of this inverse ETFs is obvious: Inverse ETFs seek investment results that correspond to the opposite of the benchmark, or index, with which they are associated.
Investors position themselves for the long term. While this can have advantages, it also has its fair share of disadvantages. Chief among them is the fact that all markets decline. When these drops occur, an investor can often see drawdowns in excess of 30% on their portfolios.
The most popular ETFs in declining market environments are known as Inverse ETFs or Reverse ETFs. These funds go up in value as the broader markets go down. Professional traders are very aware that it is considered normal to see a market decline comparable to its annualized volatility. Let me quickly explain.
Over the last 12 months, the NASDAQ Index has traded as high as 16212 and as low as 11559. Those values provide us with an annual trading range of 860.45 for this popular index. To calculate the annualized volatility, we simply divide the annual trading range of 860.45 by the current closing price of 11806 and we can determine that the current annualized volatility for the S&P 500 is 39.4%. This value tells us that it would be considered statistically normal based upon the price action of the last twelve months to see the following year of the NASDAQ Index trade in a range that is between 39.4% higher and/or lower than the current close.
These broad boundaries allow you to understand the risk of a buy and hold mentality. They project an annualized high of 16458, and an annualized low of 7153. That type of range will make any long-term investors’ stomach turn.
Unless you’ve been sleeping under a rock you are aware that the tech sector has been decimated over the last several months. Amazon is off 42% from its highs. Facebook is down 44% from its highs. Google is down 26% from its highs. It is exactly because of these risks that traders and investors should explore inverse ETFs.
These types of drawdowns illustrate why we are short-term swing traders. Our loyalty is only to the trend. We allow the a.i., machine learning and neural networks to locate the strongest tradable trends for us and then it is our mission to exploit that price action.
One of the milestones that traders accomplish in their journey is thoroughly comprehending how to make money in down markets.
Today, inverse ETFs allow traders to hedge their exposure during declining markets.
On Wall Street the most popular adage is to “buy low and sell high.” Everybody understands the idea. You buy something first and after ownership is accomplished you sell if at a higher price for a profit.
That simplicity is quite easy to comprehend.
However, equally popular among professional traders is an adage which you rarely hear about. It states, “Sell High and Buy Low.” An astute reader will observe that in this adage you are simply selling first and buying second. The confusion among newcomers is, how can you sell something that you do not own? The answer to this question opens up a completely separate way of looking at markets and opportunities. The seller is actually borrowing the asset at its current price and will buy it back in the future.
Let’s look at some charts to get a thorough understanding of this powerful concept.
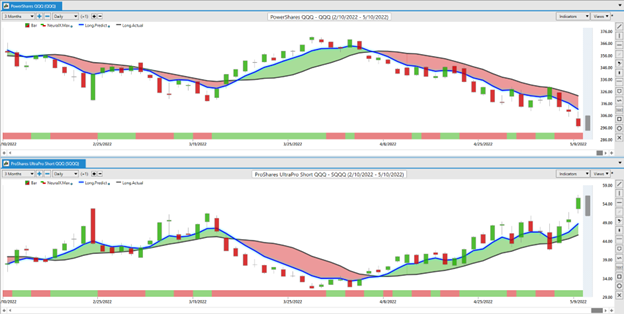
The top chart is the Powershares QQQ which is essentially being long the NASDAQ 100 Index. (notice the steep downtrend over the past month)
The bottom chart is the SQQQ which is the PowerShares UltraPro Short QQQ. Observe how it is inversely correlated to the top chart.
Let’s dive deeper into this concept.
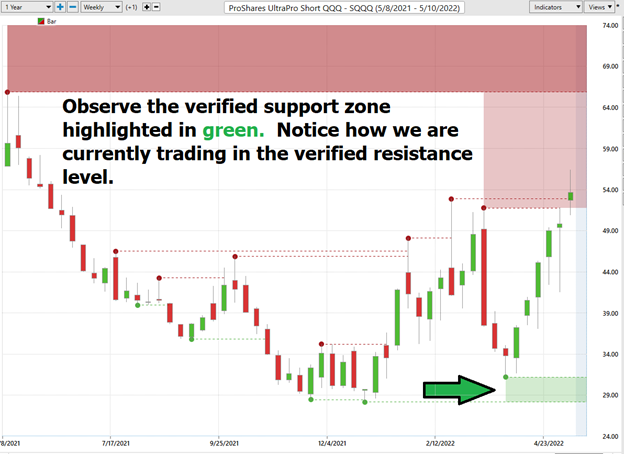
The million-dollar question really boils down to how you define risk? In this post, we will discuss how traders can best cope with this reality by using the verified support and resistance levels as well as the Vantagepoint A.I. predictive blue line.
To recognize when RISK exists in a market a trader and investor needs to understand the importance of verified support and resistance. The VantagePoint Software makes this aspect of trading push-button easy. When you open a chart, you can quickly see where the market is anticipated to run into resistance moving higher and where expected support levels are.
Power Traders use these calculated support and resistance levels to identify price points on a chart where the probabilities favor a pause, or reversal, of a prevailing trend. A support level occurs where a downtrend is expected to pause, due to a concentration of demand and buying interest. A resistance level occurs where an uptrend is expected to pause temporarily, due to a concentration of supply and sellers hitting the market.
These levels are calculated based on market sentiment and historical anchoring. Reading charts can be summarized in one sentence, what everybody knows is reflected in the current price. We study the history of a chart to see where supply and demand have created imbalances in the past.
In this weekly stock study, we will look at and analyze the following indicators and metrics as our guidelines which dictate our behavior in deciding whether to buy, sell, or stand aside on a particular stock.
- 52-week high and low boundaries
- Verified Support and Resistance Boundaries
- Best Case-Worst Case Analysis
- Vantagepoint A.I. Forecast (Predictive Blue Line)
- Neural Network Forecast
- Daily Range Forecast
- Intermarket Analysis
- Our trading suggestion
An inverse ETF is an exchange traded fund (ETF) created by using various derivatives to profit from a decline in the value of an underlying benchmark. Derivatives are instruments like options and futures contracts. Investing in inverse ETFs is similar to holding various
short positions, which involve borrowing securities and selling them with the hope of repurchasing them at a lower price.
Inverse ETFs allow investors to make money when the market or the underlying index declines, but without having to sell anything short. The value of the ETF is directly inverse to the value of the Index it is tracking.
The largest and most successful inverse ETFs aim to deliver the opposite returns of major stock indexes, like the Nasdaq or the S&P 500 and the Dow Jones Industrials. While these instruments need to be closely monitored, they help traders chase yield during market dips. They create an opportunity that is easy to access.
52-week High-Low Chart
Readers of this blog will attest to the fact that we are huge believers in monitoring where a stock is trading in relation to its 52-week range. Our perspective is that winning stocks continuously make new 52-week highs, and we want to be on board for those types of moves. We pay a great deal of attention to how a stock reacts and performs in relation to its 52-week high and low boundaries.
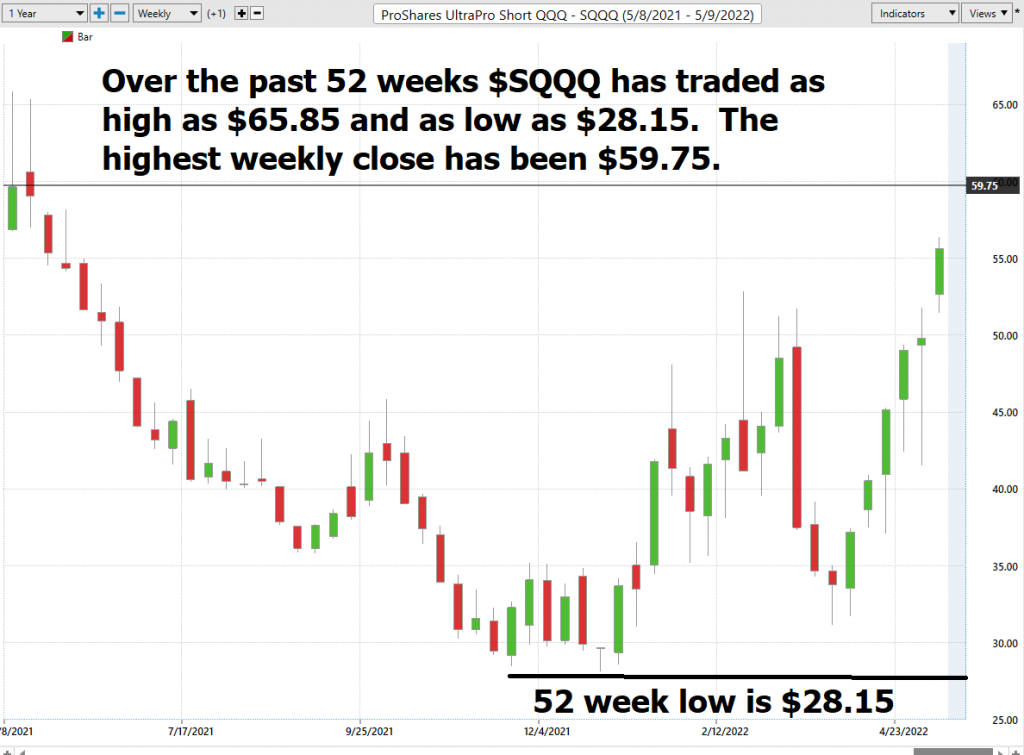
Over the last 52 weeks, $SQQQ has traded as high as $65.85 and as low as $28.15. Its most recent close was $57.82. It is currently trading at its 79th percentile based upon the annual range.
Since this is an INVERSE ETF on the NASDAQ, we can expect that it will have an inverse relationship to the broader market indexes.
Based upon the high and low prices we can quickly see that the annual trading range of $SSSQ has been $37. This tells us that the average weekly trading range is .73.
We refer to these as the commonsense metrics which we use as baseline measurements of understanding normal value. When using artificial intelligence, we look to amplify our returns based upon these baseline measurements.
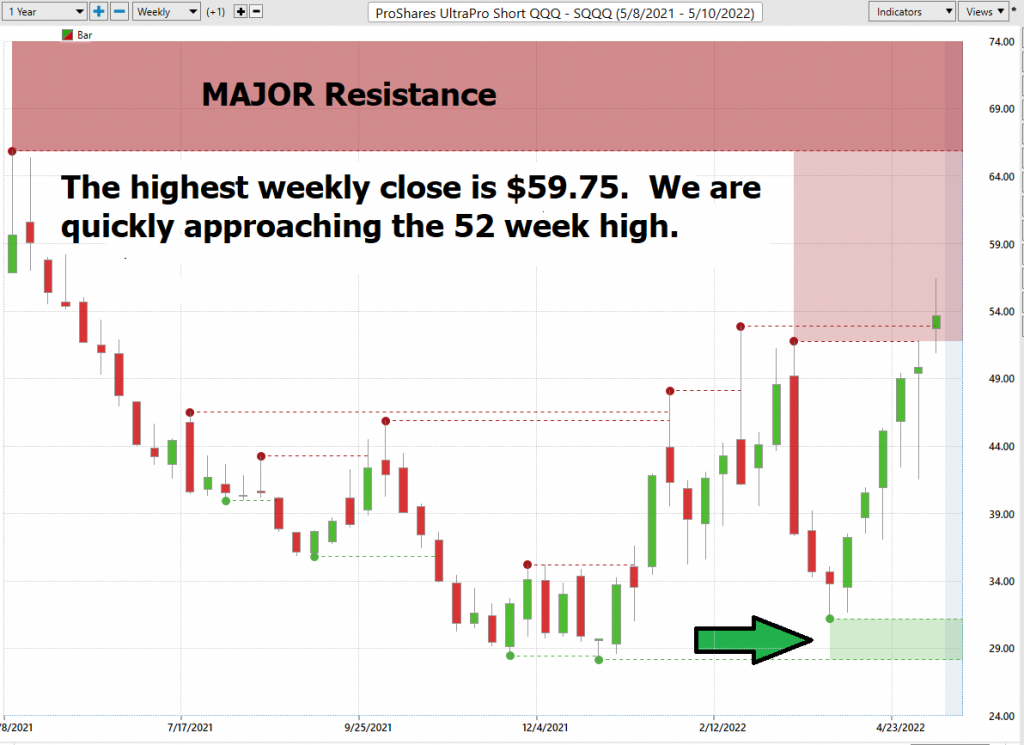
One can quickly see that we are knocking on the door of the 52 week high on $SQQQ. Our expectation that this will provide firm resistance to the market over the short term. We will monitor this level very closely. If this level is breached the expectation is that $SQQQ will run higher. Until then we take a very short-term view and recognize that a major portion of the recent move has already occurred.
Best Case – Worst Case Scenarios
Next, we want to look at the trend over the past year and evaluate the strength of the rallies in relation to the declines.
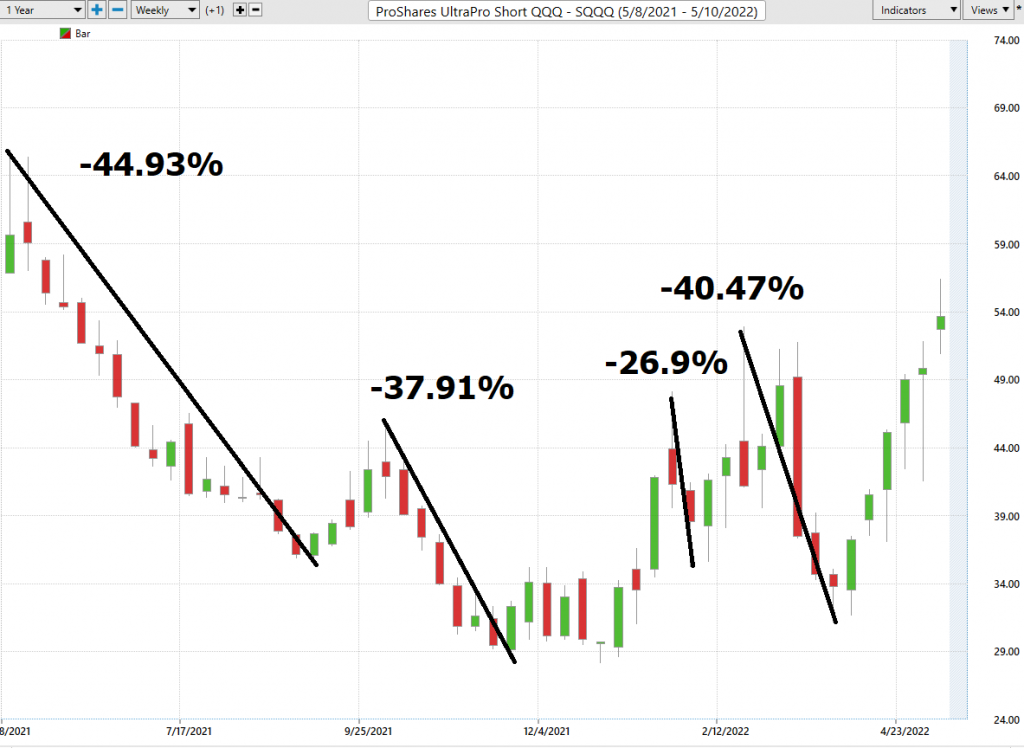
Since $SQQQ is an inverse ETF, we can expect that the declines will be proportional to the rallies in the broader stock market indexes over the past year.
Here is the annual summary:
$SSSQ over the last 52 weeks is DOWN -4.7%.
The DOW Jones Industrials is DOWN -6.77%
S&P 500 Index is DOWN -4.73%
NASDAQ is DOWN -14.51%
Russell 1000 Stock Index is DOWN -7.23%
What can we learn from these values? First off, we can see that all market indexes are down.
The largest MONTHLY UP move in the NASDAQ’s most recent 10-year history is 15.7% which occurred just recently in March 2022.
The largest negative monthly move on the NASDAQ is down 13.5% which occurred in March 2020.
A powerful simplified analysis is in order regarding $SQQQ.
Over the last 2 months $SQQQ is UP 10.41%
Over the last 1 month $SQQQ is UP 34.52%
Over the last week $SQQQ is Up 27.95%
Clearly the trend in the broader stock market indexes is down.
$SQQ has been a wonderful hedge over the last two months.
This clearly tells us that it is harder and harder to find up trending markets and that we should either hedge our long exposure or exit our positions and move to the sidelines.
The Vantagepoint A.I. Analysis
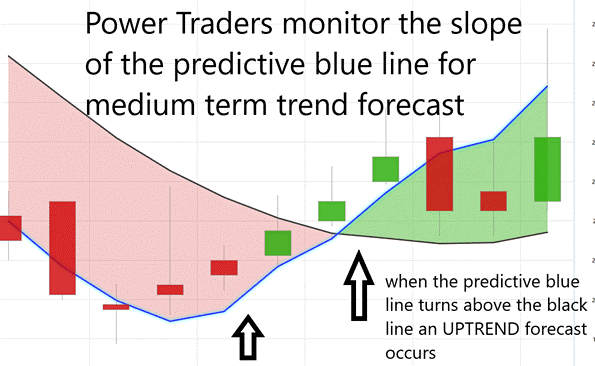
Using VantagePoint Software and the artificial intelligence, traders are alerted to trend forecasts by monitoring the slope of the predictive blue line. The black line is a simple 10-day moving average of price which simply tells you what has occurred in the market. The predictive blue line also acts as value zone where in uptrends traders try to purchase the asset at or below the blue line.
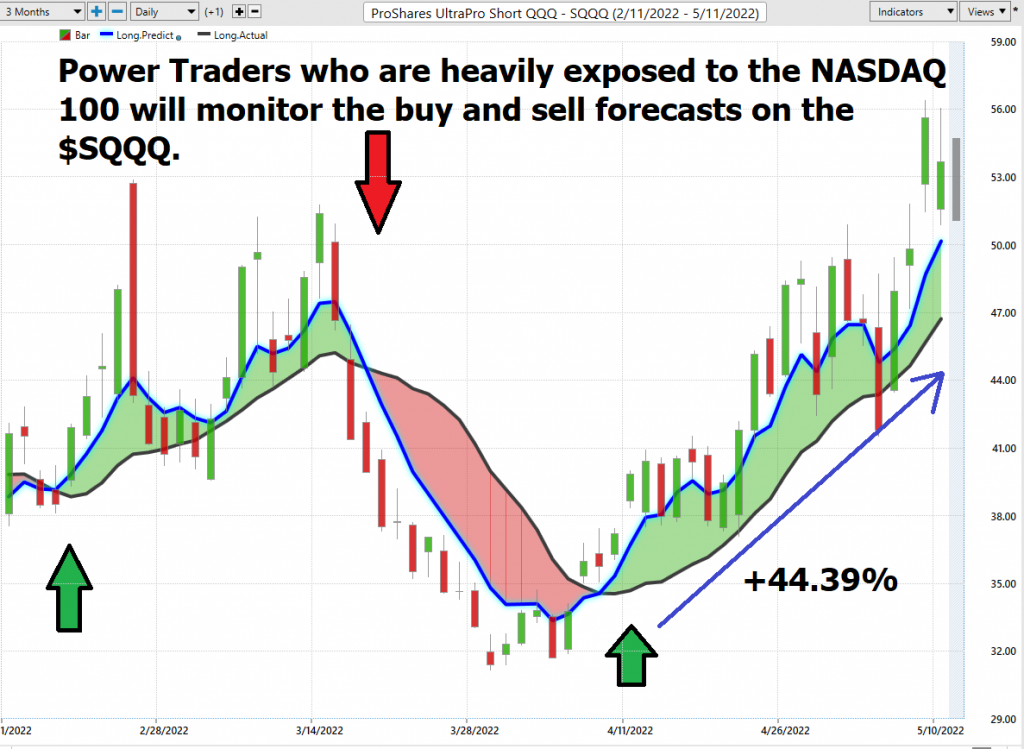
The following chart shows why INVERSE ETFs are used to protect portfolios and increase yield. The most recent UP forecast generated returns of 44.39% in 22 days.
Pay close attention to the slope of the blue line. Anytime the blue line crosses the zero intercept is a trend signal. If the line crosses from down to up, an UP-trading opportunity exists. If the line crosses from Up to down the down trading opportunity exists.
Power traders use the predictive blue line in helping to determine both the value zone as well as the trend direction.
Observe how the SLOPE of the predictive blue line started moving higher a few days before its moving above the black line. A strong trend was evidenced by seeing that price was consistently closing above the predictive blue line.
Fine Tuning Entries with The Neural Net Indicator
At the bottom of the chart is the Neural Network Indicator which predicts future strength and/or weakness in the market with a 48-to-72-hour time horizon.
A Neural Net is a computational learning system that uses a network of functions to understand and translate massive amounts of data into a desired output, consistently monitoring itself and improving its performance.
When the Neural Net Indicator is green it communicates strength. When the Neural Net is Red it is forecasting short-term weakness in the market.
We advocate that Power Traders cross reference the chart with the predictive blue line and neural network indicator to create optimal entry and exit points. This provides what we refer to as the DOUBLE CONFIRMATION setup.
Power Traders are always looking to apply both the neural network and a.i. to the markets to find statistically sound trading opportunities.
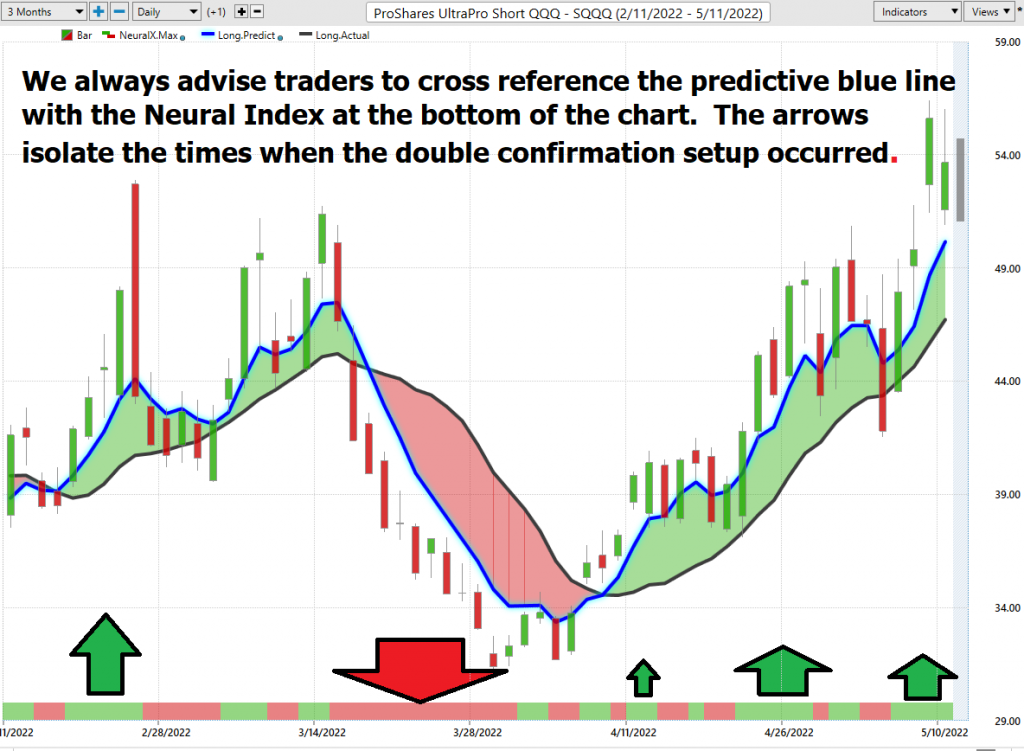
We advise Power Traders to cross-reference the predictive blue line with the Neural Net for the best entry opportunities.
VantagePoint Software Daily Price Range Prediction
The purpose of all these indicators so far is to help traders stay on the right side of the right trend at the right time.
One of the powerful features in the Vantagepoint A.I. Software which Power Traders use daily is the Daily Price Range prediction forecast.
This forecast is what permits Power Traders to truly fine tune their entries and exits into the market often looking for smaller time frames and more granular trading opportunities.
Here is the price chart of $SQQQ during the most recent runup featuring the Daily Price Range forecast and the Neural Net Indicator.
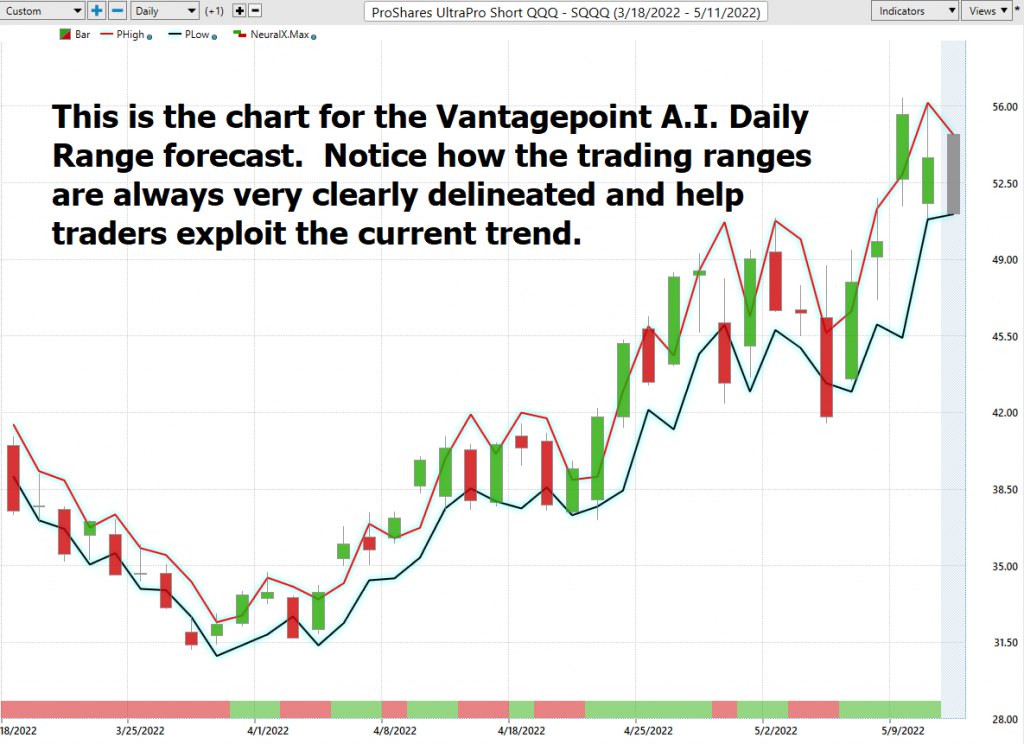
All of the tools so far in this analysis attempt to define value and to clearly identify the trend and points within the trend where traders should look to capitalize on.
Intermarket Analysis
What makes the Vantagepoint Software unique is its ability to perform Intermarket analysis and to locate those assets which are most interconnected that are responsible for driving the price of $SQQQ higher or lower.
Studying the charts can always provide objective realities in terms of locating support and resistance levels which become clear on a chart. But we live in a global marketplace. Everything is interconnected. The billion-dollar question for traders is always what are the key drivers of price for the underlying asset that I am trading?
These intangibles are invisible to the naked eye yet show very high statistical correlations.
Minor changes in Interest rates, Crude Oil Prices, and the Volatility of the dollar amongst thousands of other variables affect the decisions companies must make to survive in these challenging times. Trying to determine what these factors are is one of the huge problems facing investors and traders.
$SQQQ has an almost perfect correlation to the NASDAQ 100 Index. It is also tightly correlated to the U.S. Dollar Index as well as Crude Oil.
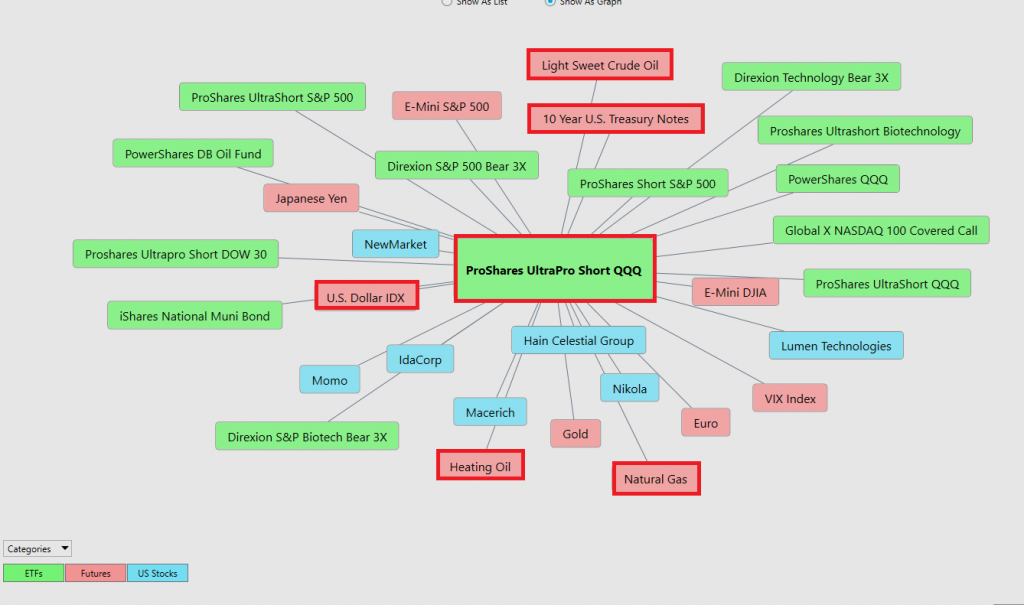
There is immense value to be had in studying and understanding the key drivers of $SQQQ price action. This graphic presents a plethora of opportunities that can quickly be explored within the software.
This is an amazing research tool that consistently uncovers future gems.
Our Suggestion
Even the most optimistic analysis of the broader stock market has to admit that we are seeing downtrends across the board.
The trend on all stock indexes is lower.
The trend on $SQQQ is UP.
Momentum on $SQQQ is UP. However, we are in a long-term resistance area which corresponds to a 52-week high.
We expect the 52-week high to turn back the trend. Should this area successfully be breached the broader stock market will crumble and $SQQQ will move substantially higher.
Over the shorter term we are looking to buy sudden breaks in the $SQQQ ETF looking for quick moves higher.
As long as the a.i. forecast remains UP you could look for opportunities to scale in small positions with tight stop losses.
Let’s Be Careful Out There!
Remember, It’s Not Magic.
It’s Machine Learning.
Disclaimer: THERE IS A HIGH DEGREE OF RISK INVOLVED IN TRADING. IT IS NOT PRUDENT OR ADVISABLE TO MAKE TRADING DECISIONS THAT ARE BEYOND YOUR FINANCIAL MEANS OR INVOLVE TRADING CAPITAL THAT YOU ARE NOT WILLING AND CAPABLE OF LOSING.
VANTAGEPOINT’S MARKETING CAMPAIGNS, OF ANY KIND, DO NOT CONSTITUTE TRADING ADVICE OR AN ENDORSEMENT OR RECOMMENDATION BY VANTAGEPOINT AI OR ANY ASSOCIATED AFFILIATES OF ANY TRADING METHODS, PROGRAMS, SYSTEMS OR ROUTINES. VANTAGEPOINT’S PERSONNEL ARE NOT LICENSED BROKERS OR ADVISORS AND DO NOT OFFER TRADING ADVICE.


