


VantagePoint AI Market Outlook for the Week of March 8, 2021
VIDEO TRANSCRIPT
Hello everyone and welcome back. My name is Greg Vermin and this is the Vantage Point AI Market Outlook for the week of March the 8th, 2021.
U.S. Dollar Index
Now, to get started this week we’re going to begin where we always do with that very important U.S. dollar index. Now the dollar has made a very strong move here, which is perfectly normal at this time of the month. At the beginning of the month usually we see dollar strength. Each month between the end of the month, up until about the 10th day of the new month, we can see the dollar really pushing through, but this week is a little bit different here. We’ve got a swing high at a verified resistance high at 91.60 that the dollar has managed to close above on Thursday. And then on Friday, we made a nice clean, break of this.
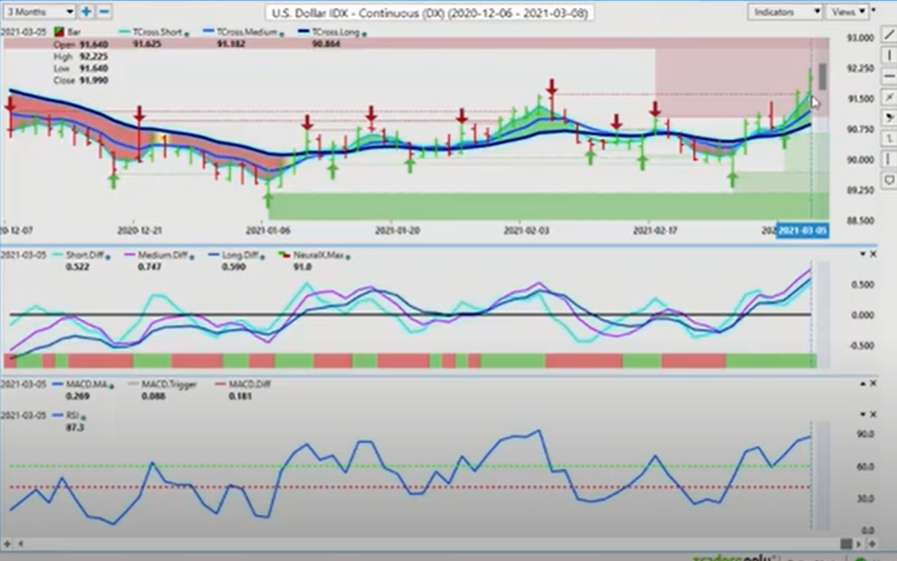
Now, what we have to be cautious of in a scenario like this is, again its made a big push based around the non-form payroll number. That payroll number was pretty good, but the U6 number was flat so I always take that with a grain of salt. But I have often seen, after the non-form payroll number, regardless of how good that number is, the dollar often cools off by Tuesday or Wednesday. Now, this particular situation is different. I have shown everybody the monthly patterns and that March, the seasonality is usually the dollar is strong right up until about the end of the month. We will see if that comes to fruition. Now Chairman Powell has definitely given the dollar another boost, talking about interest rates and, again, I don’t think that is going to hurt the equities as much as what they are suggesting.
But for now the swing high, we want to make sure that we are holding above this particular level. Our Tcross.long now comes in at 90.86, we must hold above that if the dollar is going to continue with further gains. But in my respectful opinion only, this level at the 91.60 is the one we need to watch. Now if we click F8 on our software using the predicted moving average by itself getting that pivot area, 91.29, so if we get below 91.60, no need to panic, but watch the 91.28 area. This is the level that we are likely going to see it retrace to, and we would look for it to hold. Once again, we want to really avoid using any kind of overbought, oversold type of signals particularly at this time of year. The dollar had a very poor year in 2020, but 2021 is certainly looking much, much better for the dollar provided we hold above these levels and of course at all important level, the yearly opening price about the 89.80 mark.
Now one of the driving factors again that is pushing that dollar higher is there is just no gold buyers, and rightfully so. In my respectful opinion again only, it is going to be very difficult for gold to recover here, as money continues to pour into Bitcoin. Now money is going into the dollar, when they are talking about raising interest rates, that is a gold killer here, guys. Now we are sitting right at the bottom end of this particular range, and that low end that I have talked about over the last several weeks. It is coming in at about approximately the 1700-1704 level. And we can identify the specific level there, and its coming back into these swing lows, but again, this is where its kind of a make or break time for gold, to be perfectly honest. Now when I look at this from the previous calendar year, the bulk of these gains, if not all of these gains, came from COVID. That is where the bulk of the Euro-US currency pair where it made its gains.
Gold
Now with COVID starting to turn the other way, the vaccines are working, gold has really done nothing since the swing high, going back into approximately August 2020. Its been on the decline since. Now if we break through the lower end of this particular range, at the 1706, that is the June 5th low. Then I would suggest a deeper move to the downside in gold, that is the likely outcome here, guys. Nothing is 100%. But when we look at fair value pre-COVID on gold, that is around the 1500 mark, so that is where I would put gold in the coming months ahead. But again this is a weekly outlook, this is not a long term outlook here, guys. Its one week at a time, that is how we take on the markets here. So again, we will continue to monitor the bottom end of this range. I would expect we would see some potential buyers here. Now if we do, we want to look for the retracement back to the vantage point Tcross.long, 1768. If we click on our F8, we have got our predictive moving average by itself, which is 1733.
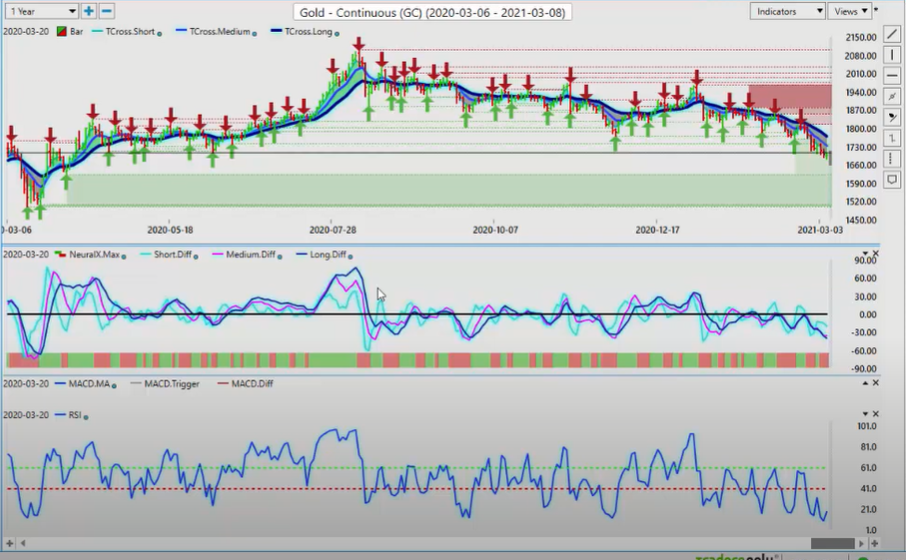
Between 1733 and 1768 is likely to contain any of the gold moves. It is very unlikely they are going to get past that particular level. Now one of the reasons that my view is that, is because of Bitcoin. Bitcoin, even with the dollar rally last week, stocks kind of soft, Bitcoin held its value. Firmly above the yearly opening price at 29,000. And again, struggling, all tangled up in this vantage point TCross.long, at 48,270. So I would look for Bitcoin to likely recover when the dollar softens up a bit on Tuesday or Wednesday. But we have a buy signal, yet again, on Bitcoin here. Our medium term, crossing our long term predicted difference. But again, we want to watch these momentum-based indicators, because when we are looking at them closer, we can see the medium term, crossing the long term predicted difference is what led to the dollar rally, breaking and closing above that predicted moving average.
Bitcoin
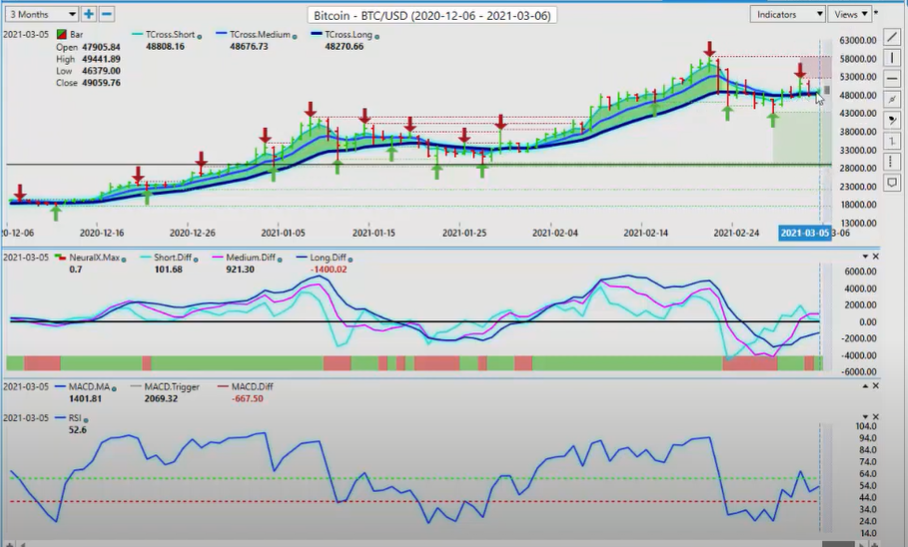
We would look for Bitcoin for very similar, if we click on our F8 in our software, we have got our predicted moving average and you can see, very sneaky there that are close just above that blue line, that 49,059, the long-predicted 48,681, so we would like to hold above here. Just remember, Monday is not usually an accurate trading day. Whatever happens on Monday often reverses on Tuesday, then on Wednesday we see the real price again. So be cautious with this, but again we are still holding that bullish biased in Bitcoin. And again, that is another nail in the coffin, in my respectful opinion, for gold. When look at our stocks going in next week, good recovery. Once they digested that non-form payroll number a bit and they could get their head around it, then all of a sudden they realize “Well, maybe that is not such a bad thing for stocks.”, even if the fed does hike a little bit.
S&P 500 Index
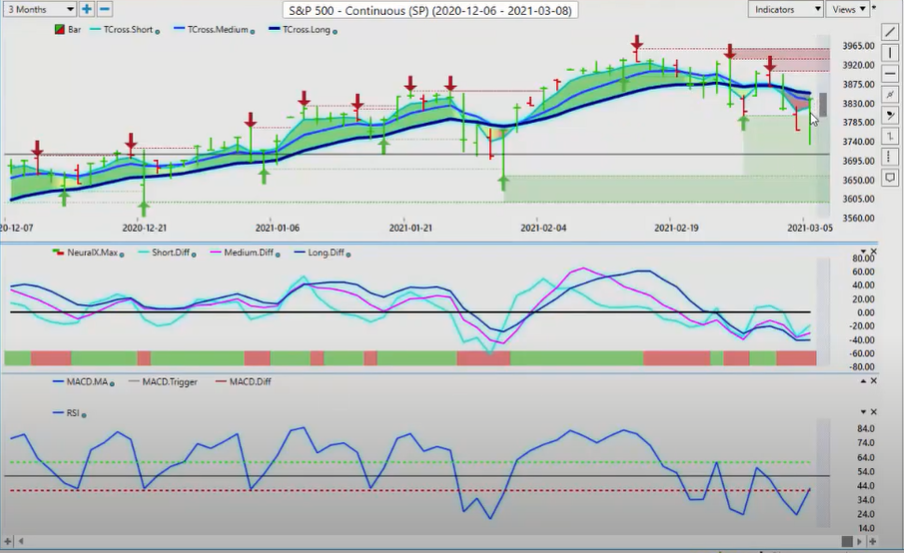
But it is showing the US economy is coming around, there is a stimulus package coming in. These are all interest rates, potentially going higher. These are all positives for the US dollar, and potentially for the S&P 500s. So what we need now is to clear the TCross.long at 3853, we are closing the week with 3839, a very very volatile week, after Thursday’s fed chair’s testimony. But again, if we click our F8 here, we can see on our F8 that we have managed to close the week just above that predicted moving average. That is a pretty impressive move there. So we will see if we can hold above 3832, but again if we have another selloff in equities on Monday, that would tell me on Tuesday, we are probably going to go higher. Now, with oil of course following, or actually leading the equity markets, oil ignored that selloff in the S&P 500, we came down. We traced exactly to the vantage point predicted moving average, coming in at 5992. But OPEC plays a part in this. From their meeting, that boosted oil prices.
Crude Oil
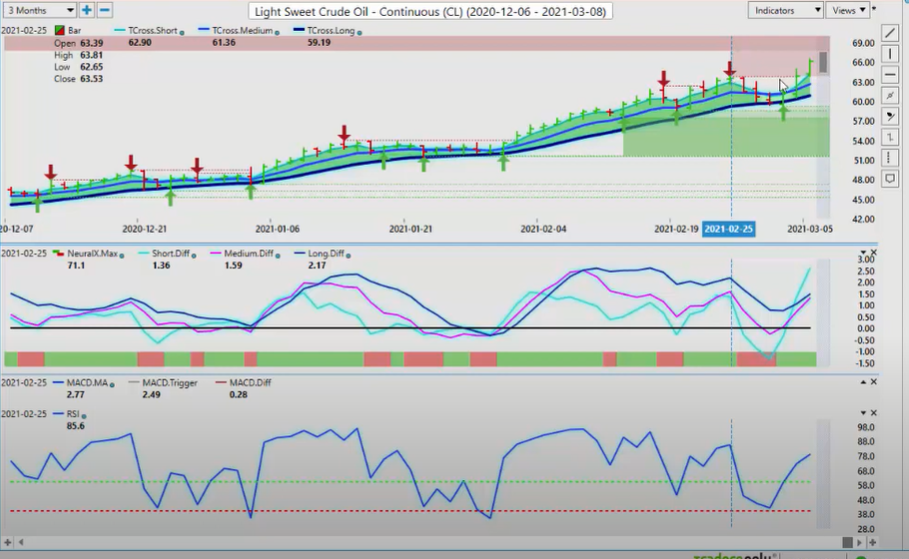
I am not 100% convinced that oil has a lot of upside from here, but we did break above our swing high, our verified resistance at 6381, but now we need a hold above 6381 to make sure that this actually is a bullish move. But it certainly looks like it after this corrective move lower, but oil will need stocks moving higher, if its going to move higher also.
Euro versus U.S. Dollar
Now as move into our main forex pairs, again the Euro-US warning that I gave everybody in last week’s forex weekly outlook that, the Euro, much like the Yen and the Swiss Franc, they are going to follow gold contracts. If gold is moving lower, that is not good for the Euro currency or the Japanese Yen or the Swiss Franc, but its really helping out the dollar here. So this bigger move, down on the Euro, was anticipated with the selloff in gold. Now we have taken out a pretty strong level here, and that this low of 1952. To start the week, we want to monitor this level very very closely, our Tcross.long is sitting at 12072, but again if we click on our F8 in our software, the long predicted at 2015. We are looking for retracement between 1952 and the 12151 to begin the week to look to reset short positions against the Euro provided gold contracts remain depressed below that 1768 mark. So again, very high correlation between the Euro and gold contract.
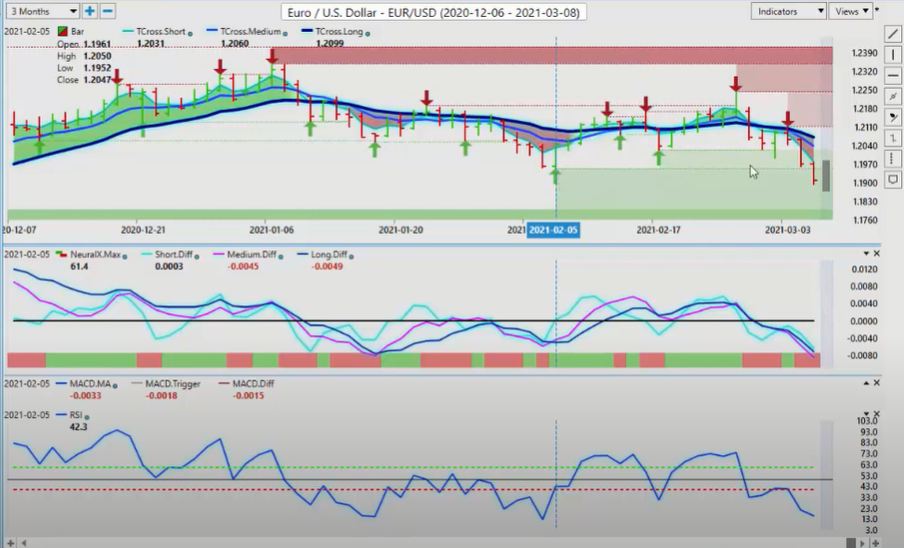
Our indicators from Vantagepoint, predicted differences are down, our MACD is crossed down and below the 0 line, RSI momentum still down. We are getting oversold here, guys. But once again, the trading overbought and oversold signals is about a 50% accurate here. Telling the market to stop going lower, and turn around and go higher. That is the basic synopsis with an oversold or overbought condition. We don’t want to do that. We want to follow the inner market correlations. We could be moving in to more of a trending move, on the Euro-US which after retracement, we could see a push into the 118117 mark, so watch that one very very closely.
Now as we look at the counter to Euro-US as US-Swiss Franc, a big move up here. But again, understanding these moves using this predicted moving averages from vantage point, and again, this key pivot levels. Now when we look at the correlation to Swiss Franc, definitely does not like gold contracts moving lower. The Swiss Franc feeds off of gold’s strength or weakness. So in this case, with gold being extremely weak, its really putting pressure onto the Swiss Franc and the dollar is making very strong gains here. Now we have moved quite a bit off our TCross.long at 9084, retracement is perfectly normal here. If we click on our F8 in our software, we can identify that key pivot level, which is coming in at 90204. Our predicted low is 9267, so if you are going long on this pair to start the week, you want to focus your levels between the predicted low and the long predicted pivot area at 90204 with a clear biased to the upside.
British Pound versus U.S. Dollar
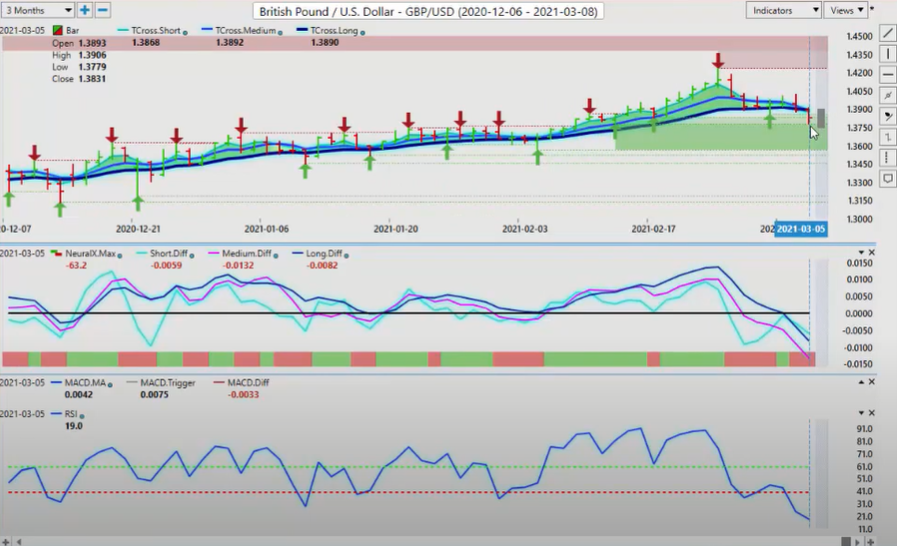
Now the British Pound, again, its coming under pressure on broad dollar strength. However, remember, the Euro-US and Great Britain-US are two completely different currency transactions now with Brexit, so we have got very strong verified support at 13775. We want to see if this level is actually going to hold here, because again, this is very significant support. We are, again, very oversold here, but this move appears to be just getting started. But what we want to watch very closely to begin the week is to see if we can actually close Monday and Tuesday above 13775. If we can, then that would breeze some life into the oversold condition of the RSI, but my optimism on that remains guarded. I think the dollar has a little bit more strength in it before we get a bounce back up on the pound. So I will watch the level between 13775 and this lower end at 13565 for the opportunity to, again, set additional long positions.
U.S. Dollar versus Japanese Yen
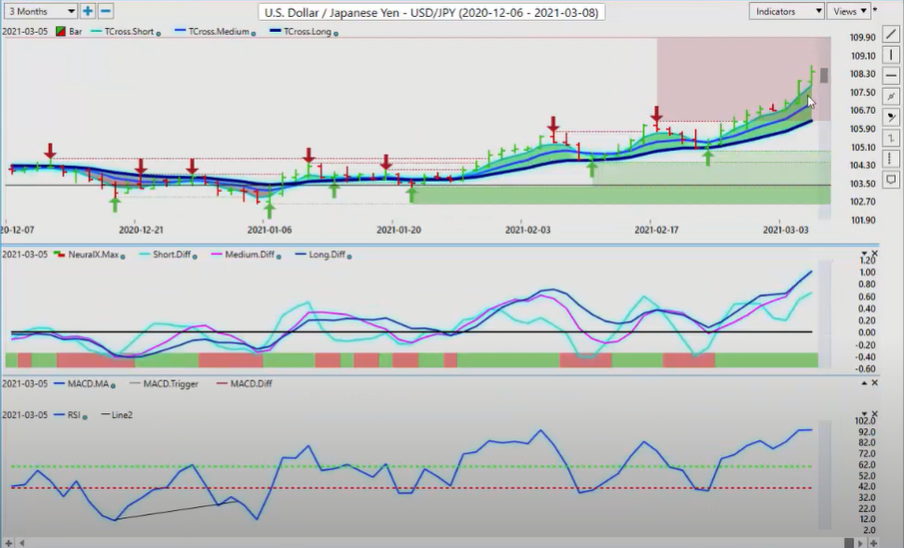
Now, with the Dollar-Yen very much a Swiss Franc trade. You can see that these two charts are almost identical. If we look at this for a minute and we look at all of the three of the predicted moving averages, we go back and have a look at the Swiss Franc, very very similar trades, almost identical I would argue. So again, if gold contracts break down and start moving towards the area that I have suggested, around that 1560 mark, then that would put the Dollar-Yen well over 110 in the coming weeks and months ahead. Same with US-Swiss Franc, they would both continue to move higher, as gold starts to plummet. Now again, this is understanding inner market correlations and how they work. They would always trump basic standard indicators, but the predictive indicators… They are a little mixed here. Predicted differences are stacked on top of each other, so any kind of retracement is perfectly normal, but these verified zones are telling me that we are likely on our way to the 110 mark.
U.S. Dollar versus Canadian Dollar
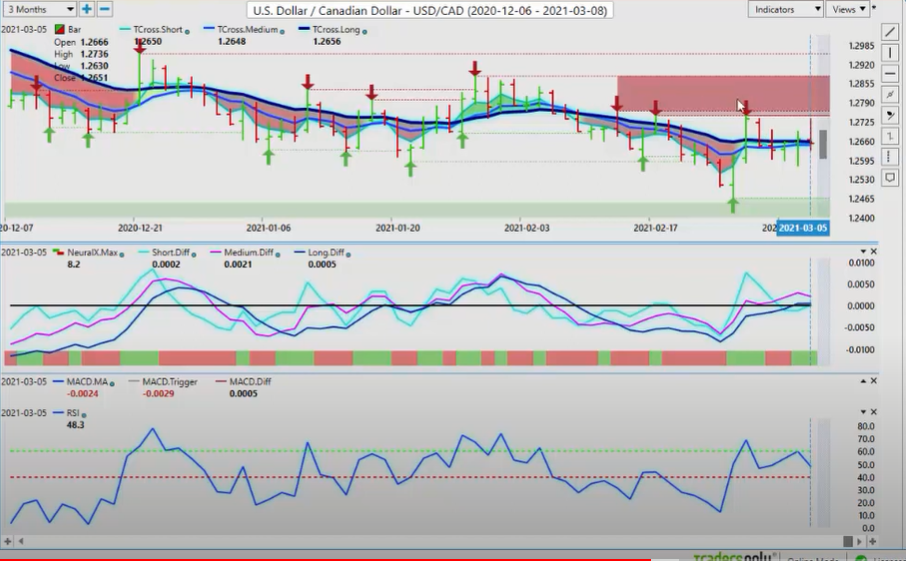
Now with US-Canada, one of the most frustrating pairs lately to trade, but these verified zones are just relentless. The market cannot get past them. Every time we come back up, you can see, we have got a lower high… A lower high, and even that one, its kind of the same but its still technically a lower high, and we are making lower lows. So my biased for this to begin the week with oil contracts at Light Sweet Crude at $66 a barrel, S&P 500 looks like its about ready to recover here. That would like to tell me that I would be looking for shorts on the US-Canadian pair around the 12720 mark, 12718, that is a reasonable trade. Now our neural index is saying the immediate move, however is going to be to the upside. 120656, rolled, tangled up in here in these predicted moving averages.
When we click on our F8, this is the level, the line in the sand to begin the week for us, 12645. If we start breaking down below that level, then we are likely going to take another run at the 12465 area. But if we can hold above 12645 then we should easily get the 12760 mark. But that is going to be a tall order, guys. If the S&P goes up, and the oil goes up, that is going to be problematic for longs on this particular pair. My biased at the current time is, at least for now, is slightly tipped to the short side. The reason I am saying that is because of Light Sweet Crude Oil contracts and the economic data coming out of Canada on Friday was a little better. But the broader way to look at this is that Canada is nothing more than a feeder fish off of the US economy. If things are looking better for the US, they are definitely going to be looking better for Canada because it is their biggest trading partner.
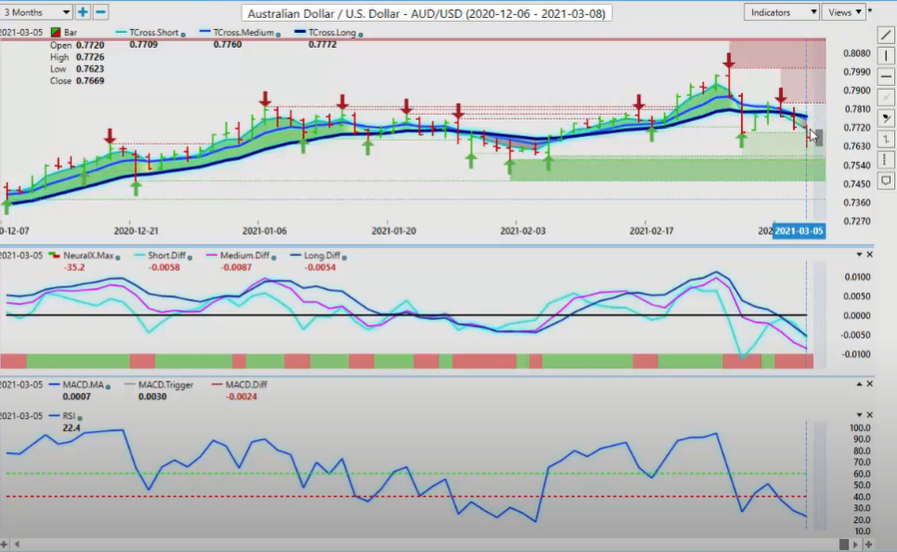
Australian Dollar versus U.S. Dollar
There could be a little tension in this new relationship, between the new administration and the administration in Canada. There is already been butting some heads over the Keystone Pipeline but we will see. Right now it looks like its a positive for Canada, with the US doing well, so go with that for now and look for a move lower. Now the Aussie and the New Zealand, both of these two currencies will, again, follow the S&P 500 above all else. So if the S&P can recover, the only thing I would exercise some caution, is that if we think the fed is getting ready to raise rates here, that is going to be a negative for the Aussie and the New Zealand, and potentially the CAD, these currencies that are following the S&P.
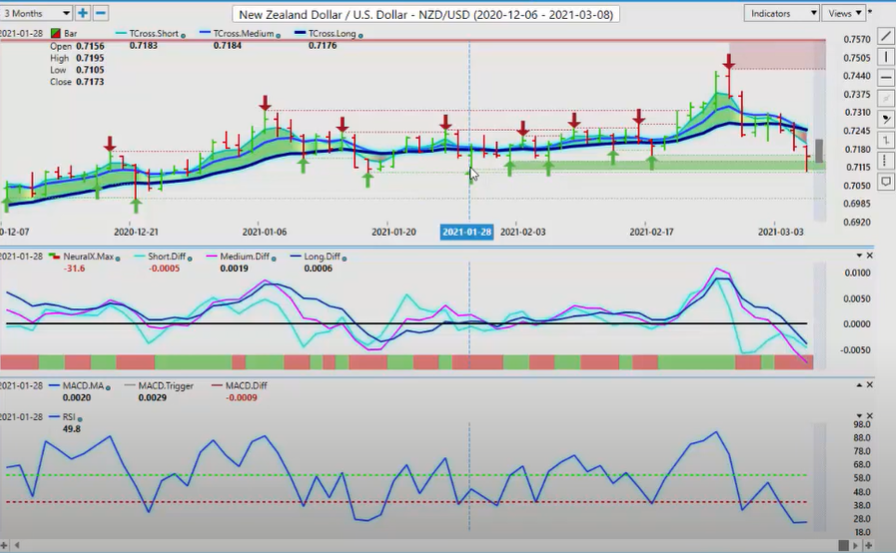
New Zealand Dollar versus U.S. Dollar
So when I am looking at this right now, to begin the week, our TCross.long, 7772, its short while below that level. But if it gets above that level, then shorts are off the table. One of the ways to gauge that, click on your F8, get that additional long predicted, 7447. If we can get back up above that, then the pressure will be off the down side. That would tell me the S&P is recovering, we are on a risk-on environment, and the dollar should soften up a little bit against the Aussie. And of course the New Zealand, we would see it soften up a bit against this pair also. But once again, very very heavy support here, guys, sitting at .7105. So we come down and kiss that level at .7100 mark on Friday. But again, only in my respectful opinion, the unemployment number was good, but always check the U6. The U6 was dead flat, so things are improving in the labor market but maybe not quite there yet. So I am expecting the dollar to soften up a little bit potentially this coming week, once everybody is in and they all kind of digest that very complex US labor report.
So with that said, this is the VantagePoint AI Market Outlook for the week of March the 8th, 2020-
Are you using A.I. yet?


