


Register for a Free Live Training
The Hot Stocks Outlook uses VantagePoint’s market forecasts that are up to 87.4% accurate, demonstrating how traders can improve their timing and direction. In this week’s video, VantagePoint Software reviews forecasts for iShares Silver Trust ($SLV), Alcoa ($AA), Reliance Steel and Aluminum ($RS), Adobe ($ADBE), Lululemon Athletica ($LULU)
VantagePoint A.I. Hot Stocks Outlook for December 19, 2025
Hello again, traders, and welcome back to the hot stocks outlook for December 19th, 2025. Hope you all have had an excellent week out there in the financial markets. And as always, we’re here to take a look at the most recent Vantage Point AI predictive forecast. So, if you haven’t already, be sure to go ahead and click the link down in the description below, and you can get signed up for a live demonstration to learn all the specifics about how these predictive indicators and technologies are helping traders navigate the financial markets.
Uh, and so we’ll go ahead and start out with shares of SLV.
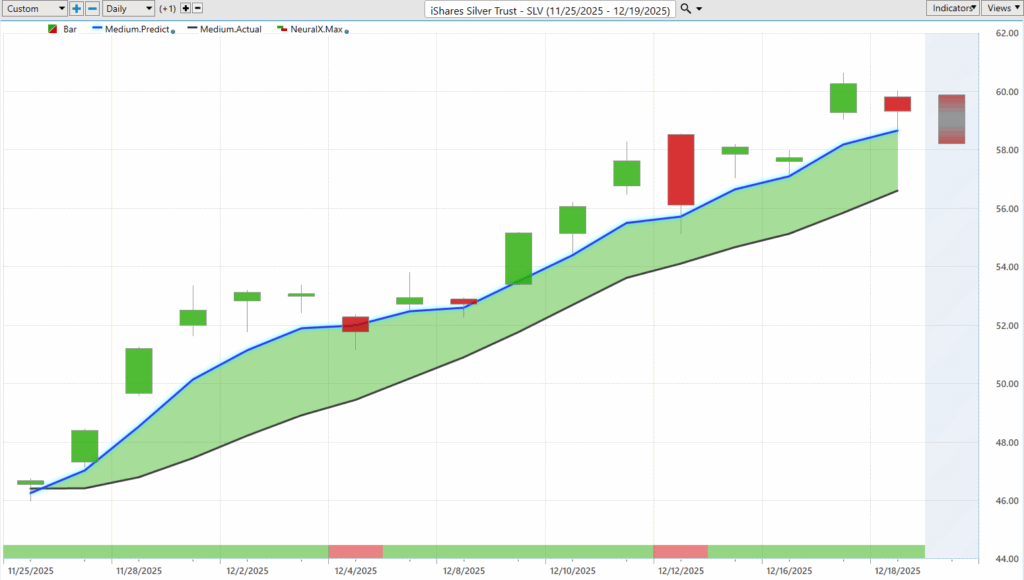
So, this really iShares Silver Trust ($SLV) models the market for silver. There’s a really great example of how all of these predictive tools work together. And so, what it is we’re looking at here is daily bars and candles, where each one of these candlesticks on the chart is going to represent a full and complete trading day. And it’s right up against that daily price action, which is really where Vantage Point works, is on end-of-day data. And it’s right up against those daily bars and candles where we’re going to have our first indicator, the predicted neural index.
And how this works is looking at this comparison between this black line value and also this blue line value. And so, what the black line on the chart is, is actually a simple moving average. So, this is a very common technical analysis tool. Uh, we really use this as our baseline. Uh, and in this case, what it’s doing is looking back at the previous 10 close prices, adding all of them together, and then dividing by 10.
And one of the major weaknesses with traditional technical indicators like this is that all the data really just reconstructs what’s already occurred in the past, right? It’s a lagging indicator and tool. And additionally, it only looks at one market in isolation. So, it really just summarizes, hey, where has SLV been in the past over the past 10 trading days?
Now, what Vantage Point’s predictive, uh, uh, moving averages are able to do is actually utilize artificial intelligence to generate a prediction of future prices looking forward into the future. And it’s doing this through intermarket analysis. And so, what that means is that really the data sets that are used to generate these predictions are not just the data coming from SLV and the silver market. It’s looking across global markets, whether that be ETF groups that look at, uh, individual stocks and mining shares. Uh, it can look at those individual equities by themselves, but it’s also looking across the global financial markets at things like the price of currencies, global interest rates, uh, and even commodities where applicable.
So obviously here, gold, silver, copper markets, all of those having an effect on where silver is headed next. And it’s utilizing those relationships, some of them being lagging, some of them leading relationships, some of them positive and inverse correlations, and using all of that data to generate highly accurate predictions on where price is headed next.
And so, whenever we get a situation where that blue line value, that predicted moving average, is moving above the actual moving average, what’s suggesting that these prices are going to start going higher. Uh, trend traders may look to take a long position if you’re a swing trader. Uh, but very clearly here saying, look, we want to bias things to the bullish side of the market.
We see since that forecast came through back on the 26th of November, silver’s up about 26% just in the past 16 trading days. Now, that’s just the Vantage Point predicted moving average, but there’s other indicators here, uh, that are utilizing that technology to solve different problems for the trader.
And so, at the very bottom of the chart, you see this bar that goes from green to red, back to green. Well, this is what’s called the Vantage Point predicted neural index, and it’s tuned to solve the problem of just very short-term strength over the next 48 hours. And it does this with a very high level of accuracy, upwards of 80-plus percent across an extremely wide range of markets.
And so, whenever that neural index is green, well, you should expect that momentum over the next couple of trading days. We can really see how this works as we go and review much of the data. Even where we get the neural index going to a red here and here, you notice the next couple of days quite subdued. But after that first day getting bullish again and starting to see things within 48 hours really start to move to the bullish side. See here, gapping up.
Now, that’s exciting. Of course, you get this 26% move understanding where that momentum is coming in. But Vantage Point also analyzes next day’s predicted high and low levels. So, what it’s doing is actually utilizing those artificial neural networks to anticipate what is tomorrow’s predicted high and predicted low level.
And what we do here in the hot stocks outlook is look back at all of these levels and see, well, how accurate have they been? And so, once you identify, hey, silver’s moving up into an uptrend here, where might you want to add to that position? Well, down at these Vantage Point predicted lows. Again, all of these levels known ahead of, uh, the next trading day.
And even here, we have a moving down to yesterday’s predicted low and silver sort of gapping up a little bit here in the morning on Friday. So, really interesting opportunity here in silver. Uh, last week we looked at some of the mining shares and XME, but clearly something going on in the metal space and a very nice opportunity as shares start to perk up to the upside.
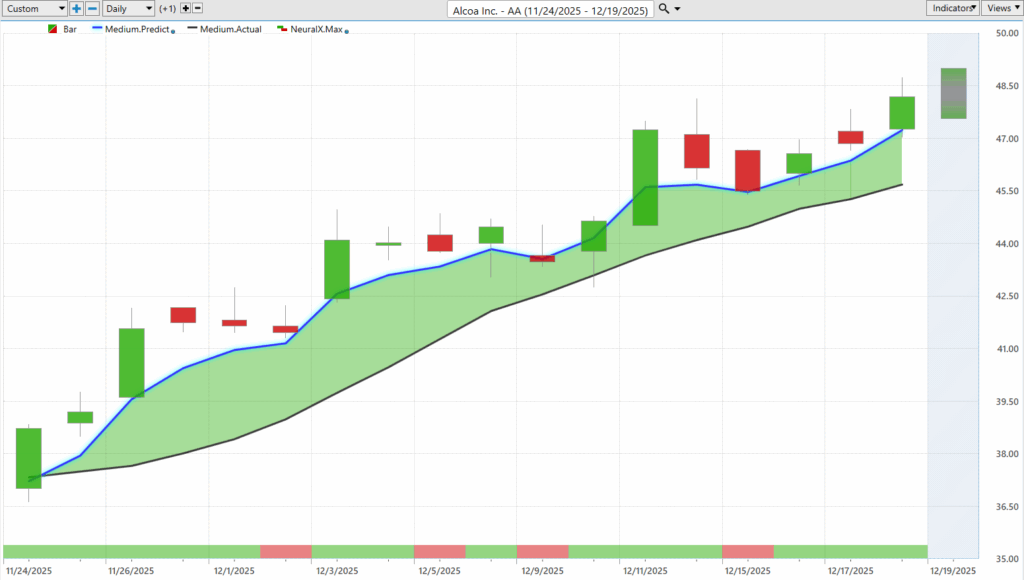
Now, Alcoa ($AA). Here’s Alcoa, uh, doing more in aluminum and steel. And here we have blue line crossing above the black line. Neural index bullish. And you see similarly a very strong push over the past several trading days.
So here, we have Alcoa up 23% just over the past 17 trading days. And notice the separation here between this predicted moving average and the actual moving average, indicating a lot of distance between that prediction of where prices are headed and where prices have been. You see this results in a very strong uptrend.
Getting a couple periods here where the neural index goes bearish, prices running sideways, but very clearly the overall trend very bullish. So, when we combine this, uh, with those Vantage Point predicted highs and lows, again, you see, hey, look to try to buy down at these predicted lows. Almost immediately, the market going higher.
Again, the market ranges a little bit here, of buying down towards these predicted lows proving to be excellent entries as this trend resumes to the bullish side. So again, about a 23% rally there, uh, just over the past few weeks of trading.
Reliance Steel and Aluminum ($RS)
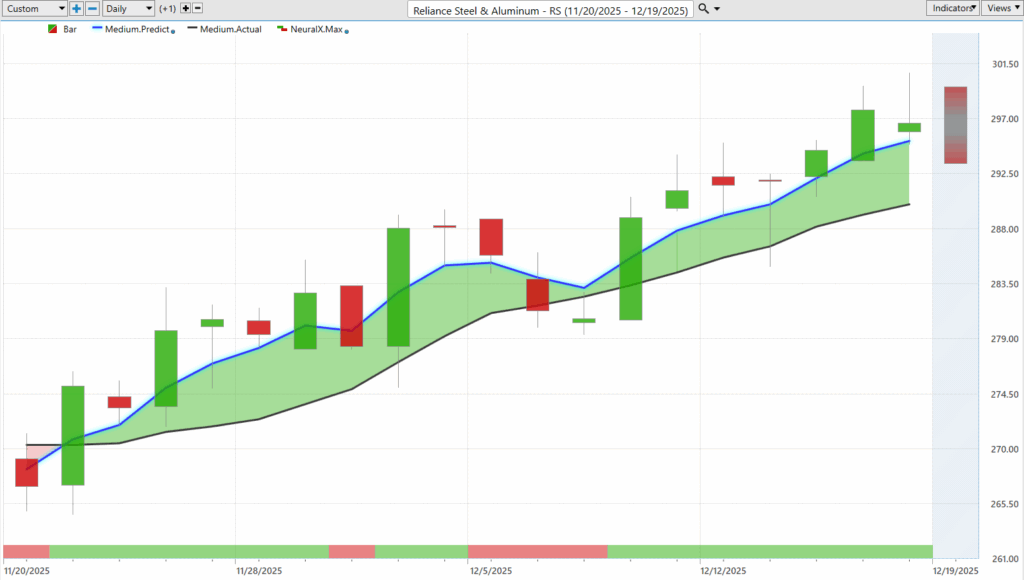
Uh, and here’s Reliance Steel and Aluminum ($RS). And so, we have some really effective tools here within Vantage Point that actually scan for where these blue lines and these predicted moving averages are moving to the bullish side. And you tend to notice patterns when we start to see things like Alcoa, Reliance Steel.
Generally, sectors start to show those bullish signals all at the same time. You really set up some processes to help you identify, hey, where are those trends getting started here? Uh, but here in Reliance Steel, again, we have that blue line crossing above the black line. Uh, the market constantly trading towards these predicted lows and within 48 hours starting to resume that bullish trend.
Uh, here, just going back to Monday, here moving down to the predicted low, uh, and trading higher up to the, you know, predicted highs here, and then trading off a little bit there. Uh, yesterday’s predicted high would be, you know, three, almost 4% move just over the past four trading days there.
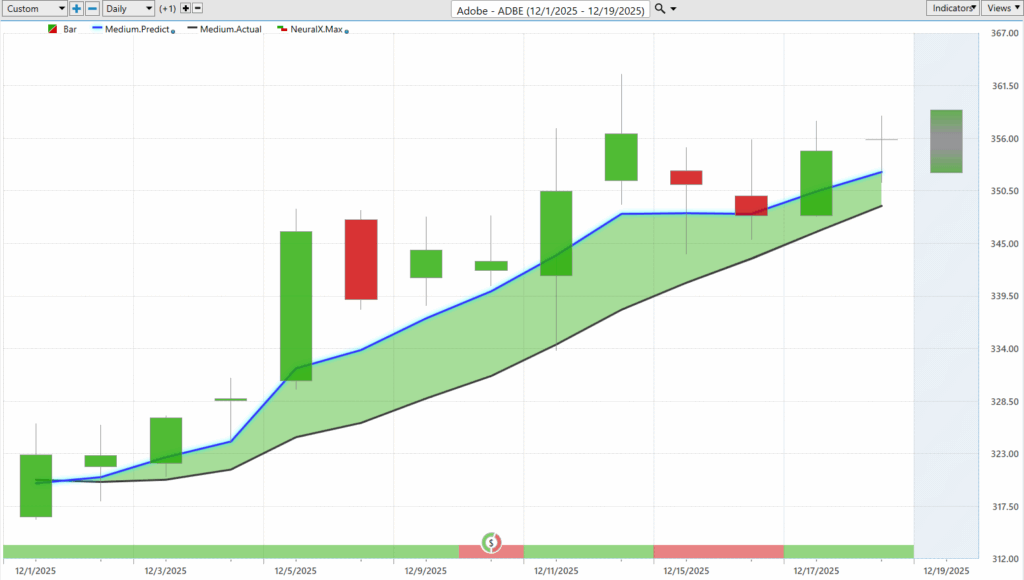
Uh, now here’s shares of Adobe ($ADBE). We’ve had some markets with some earnings reports, and this is a really good example of how when you have earnings, um, you know, you’re always going to get this sort of volatility catalyst, right? The technology isn’t really accounting for, uh, the really the kind of volume imbalance, and people come in and start trading around earnings, but the software does an excellent job at adapting.
So once you get through those earnings reports, you see the predicted highs and lows coming back online, letting you know, hey, where prices are expected to trade, accounting for that volatility or expansion of the overall range. Uh, and very clearly here, we see again, since that predicted moving average got bullish, shares are up about 10.8%.
But as we look more closely at these Vantage Point predicted highs and lows, you see you go through earnings and then the software doing a great job of identifying these very important levels. I mean, even on a day like this where previously our predicted low was down here, but look where we closed, right at that predicted low. Says, hey, expect prices to go a little bit lower here, but overall the trend still bullish here in shares of Adobe.
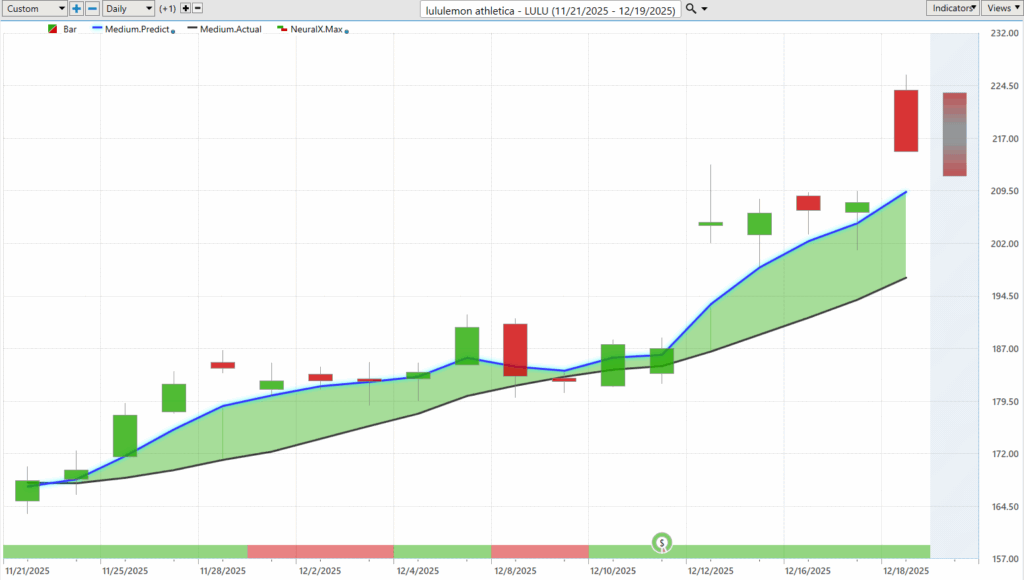
Uh, here’s Lululemon, Lululemon Athletica ($LULU), another example of, uh, these moves around earnings. So overall, very strong push here over the past few weeks since that predicted moving average got bullish.
Notice how we get this neural index going bearish here. We run a little bit sideways running into earnings. But as we take a close look at the Vantage Point predicted highs and lows, well, what are we getting? Well, some very nice levels here, even after earnings this week.
Scooting down towards these predicted low levels. Great place to be a buyer. Uh, and then seeing the market gap up. So pretty strong move here, uh, just over the week, gapping up about 11%, trading a little bit lower here, uh, yesterday, but obviously a very strong gap, about a 7% rally there, uh, just over this week from Monday and also Wednesday, down at these levels just above 200.
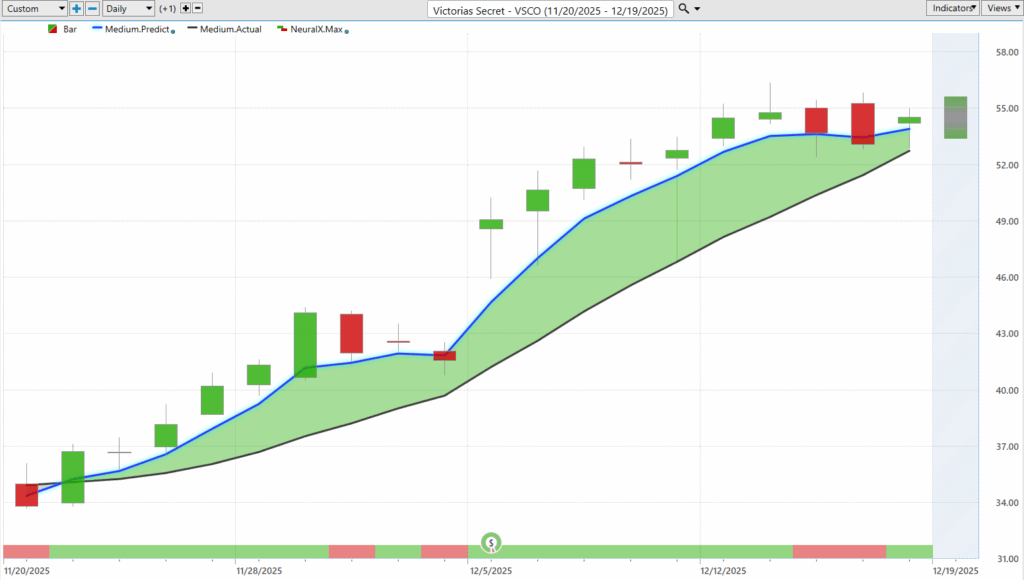
Uh, and lastly here, Victoria Secret ($VSCO). So a lot of these, uh, retailers and mall stores doing actually quite well here. Blue line over the black line. You see the neural index, it’s bearish running into earnings.
But as the trend continues, we have these tools that can help guide, uh, trading decisions here. So again, you see how we get through earnings and saying, “Okay, well, expect the market after all this noise and a big gap up to trade down towards these predicted levels,” uh, and potentially doing some short-term trading if you want to, uh, target those predicted highs or add, uh, to a trending move as a swing trade.
So, uh, really exciting opportunities here. Obviously, a lot going on in the markets. Uh, and so a great opportunity to really make sure you have the right tools going into the next trading year, uh, to really help you navigate and really execute your trading strategies effectively.
So once again, this has been the hot stocks outlook for December 19th, 2025. Thank you all for watching. Best of luck out there, and bye for now.


