The Hot Stocks Outlook uses VantagePoint’s market forecasts that are up to 87.4% accurate, demonstrating how traders can improve their timing and direction. In this week’s video, VantagePoint Software reviews forecasts for Ford (F), Gamestop ($GME), Tyson Foods (TSN), Pilgrims Pride ($PPC), Exp World Holdings ($EXPI), and Workhorse ($WKHS).
Register for a Free Live Training
Hello again, traders and welcome back to the Hot Stocks Outlook for June 11th, 2021. Hope you all are having a great week out in the financial markets, and as always, plenty to cover here in today’s outlook. We’re going to start here with shares of Workhorse Group. We’ve also got Ford Motor, GameStop, eXp World Holdings, Pilgrim’s Pride, and lastly, Tyson Foods.
And as we go through this content, I really encourage traders to go back and watch the previous videos and really highlighting how we identified really this shift that has come through really at the midpoint in May. And we talked a lot about this how we had that big drop off in the S&Ps on a Wednesday. By the next Friday and Monday, VantagePoint is providing a lot of forecasting, look to go ahead and start getting long in the market. And we’ve seen how many of the markets are really sharing that same relationship as far as that bullishness. So you can really see how we identify that, see it come through and really VantagePoint traders have the benefit of a scanning feature that really gets these things right on the radar as they occur, and as those shifts happen here.
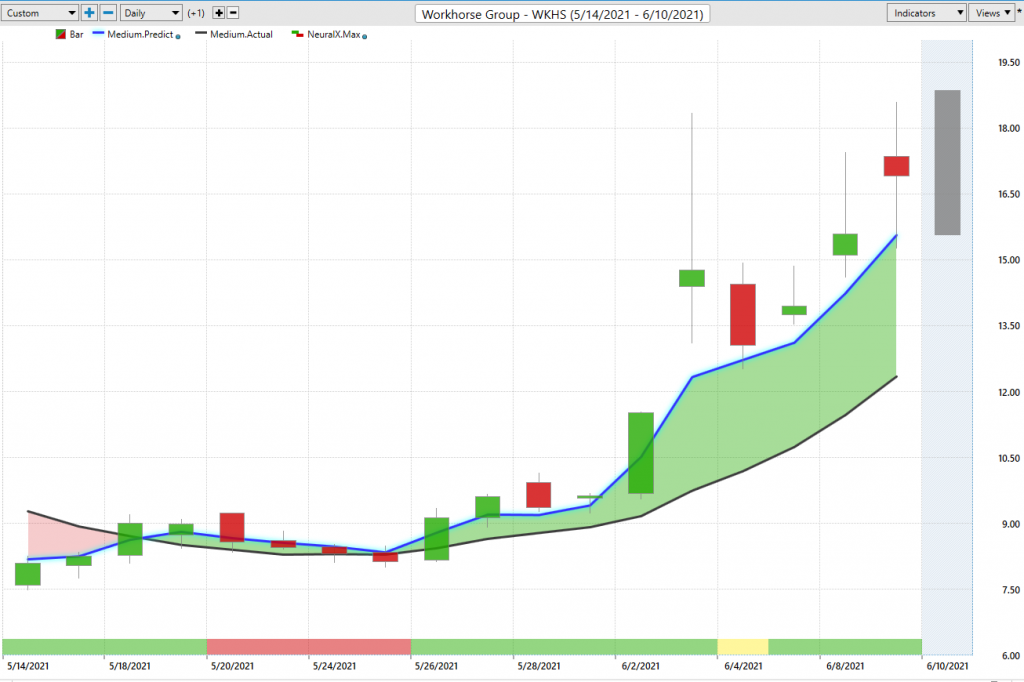
But what we’re going to do is take a look here and we see Workhorse Group, but we have here as daily price action so we can see that each one of these candles represents a full and complete trading day. And right against that daily price action you see that there is a black line and also a blue line there. Now, the black line that you’re going to see against the price data, that is a simple moving average or what we refer to as the actual simple moving average. And all it does it’s going to look back over the previous, in this case, 10 close prices, add them all together, divide by 10. And that acts as a good measure of where market prices have already been over a given period of time. It’ll smooth out the data, but obviously a trader needs to understand where are these average prices moving, going forward so we can be ahead of any sort of trend breakout or move in the marketplace.
And so what we want to do is actually compare that black value or that lagging simple moving average to this blue line. And so for that value to then get calculated and plotted against every single chart, VantagePoint is performing what’s called intermarket analysis and utilizing the technology of artificial neural networks to perform that. Now, what does that mean? Well, that means for specifically Workhorse Group, it’s going to look at different ETF groups. It’s going to look at individual stocks. It’ll look at things like the Dollar Index or global currencies. It’ll look at interest rates. It’ll look at the broader markets, the NASDAQ and the S&P.
And so what it’s able to do is really synthesize all of that information and understand how it’s going to drive and influence future price moving forward because we know Workhorse Group and you’ve seen over the past couple of weeks how many of these markets share very important correlations just with the broader markets, but then have their little nuances as far as what’s going to drive them up or down day-to-day. So when we look here at Workhorse Group that we have this blue line crossing above the black line saying average prices are going to start moving higher. And therefore, as a trader, you’d want to look for taking your strategy and executing some long positions.
Now at the bottom of the chart though, you’ll see that there’s another indicator here and this switches from red to green. And this will also update at the end of every single trading day. So this works off of end of day data. And this is also utilizing that technology of artificial neural networks, but tuned to a much shorter timeframe of really just two days of strength or weakness. You’re looking for short term strength or weakness just over the next 48 hours. But of course if there’s weakness over the next 48 hours, but the trend is up, well, you may want to be buying on the dip and using some VantagePoint tools to help you out.
Now, lastly, to really round out the entirety of the forecast is this predicted shadow candle, which is actually a prediction for the high and the low of the next trading day. And those all come in before the trading day ever occurs. So 6:00 PM the night before, you have this prediction of the daily range so that you can set limit orders, set profit targets, do what you need to do to execute your strategy. And we can actually go back and see how accurate each one of those predictions are against the actual market data. And what I just want to highlight in these, we’re going to go through all these examples and I’ll bring up these predicted highs and lows and highlight them. But just highlighting that, look, we’ve had a very bullish period in a very identifiable number of stocks that are benefiting as the S&P 500 moves higher.
And so it’s become very clear if you’re going to use short-term tools, you want to be long and look for those areas where VantagePoint is telling you, “Okay, well, from that really bottoming out period around the midpoint in May, those are the markets that really look like they’re correlating and doing well, and where we’d want to be.” So let’s look at those markets.
Well, here we have Workhorse Group. We’ve already looked at this last week and so I want to get through this quickly. But you see here, how this guide moving forward letting you know, “Look, you only want to be long taking profits on long positions.” And this thing is really started to break out. And what occurs is when you can get these really nice entries back here where not a lots going on. Well, we’ve seen volatility really start to expand further on in the trade. And that’s what gives traders the benefit of just being able to trail your stops up as long as the overall trend is continuing and VantagePoint’s saying, “Look, the trend is up remain long, then remain long.”
You’ll have the chance to take some profit, buy at predicted lows, add to the position, do all those trade management techniques. But here we got a 96% rally coming off of this whole situation that we saw in may. And what I’m going to show you here is how much of that situation is playing out and is playing out in a lot of different areas of the market. And when you notice that early, it becomes very obvious as far as what you want to do, think about your strategy or timeframe, and then go in with the help of these VantagePoint tools and execute.
Here’s Ford Motor. This is 5.14. This is literally the Friday in-between the weekends. So we go from 5.14, we switched to 5.17 here, and it’s letting you know that really after that dip on the Wednesday you want to be going into the next week long. And you see here, Ford, with again, a lot of other companies were coming through and saying something’s going on. Your VantagePoint scans were just these two days letting you know, “Look, something’s on. Look for those bullish opportunities in the marketplace.” And we’ve seen some tremendous moves, but like I mentioned when you can get in back here you see at the early part of this move, you see how the daily ranges are expanding.
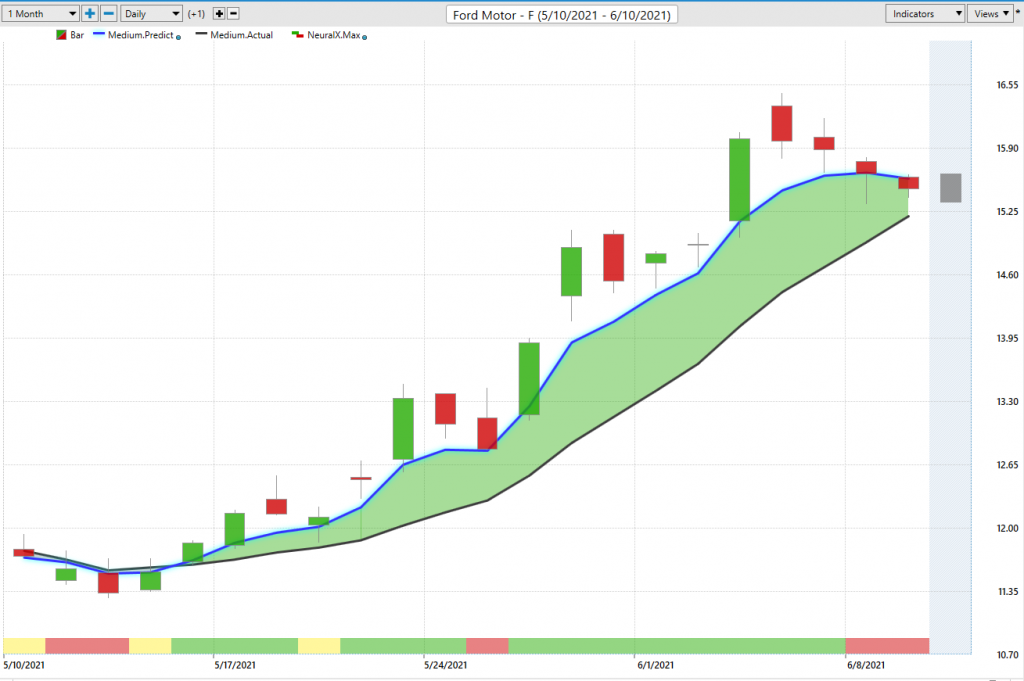
So when you get these good entries back here, you got a really nice entry, but volatility is going to pick up. And should these things really start to break out, you have the potential to make a lot of money, but don’t want to risk additional capital. You can get really nice entries, trail your stops, and if they keep trending, great. You’re going to make a lot of money and be able to manage those positions with profits. Here’s a 32% rally in Ford Motor just in the past 17 trading days. Again, recognizing where are these areas in the market where you want to get long and benefit from this few weeks that we’ve had.
It’s just been very, very clear that that’s what’s been going on, again, with the help of the IntelliScan from where this all started. Again, here, you see 5.14.
We talked about AMC and GameStop. So I bring stuff like this through because GameStop is they call it a meme stock, right? It’s highly driven by what’s going on online and what people are saying, right? Huge amounts of volatility. Well, this is almost an entire month of our forecast here in GameStop. It’s become very clear that you want to be long, take profits on longs. You see your neural index gets bearish. Here you’ll get some weakness over those subsequent 48-hour periods. But very clearly here you want to be long and taking profits on longs.
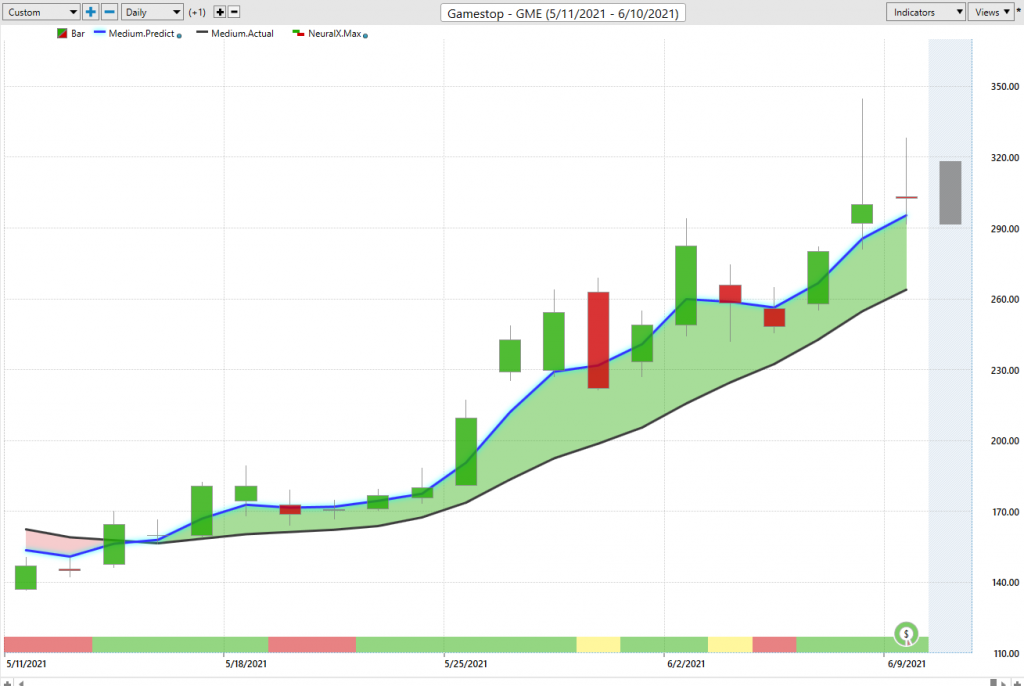
We brought this through last week and really just what I want to highlight here is let’s really take a look at this week here in GameStop, these last five trading days. And you can see that the overall volatility here, this market has moved from top to bottom 41.9%, 42% move in a five-day span. But what’s amazing here is look at the VantagePoint forecast, they’re clearly saying you only want to be long or where do you want to be a buyer? Well, ideally down at these predicted lows. I looked at this a little bit earlier, here you go. 4% outside of that predicted low, you close within the range and you see within two days, you’re blasting off. You’re not hitting these predicted lows. The overall trend is up.
But these are the kinds of things that can really make a huge difference as far as where you’re accepting prices in the market, how you’re able to potentially add to a position, because if you start this position back here on 5.19, and you’re potentially adding to the market here, adding the market here with profits. Well, my goodness, you can stand to make a tremendous amount of money, especially as we mentioned when volatility starts to pick up as those trends continue.
So 41% move just this week from those first predicted lows hit this thing again, 100%. This is two moves over this period of this mid-March reversal when we went through, again, a couple of weeks ago we looked at First Solar, American Semiconductor. That’s two markets up over 100%. American Semiconductor one day was up 30%. I mean, these things are having tremendous moves. You want to be careful, but clearly to the upside, take profits. And now we’re seeing these huge percentage moves up down all over the place as you get further extended here.
Here’s eXp World Holdings. Again, these crossovers to the upside, this whole period coming through is saying, “Look for bullishness. This is a very bullish period. Look at these things that VantagePoint is forecasting, these crossovers.” You see every single day this can’t get any more bullish from a forecast. Your 48-hour forecast is bullish. Your trend forecast is bullish. Your predicted highs and lows are creeping up every single day as the market trends higher. And again, you see that a lot of volatility, but man, you want to be buying down at these limit order levels down here and participating as the volatility takes off and the market really starts to rally once again.
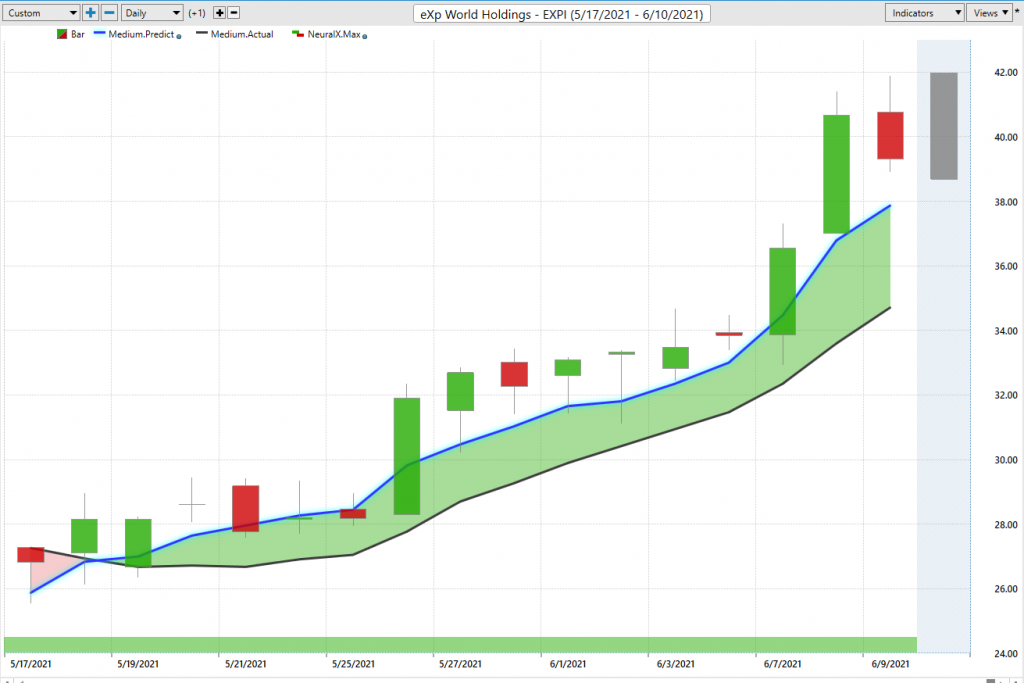
So again, here a tremendous rally here we can look at how far we’ve moved from the top here, about a 50% move. Again, seeing a lot of volatility around these stocks, but very clearly that this is the inflection point that you really wanted to identify. And if you missed it, you’ve been chasing stocks for the past few weeks and dealing with a lot of volatility, that’s certainly going to be a little bit more difficult.
Now, back to that point of we talked about the gold mining stocks a couple of months ago, actually three full months ago, Franco-Nevada bottomed out. We saw those crossovers move to the upside. Gold as well has done quite well. And we’ll see if we get another big push here with the gold market and things like that, but they’ve been trending quite a while. But you see how these correlations, so we had gold a few months ago. Here we have all these stocks moving to the upside, but here look at Pilgrim’s Pride and Tyson Foods, both chicken producers, both in obviously food production and all of this.
But very clearly you see Pilgrim’s Pride here, this is not a place we want to be in March. So we can see very clearly here on 5.24, this is crossovers to the downside, neural index bearish. And again, back to the correlations and VantagePoint does a really good job of understanding that Pilgrim’s Pride is going to share relationships with different ETFs, the S&P, the Dollar Index, and also things like Tyson Foods. And so when we look at both of these forecast and say, “Okay, well, is this really an area where we want to be in the marketplace?” Well, we can see clearly this is a great place to potentially hedge that portfolio, maybe get short in addition to those long positions, or just clearly an area to avoid.
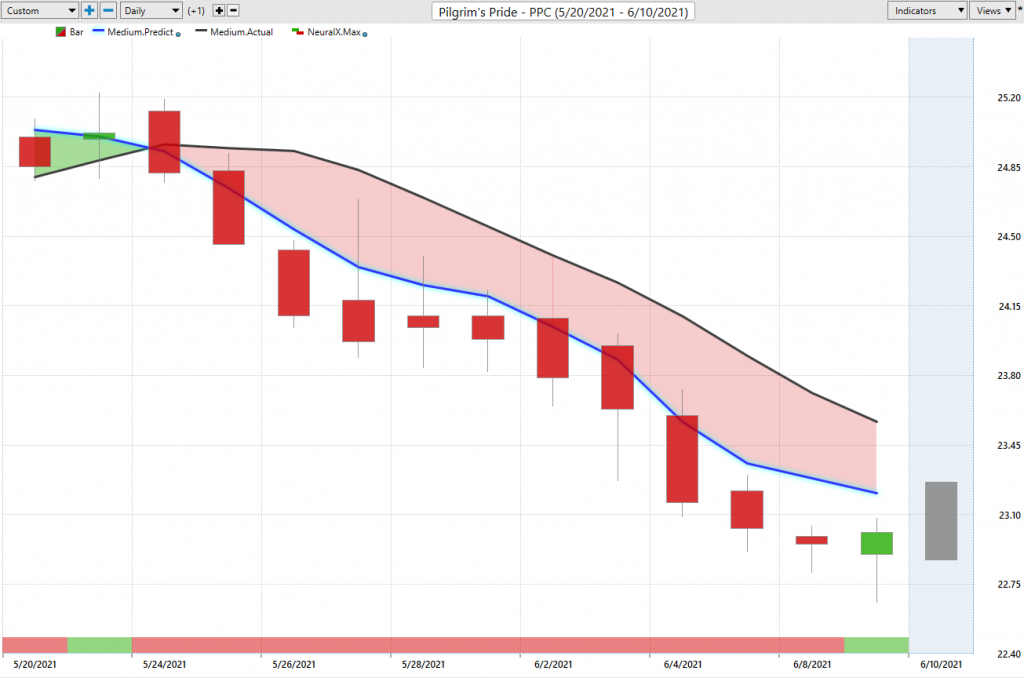
You can focus on some of those stocks that had reversed, sharing that kind of correlation as things reversed mid-May and are benefiting as the S&P and the broader markets recover.
Here we have a six and a half percent move again from that predicted low, a little bit more from where the crossovers have come through and forecast weakness, but here’s Tyson Foods. And you see a very similar situation. Very clearly here, not a place you want to be long. Your neural index gets bullish and you see those intraday higher highs over the subsequent 48 hours. But the overall trend is clearly down, especially when you look at this and say, “Okay, well, Pilgrim’s Pride is very weak. Tyson Foods.”
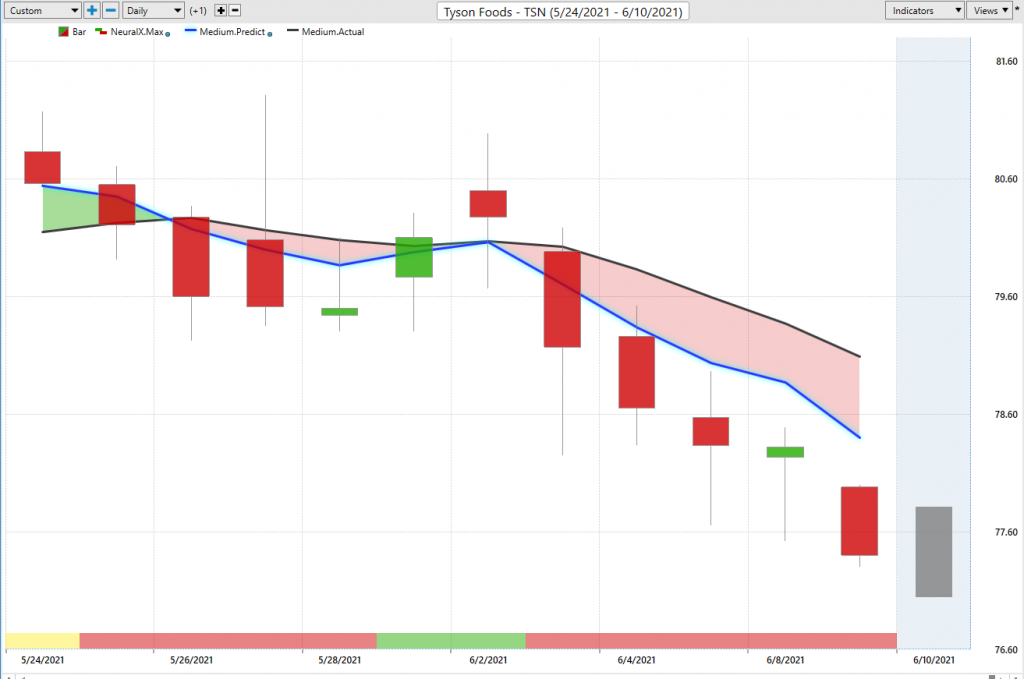
Clearly this is an area where we don’t want to be long and there’s some weakness, but I’m just bringing us through that, yeah, it’s not exciting, a 4% move to the downside. But we’ve seen these play out and this is where the IntelliScan helps you see those right as they happen and right as they’re playing out so you can understand that these are markets that are on my shortlist to take bullish opportunities, buy at predicted lows, execute those strategies. These are on a bearish list in addition to things like gold in the commodity markets and things that are going on over there.
So again, running a little long here, but just wanting to go over this information and just highlight again how we’ve seen this pivot. And for traders to really have a really clean view of what’s happening, where it’s happening and how they might want to execute those strategies. That’s when the IntelliScan comes in and helps us see these bigger shifts in big sectors of the market, as well as the wider macro markets as well. So once again, this has been our Hot Stocks Outlook for June 11th, 2021. Thank you all for watching. Best of luck out there. Thanks again and bye for now.