Weekly Stock Study Home Depot (HD)
This week’s stock analysis is Home Depot (HD).
The Home Depot, Inc., commonly known as Home Depot, is the largest home improvement retailer in the United States, supplying tools, construction products, and services. The company is headquartered in incorporated Cobb County, Georgia.
It operates many big-box format stores across the United States (including the District of Columbia, Guam, Puerto Rico, and the U.S. Virgin Islands); all 10 provinces of Canada; and the 31 Mexican states and Mexico City. MRO company Interline Brands (now The Home Depot Pro) is also owned by The Home Depot, with 70 distribution centers across the United States.
Home Depot operates more than 2,200 Home Depot stores across the U.S., Canada and Mexico. It began its exponential trajectory with two store openings in 1979. Its backstory of offering a “large variety of merchandise at low prices with highly-trained staff” sparked a huge interest and a very loyal following accompanied by a massive stock move. Had you invested $1,000 in Home Depot at its IPO on September 22, 1981 and reinvested dividends and held it till today it would be worth over $12.5 million.
30 Wall Street analysts have issued ratings and price targets for The Home Depot in the last 12 months. Their average twelve-month price target is $296.26, predicting that the stock has a possible upside of 1.20%. The high price target for HD is $350.00 and the low price target for HD is $215.00. There are currently five hold ratings and 25 buy ratings for the stock, resulting in a consensus rating of “Buy.” Power Traders love to see this type of divergent opinion on a stock that is widely traded.
On Feb. 23, the company reported better-than-expected Q4 earnings and sales results. Home Depot earnings grew 16% to $2.65 a share. Revenue rose 25% to $32.26 billion. Same-store sales surged 24.5%, with U.S. comparables up 25%.
Home Depot (HD) has made many millionaires of shareholders, with a stock price that has more than doubled in the past five years. That does not mean it will continue that upward trajectory indefinitely. Analysts feel that Home Depot has a fence to keep Amazon at bay. This opinion is what has many analysts feeling that HD promises more upside potential. Home Depot management has focused on creating a brand that is the go-to choice for pros looking to get the job done. Home Depot has also focused on building out its ecommerce platform to be able to deliver the parts curbside or by mail for those who do not want to come into the store. Keeping Amazon out of a leadership position in the hardware market is the tailwind that is making Home Depot rise in price.
Over the last 52 weeks HD has traded as high as 296.78 and as low as 174. This means provides us with an annual trading range of $122.78. When we divide this metric by 52 weeks we can determine that the average weekly trading range for CHD is roughly $2.36. We refer to these as the commonsense metrics which we use as baseline measurements of understanding normal value. When using artificial intelligence we look to amplify our returns based upon these baseline measurements.
Whenever we trade, we always pay attention to where we are in relation to the 52 week trading range. It is very common to see the 52 week high provide very strong resistance to the market until it is breached. Often when the 52 week high is breached, we will see the stock price explode higher very quickly over a very short period of time.
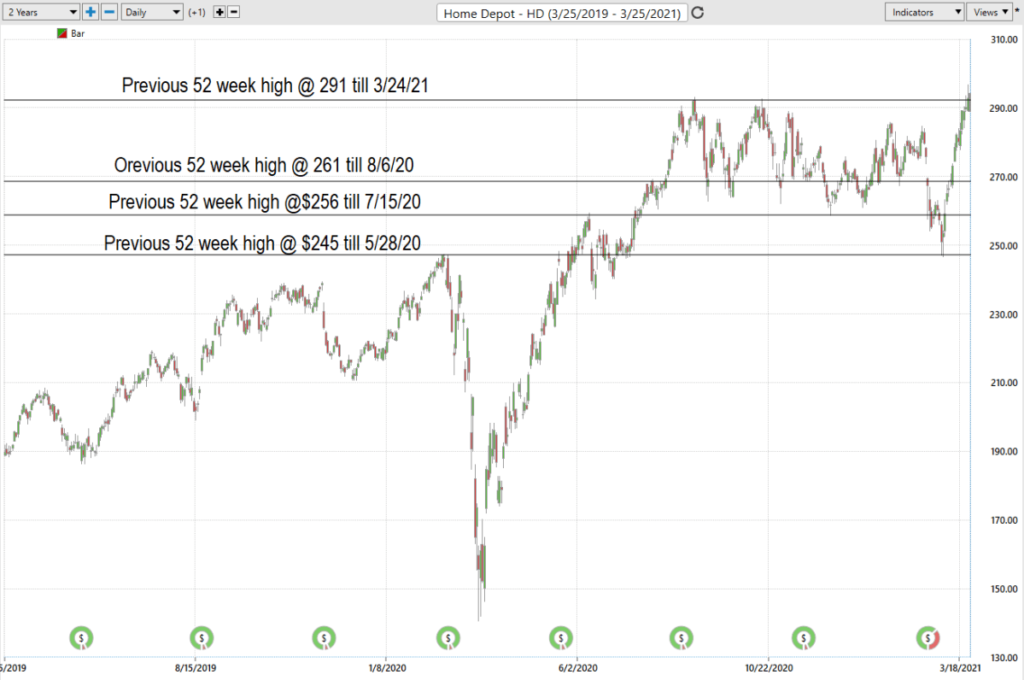
The adage in trading that is very workable is that old resistance becomes new support. This perspective worked extremely well in navigating Home Depot over the last year.
Home Depot was crushed like most stocks with the economic lockdown in March 2020 but rallied strong off its lows on March 18, 2020. The most recent 52 week high at $291 has acted as solid resistance since August 2020. We have recently breached this area and the stock is testing that level to see if it will act as new support moving forward. During the coronavirus stock market crash, Home Depot stock traded as much as 43% off its 52-week high. But amid the current uptrend, shares of the retailer are trying to establish support at its recent 52 week high.
We strongly advise that traders pay primary attention to where we are in the 52 week trading range whenever we look to trade a stock. While many traders look to buy low and sell high, we have found that in trading there is huge opportunity to focus on finding strong trends and buy high and sell higher. This is a trading mindset change that requires that a trader change the way they perceive opportunity in the markets.
The Vantagepoint A.I. Analysis
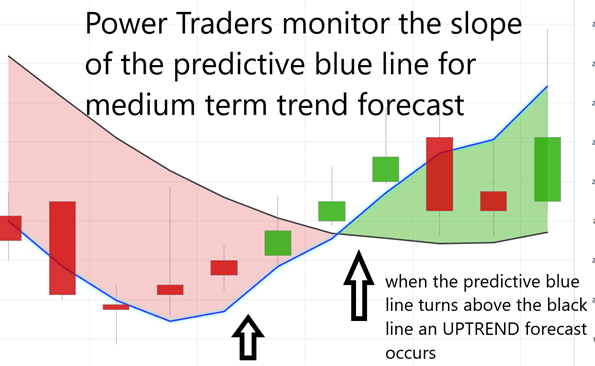
Using VantagePoint Software and the artificial intelligence within, traders are alerted to trend forecasts by monitoring the slope of the predictive blue line. The black line is a simple 10 day moving average of price which simply tells you what has occurred in the market. The predictive blue line also acts as value zone where in uptrends traders try to purchase the asset at or below the blue line.
In studying the chart below pay close attention to the relationship between the black line and predictive blue line. The black line is just a simple 10 day moving average. It Is calculated by taking the closing prices of the last 10 days and dividing that sum by 10. All that the black line tells you is what has occurred. It tells you where prices have been and what the average price over the last ten days is.
The predictive blue line, on the other hand utilizes that Vantagepoint patented Neural Network and Intermarket Analysis to arrive at its value. It looks at the strongest price drivers of an asset through artificial intelligence and statistical correlations to determine its value.
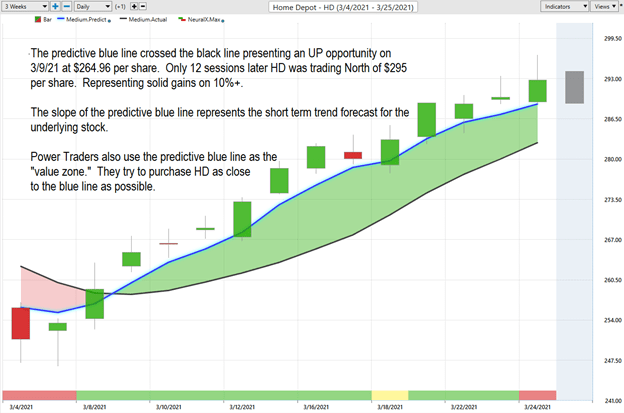
Whenever we see the predictive blue line move above the black line we are presented with an entry opportunity. This is what occurred on March 9th, 2021 at $264.96 per share.
Power traders use the predictive blue line in helping to determine both the value zone as well as the trend direction.
Observe how the SLOPE of the predictive bleu line started moving higher a few days previous to its moving above the black line. Over the last ten trading sessions HD has moved up 10.52% or $27.84 per share.
Fine Tuning Entries with the Neural Net Indicator
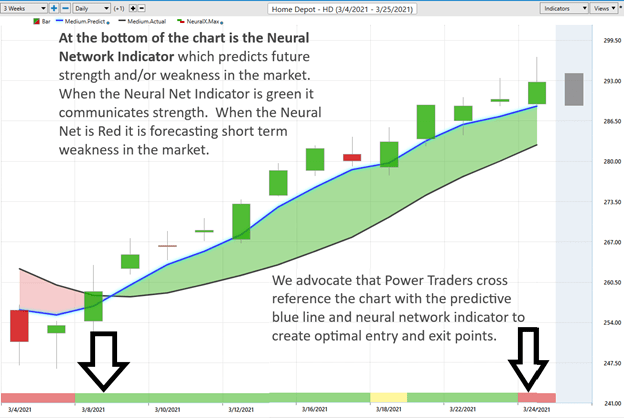
At the bottom of the chart is the Neural Network Indicator which predicts future strength and/or weakness in the market. When the Neural Net Indicator is green, it communicates strength. When the Neural Net is red, it is forecasting short term weakness in the market.
We advocate that Power Traders cross-reference the chart with the predictive blue line and neural network indicator to create optimal entry and exit points.
Power Traders are always looking to apply both the neural network and A.I. to the markets to find statistically sound trading opportunities.
VantagePoint Software Daily Price Range Prediction
One of the powerful features in the VantagePoint Software which Power Traders use on a daily basis is the Price Range prediction forecast.
This forecast is what permits Power Traders to truly fine-tune their entries and exits into the market.
At 6;30pm after the market close the software updates and all of the price predictions change based upon what the machine learning, A.I., neural networks and Intermarket analysis anticipate moving forward.
Here is the price chart of HD during the most recent runup featuring the Daily Price Range forecast and the Neural Net Indicator.
In summary, the trend turned up. Prices have surged since that forecast and the trend remains firmly UP. Traders have had numerous opportunities to purchase HD at the lower end of the daily price forecast to fine tune their entries.
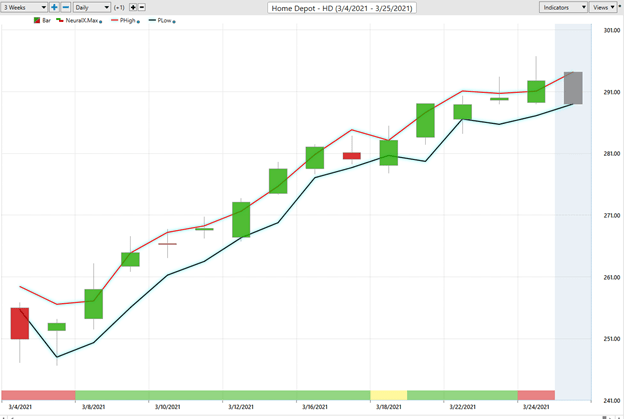
Power Traders use a price level below the predictive low price to place their protective sell stops in the market in case a sudden reversal was to occur. Observe how the predictive price low also provided numerous short-term entry opportunities for traders to buy HD as it was trending higher.
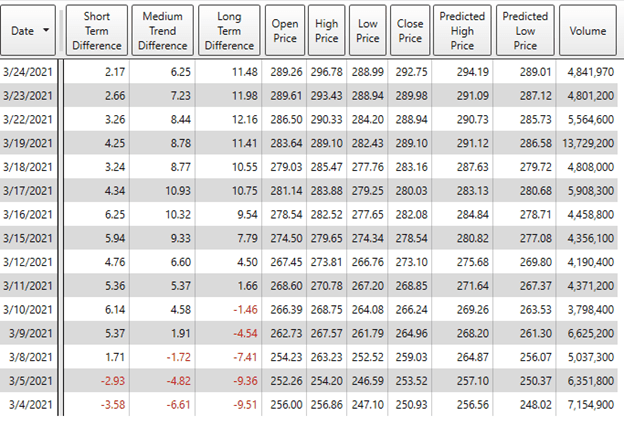
This information can also be presented in a tabular format which is very helpful for analytical traders who want to add their own flavor to a trading opportunity.
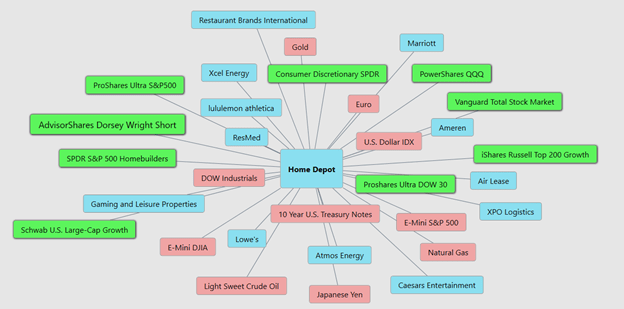
Intermarket Analysis
Studying the charts can always provide objective realities in terms of locating support and resistance levels which become very clear on a chart. But we live in a global marketplace. Everything is interconnected. The billion-dollar question for traders is always what are the key drivers of price for the underlying asset that I am trading?
These intangibles are invisible to the naked eye yet are responsible for driving prices. These markets show very high statistical correlations.
Small changes in Interest rates, Crude Oil Prices, and the Volatility of the dollar amongst thousands of other variables affect the decisions companies must make to survive in these very challenging times. Trying to determine what these factors are is one of the huge problems facing investors and traders.
There is great value to be had in studying and understanding the key drivers of HD price action. the universe and the most statistically correlated assets. These factors are all displayed from a standpoint of statistical correlations which show the strongest interconnectedness of prices.
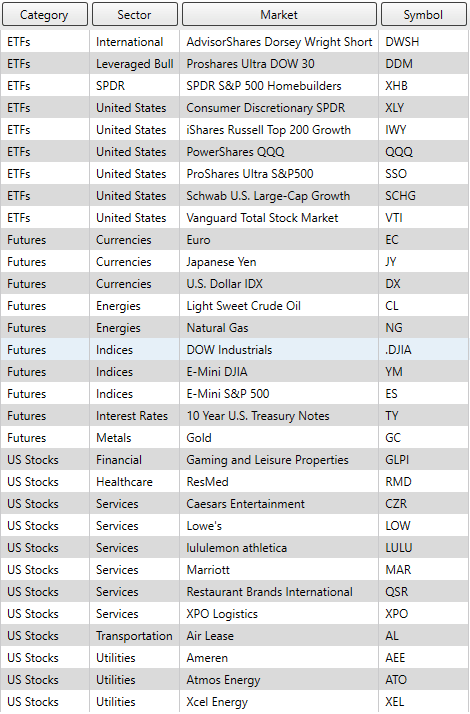
This information can also be displayed in a tabular format allowing you to dig into the correlations and do further research on the ETF’s, stocks and futures that are the key drivers of Home Depot’s price.
Our suggestion – HD is fairly valued at the present time, but the trend is firmly up. The consensus of analysts’ opinions shows that HD is fairly valued around $295. Power Traders are in at lower prices and are placing their protective stops below the bottom of the predictive low channel. HD is a great swing trading stock. We have it firmly on the radar and look to buy weakness when the a.i forecasting that uptrends are on the horizon.
People are spending more time at home during the pandemic, and that has in part led to a surge in the desire to own rather than rent. It has also led more people to remodel and rebuild their living spaces as affordably as possible. Home Depot has a huge advantage that Amazon is finding challenging to beat. Hardware and home goods type of products make it more likely that people will want to buy in-store, or pick up there shortly after ordering online.
For instance, if you need to unclog your toilet, you’d more likely to want to go to Home Depot than wait for Amazon to deliver it, even if you have the Prime membership. The 2,293 Home Depot locations it has in operation, is likely to keep Amazon at a safe distance.
Our advice: Follow the A.I. trend analysis and practice good money management on all your trades. HD deserves to be on your trading radar.
Let’s Be Careful Out There!
Remember, It’s Not Magic.
It’s Machine Learning.
Disclaimer: THERE IS A HIGH DEGREE OF RISK INVOLVED IN TRADING. IT IS NOT PRUDENT OR ADVISABLE TO MAKE TRADING DECISIONS THAT ARE BEYOND YOUR FINANCIAL MEANS OR INVOLVE TRADING CAPITAL THAT YOU ARE NOT WILLING AND CAPABLE OF LOSING.
VANTAGEPOINT’S MARKETING CAMPAIGNS, OF ANY KIND, DO NOT CONSTITUTE TRADING ADVICE OR AN ENDORSEMENT OR RECOMMENDATION BY VANTAGEPOINT AI OR ANY ASSOCIATED AFFILIATES OF ANY TRADING METHODS, PROGRAMS, SYSTEMS OR ROUTINES. VANTAGEPOINT’S PERSONNEL ARE NOT LICENSED BROKERS OR ADVISORS AND DO NOT OFFER TRADING ADVICE.