
Weekly Stock Study McCormick and Company (MKC)
This week’s stock analysis is McCormick and Company (MKC).
McCormick & Company, Inc manufactures, markets, and distributes spices, seasoning mixes, condiments and other flavorful products to the food industry retailers, food manufacturers and foodservice businesses.
The Company operates in two business segments: Consumer and Flavor Solutions. The company was founded in 1889 and is headquartered in Hunt Valley, Maryland.
MKC is a stock that is very popular with investors and hedge funds. McCormick & Company, Incorporated is scheduled to release its next quarterly earnings announcement on Thursday, June 24th, 2021. The company reported $0.72 earnings per share for the quarter, topping the Zacks’ consensus estimate of $0.58 by $0.14. The business earned $1.48 billion during the quarter, compared to analysts’ expectations of $1.37 billion. McCormick & Company, Incorporated had a net margin of 13.75% and a trailing twelve-month return on equity of 20.93%. During the same quarter in the previous year, the business posted $0.54 earnings per share which also was above analysts’ expectations.
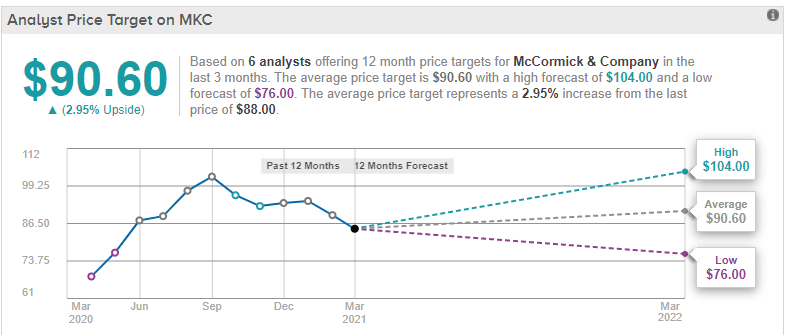
Based on 6 analysts offering 12 month price targets for McCormick & Company in the last 3 months. The average price target is $90.60 with a high forecast of $104.00 and a low forecast of $76.00. The average price target represents a 2.60% increase from the current price of $88.30. Power Traders like to see this wide divergence in opinion among analysts as it creates great trading opportunities when the artificial intelligence creates a trend forecast.
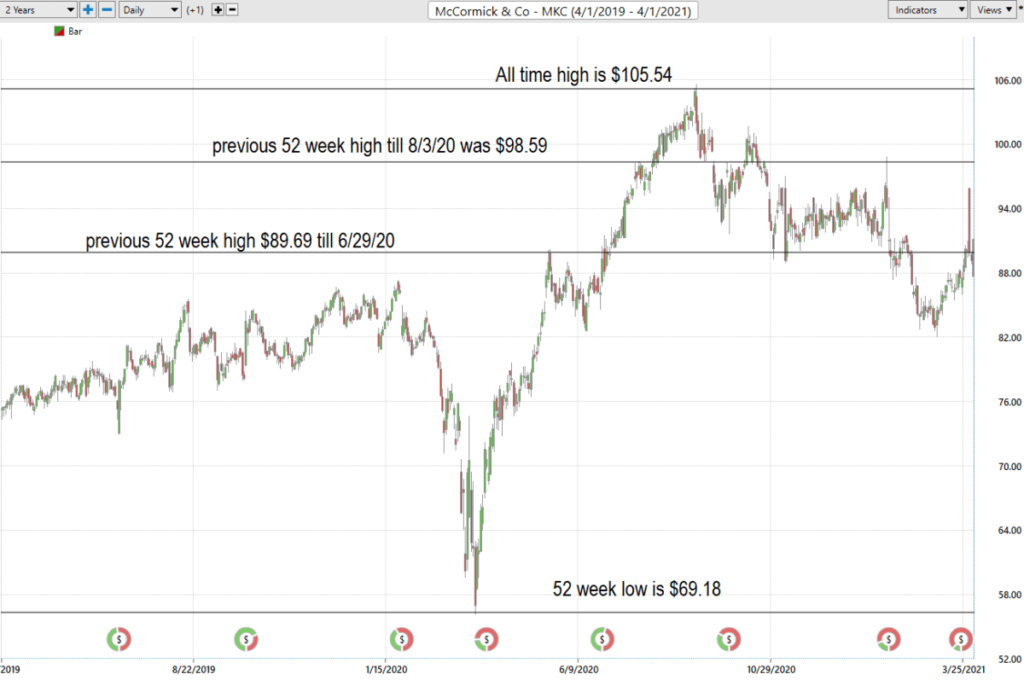
Over the last 52 weeks MKC has traded as high as $105.54 and as low as $69.18. This provides us with an annual trading range of $36.36. When we divide this metric by 52 weeks we can determine that the average weekly trading range for MKC is roughly $.69. We refer to these as the common-sense metrics which we use as baseline measurements of understanding normal value. When using artificial intelligence, we look to amplify our returns based upon these baseline measurements.
Whenever we trade we always pay attention to where we are in relation to the 52-week trading range. It is very common to see the 52 week high provide very strong resistance to the market until it is breached. Often, when the 52 week high is breached, we will see the stock price explode higher very quickly over a very short period of time.
Here is the chart of MKC over the past two years. Notice how until recently simply trading a breach of the 52-week high would see profits accumulate very quickly. Most recently MKC encountered resistance at its most recent 52-week high at 105.54 and slid BELOW its previous 52 week high boundaries. This is a clear indication that the stock was seeking to find an area of support and consolidation before any further rally could occur.
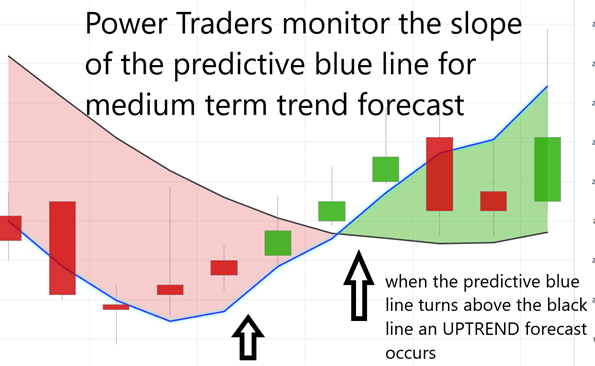
Whenever we look at a stock forecast, we always are comparing what the stock has done, to the artificial intelligence, which is computing its forecast based upon a proprietary intermarket analysis of the most closely correlated assets as well as a neural network comparison. The key to the VantagePoint analysis is the predictive blue line. The slope and general direction of the blue line determines the medium forecast for the market.
The Vantagepoint Software has three separate modules which create a forecast for a Power Trader. They are the predictive blue line, the Neural Net and the Intermarket Analysis.
The software focuses on the daily price action. You’ll see that there’s a black line and also a blue line right up against the price data on the chart.
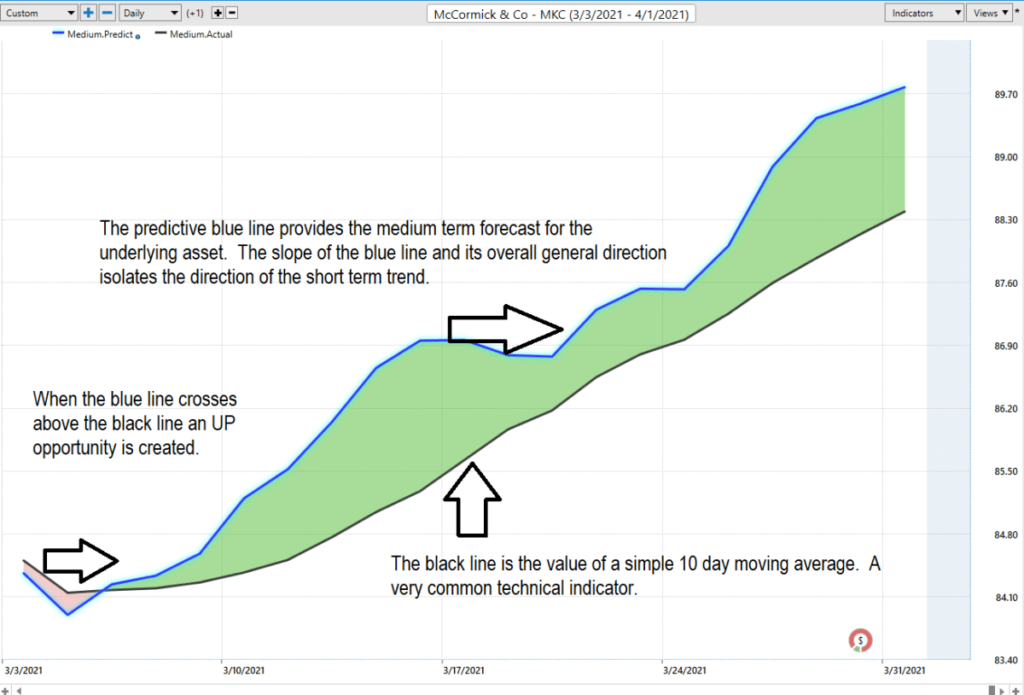
The black line that you see is a regular simple 10 period moving average. A very common technical indicator. And it’s a good measure to go ahead and smooth out the price data and it gives us an indication of where market prices have been over a given period of time. But obviously, as traders we really need to understand is where our market price is moving going forward.
So, what we want to do is compare that black line value on the chart to the predictive blue line, which is VantagePoint’s predictive indicator. What it does is VantagePoint is utilizing its technology to perform what’s called Intermarket analysis. So that means that there are known relationships as far as those neural networks are concerned that affect and drive the future price of McCormick & Company. That’s going to be things like broad ETF groups. Things like the S&P 500 or the Russell 2000 or the NASDAQ. Things like global currencies or global interest rates, or futures and commodity markets.
What the A.I. is able to do is understand those relationships and what’s driving the future price of the target market that you might be trading and generating future price predictions of where prices are likely to move. Is also and utilizes those predictions to construct these indicators that you see against the charts. In effect, turning what was a lagging tool (that’s really only summarizing past data and past closes of what’s already occurred in the market) into a forward-looking predictive tool.
Whenever we have this blue line crossing above the black line it’s really suggesting average prices are expected to start moving higher and you, therefore, would likely look for long positions in the market.
The Vantagepoint A.I. Analysis
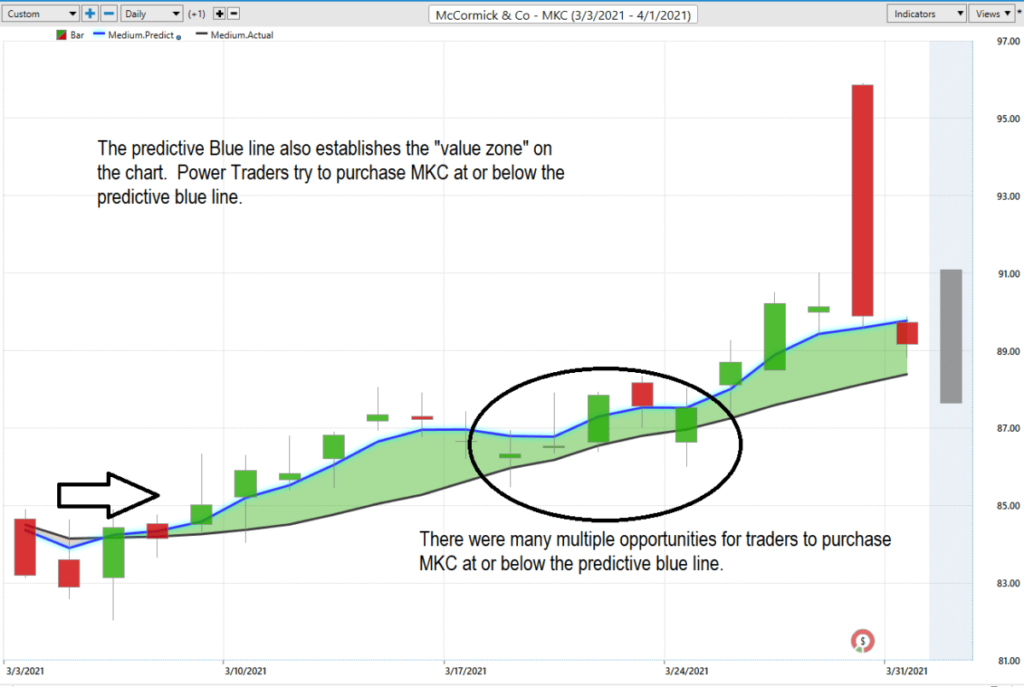
The predictive blue line also acts as value zone where in uptrends traders try to purchase the asset at or below the blue line.
In studying the MKC chart above pay close attention to the relationship between the black line and predictive blue line. The black line is just a simple 10 day moving average. It is calculated by taking the closing prices of the last 10 days and dividing that sum by 10. All that the black line tells you is what has occurred. It tells you where prices have been and what the average price over the last ten days is.
The predictive blue line, on the other hand utilizes that Vantagepoint patented Neural Network and Intermarket Analysis to arrive at its value. It looks at the strongest price drivers of an asset through artificial intelligence and statistical correlations to determine its value.
Power traders use the predictive blue line in helping to determine both the value zone as well as the trend direction.
Observe how the SLOPE of the predictive blue line started moving higher a few days previous to its moving above the black line. Over the last 18 trading sessions, MKC has moved up $4.67 per share or 5.53%. However, there were numerous opportunities to purchase it lower and sell it higher than this broad benchmark.
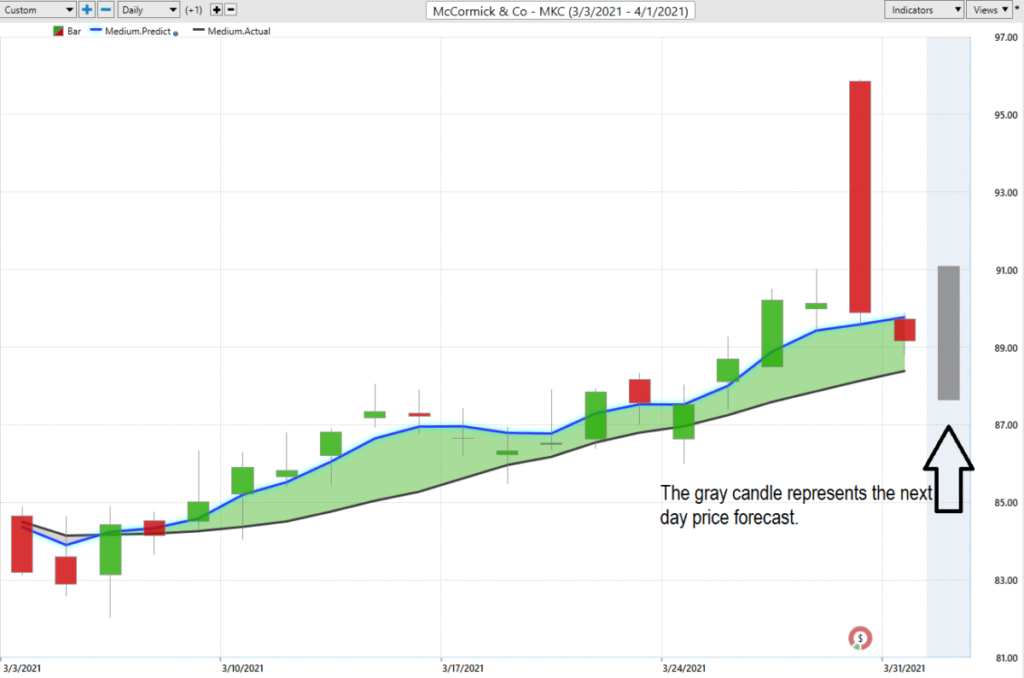
If you look at the very right-hand side of the chart, you’ll see that there is what we call a predicted candle. That’s actually a predicted high and a predicted low for the next trading day. Therefore, you actually get an overall trend prediction, short-term strength or weakness, and this predicted high and low. And what happens is you have these separate neural networks really doing all of this and looking at these different sorts of timeframes and making the most robust indicator possible.
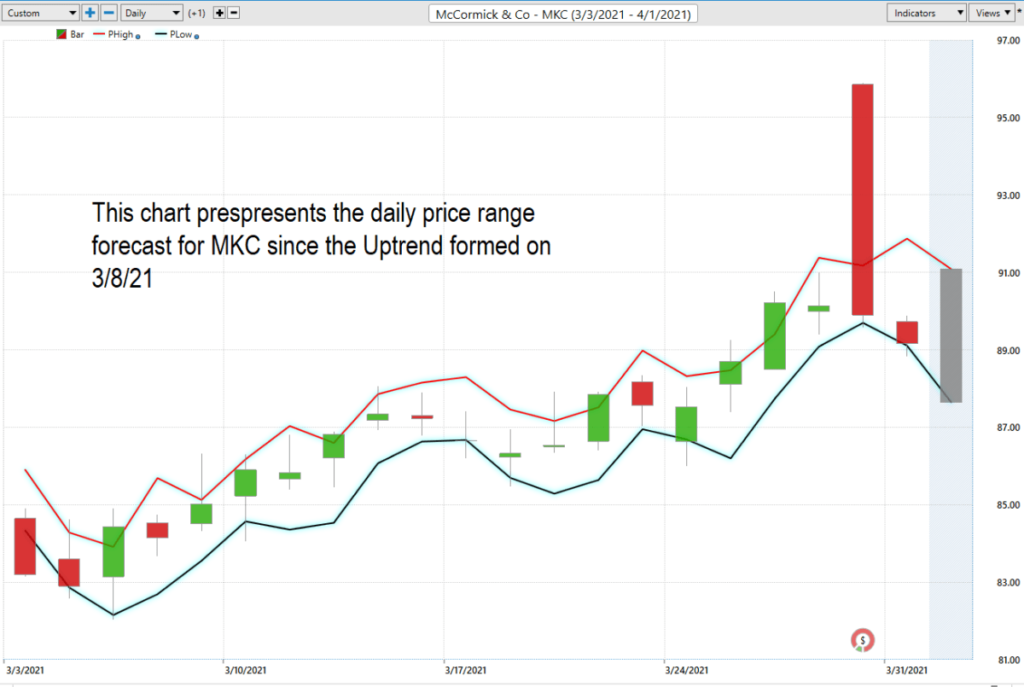
Power Traders try to use a price level below the predictive low price to place their protective sell stops in the market in case a sudden reversal was to occur. Observe how the predictive price low also provided numerous short term entry opportunities for traders to buy MKC as it was trending higher.
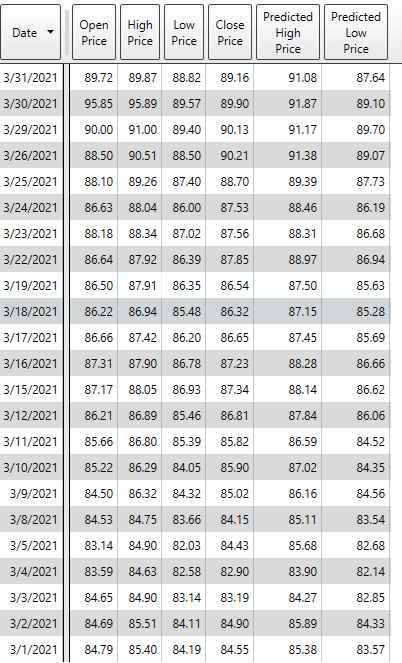
This information can also be presented in a tabular format which is very helpful for analytical traders who want to add their own flavor to a trading opportunity.
Fine Tuning Entries with the Neural Net Indicator
At the bottom of the chart is the Neural Network Indicator which predicts future strength and/or weakness in the market. When the Neural Net Indicator is green it communicates strength. When the Neural Net is Red it is forecasting short term weakness in the market.
We advocate that Power Traders cross-reference the chart with the predictive blue line and neural network indicator to create optimal entry and exit points.
Power Traders are always looking to apply both the neural network and A.I. to the markets to find statistically sound trading opportunities.
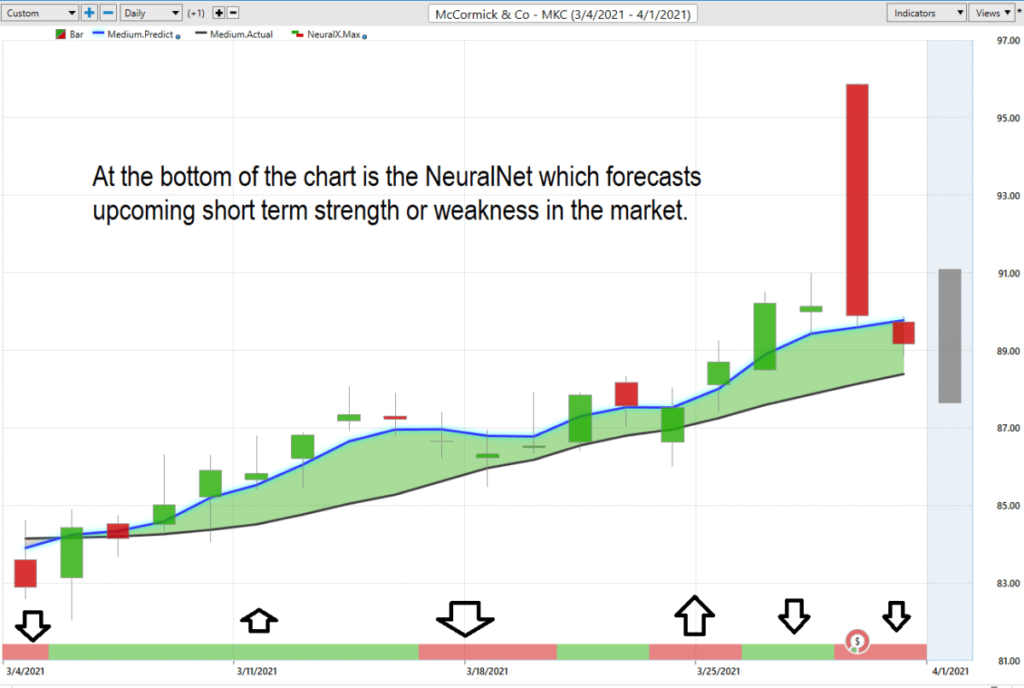
In summary, the trend turned up on 3/8/21. Prices have surged since that forecast and the trend remained firmly UP. Traders have had numerous opportunities to purchase MKC lower on the lower end of the daily price forecast to fine tune their entries.
Intermarket Analysis
What makes VantagePoint Software unique and distinct when compared to all other analytical tools is its patented and proprietary intermarket analysis.
Intermarket analysis is a method of analyzing markets by examining the correlations between different asset classes. In other words, what happens in one market could, and probably does, affect other markets, so a study of the relationship(s) is often very helpful to a trader.
Studying the charts can always provide objective realities in terms of locating support and resistance levels which become very clear on a chart. But we live in a global marketplace. Everything is interconnected. The billion dollar question for traders is always what are the key drivers of price for the underlying asset that I am trading?
These intangibles are invisible to the naked eye yet are responsible for driving prices. These markets show very high statistical correlations.
Instead of looking at financial markets or asset classes on an individual basis, intermarket analysis looks at several strongly correlated markets, or asset classes, such as other stocks, currencies, ETF’s and commodities. This type of analysis expands on simply looking at each individual market or asset in isolation by also looking at other markets or assets that have a strong relationship to the market or asset being considered. The VantagePoint Software analyzes the top 31 drivers of an assets price.
There is great value to be had in studying and understanding the key drivers of MKC price action.
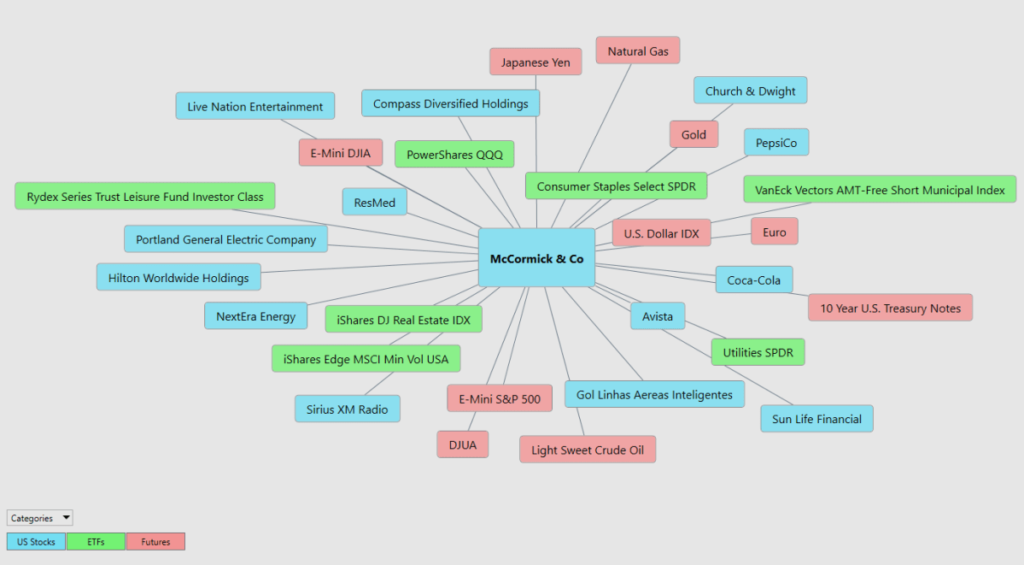
This information can also be displayed in a tabular format allowing you to dig in to the correlations and do further research on the ETF’s, stocks and futures that are the key drivers of MKC’s price.
Our suggestion – The consensus of analysts’ opinions shows that MKC is fairly valued at around $90. The high-end estimate over the short term is $104. The all-time high is $105.54. Power traders are in at lower prices and are placing their protective stops below the bottom of the predictive low channel. MKC is a great swing trading stock. Since MKC broke down through three previous 52-week highs we are cautious buyers looking for MKC to trend higher. We think momentum moves this asset higher over the next few weeks and will test its most recent 52-week high at $105.54.
We have it firmly on the radar and look to buy weakness as long as the A.I. forecasts UP.
Our advice: Follow the A.I. trend analysis and practice good money management on all of your trades. MKC deserves to be on your trading radar.
Let’s Be Careful Out There!
Remember, It’s Not Magic.
It’s Machine Learning.
Disclaimer: THERE IS A HIGH DEGREE OF RISK INVOLVED IN TRADING. IT IS NOT PRUDENT OR ADVISABLE TO MAKE TRADING DECISIONS THAT ARE BEYOND YOUR FINANCIAL MEANS OR INVOLVE TRADING CAPITAL THAT YOU ARE NOT WILLING AND CAPABLE OF LOSING.
VANTAGEPOINT’S MARKETING CAMPAIGNS, OF ANY KIND, DO NOT CONSTITUTE TRADING ADVICE OR AN ENDORSEMENT OR RECOMMENDATION BY VANTAGEPOINT AI OR ANY ASSOCIATED AFFILIATES OF ANY TRADING METHODS, PROGRAMS, SYSTEMS OR ROUTINES. VANTAGEPOINT’S PERSONNEL ARE NOT LICENSED BROKERS OR ADVISORS AND DO NOT OFFER TRADING ADVICE.