


[fusion_builder_container hundred_percent=”no” equal_height_columns=”no” hide_on_mobile=”small-visibility,medium-visibility,large-visibility” background_position=”center center” background_repeat=”no-repeat” fade=”no” background_parallax=”none” parallax_speed=”0.3″ video_aspect_ratio=”16:9″ video_loop=”yes” video_mute=”yes” border_style=”solid” type=”legacy”][fusion_builder_row][fusion_builder_column type=”1_1″ type=”1_1″ layout=”1_1″ background_position=”left top” background_color=”” border_color=”” border_style=”solid” border_position=”all” spacing=”yes” background_image=”” background_repeat=”no-repeat” padding_top=”” padding_right=”” padding_bottom=”” padding_left=”” margin_top=”0px” margin_bottom=”0px” class=”” id=”” animation_type=”” animation_speed=”0.3″ animation_direction=”left” hide_on_mobile=”small-visibility,medium-visibility,large-visibility” center_content=”no” last=”true” min_height=”” hover_type=”none” link=”” first=”true” border_sizes_top=”” border_sizes_bottom=”” border_sizes_left=”” border_sizes_right=””][fusion_text]
Who Is The Fastest Horse In This Race?
In May of this year, famed trader and hedge fund manager Paul Tudor Jones announced his interest and support for Bitcoin. At the time of his announcement, Bitcoin was trading at around $8500. He declared the Bitcoin cryptocurrency to be the best hedge against inflation and compared investing in Bitcoin to being an early investor in tech stocks, like Apple and Google:
“We are witnessing the Great Monetary Inflation — an unprecedented expansion of every form of money unlike anything the developed world has ever seen. The best profit-maximizing strategy is to own the fastest horse. If I am forced to forecast, my bet is it will be Bitcoin.”
— Paul Tudor Jones
Let’s focus on the idea of owning the fastest horse and understanding what that means for traders and investors. This concept could impact your decision-making related to your trading in a more effective and efficient manner.

Whenever you hear traders refer to a market’s strength they are usually gauging it in comparison to another asset, market or index. This is referred to as the Relative Strength. Do not confuse this idea with the technical indicator that was developed by Welles Wilder in the 1970’s called the Relative Strength Index or RSI. In this measurement of Relative Strength, we measure and compare the price trend and performance of one financial asset to another. It’s calculated by taking the price of one asset and dividing it by the other.
At its essence, we are simply creating a ratio. By doing so across asset classes we can determine relationships and correlations and it allows us to see norms and trends among different sectors and financial instruments. You may remember the article about this several months ago when we were at an extreme ratio when comparing Gold against Silver. You can read more about that here.
What MACRO traders and investors often do is they apply this idea to all the different sectors of the markets. Within each sector you can easily determine who are the consistent leaders and who are the laggards. For example, if we apply this concept to the auto industry, you would very quickly come to the conclusion that around 2013, TESLA was the fastest horse in the race.
At the time Tesla was trading at 8.75. Today Tesla is trading at roughly 625 a share. A 7000% increase.
2013 2015 Present time
Tesla 7.09 43.30 625
GM 29.86 34.84 41.59
For example, if the price of TESLA shares are $7 and the price of GM shares are $29.86, the relative strength of TESLA to GM is 0.23 ($7.0/29.86) in 2013. This number is given context when it is compared to the previous levels and current levels of relative strength. Two years later we do the same calculation, and we divide the price of TESLA by the price of GM and we find the relative strength is 1.24. In other words, TESLA massively outperformed FORD between 2013 and 2015. Currently, when we divide the price of TESLA by the price of FORD we come up with a relative strength number of 15.02. Context is very important when studying relative strength. Performing this calculation allows traders to understand what is strong and what is weak. Learning to buy the strongest and sell the weakest is how this concept is monetized effectively.
Performing this calculation on a weekly, monthly, quarterly, and annual basis allows us to see how the auto industry stocks have performed relative to one another. With the benefit of hindsight you would’ve clearly seen that TESLA was outperforming other auto stocks substantially starting in 2013.
If you look at how Wall Street fund managers are evaluated, they’re constantly gauging their fund’s performance to the major indexes. For them to outperform the major indexes consistently they need to find stocks and assets where the relative strength is higher than the major indexes they are being evaluated against. This is a primary filter they use when doing stock selection. For a Wall Street Manager choosing a stock with a relative strength of .60 to the S&P 500 would be considered counterproductive. Why? Because if all things are considered equal, and the future remains like the present, that stock will underperform the S&P and act as a drag of the fund managers performance.
When you evaluate trades or investments for the medium term, perform this calculation against the major indexes. It will help you to steer clear from laggards which might have a great story behind them but lack the performance metrics which are vital to investors and traders.
Fund managers perform these calculations across all sectors, forex pairs, crypto, futures and timeframes to discover where are the “hidden gems” that are consistently outperforming the market indexes. This is how MACRO traders discover the future movers and shakers.
The premise is that winners keep winning until they don’t. Success leaves huge footprints. We just need to take the time to understand why top performers have outperformed.
Want to guess what asset class is on the forefront of trading consciousness when the relative strength calculation is performed today?
If you said Bitcoin, go to the head of the class.
Here’s a quick snapshot of how bitcoin has performed against Gold and the S&P 500 over the last 10 years.
Bitcoin |
Gold |
S&P 500 |
|
1 year |
217% |
25% |
14% |
2 year |
498% |
48% |
55% |
3 year |
61% |
46% |
37% |
4 year |
2551% |
64% |
63% |
5 year |
5301% |
74% |
79% |
6 year |
7038% |
58% |
77% |
7 year |
3640% |
55% |
101% |
8 year |
179023% |
12% |
157% |
9 year |
609469% |
16% |
192% |
10 year |
9530540% |
35% |
192% |
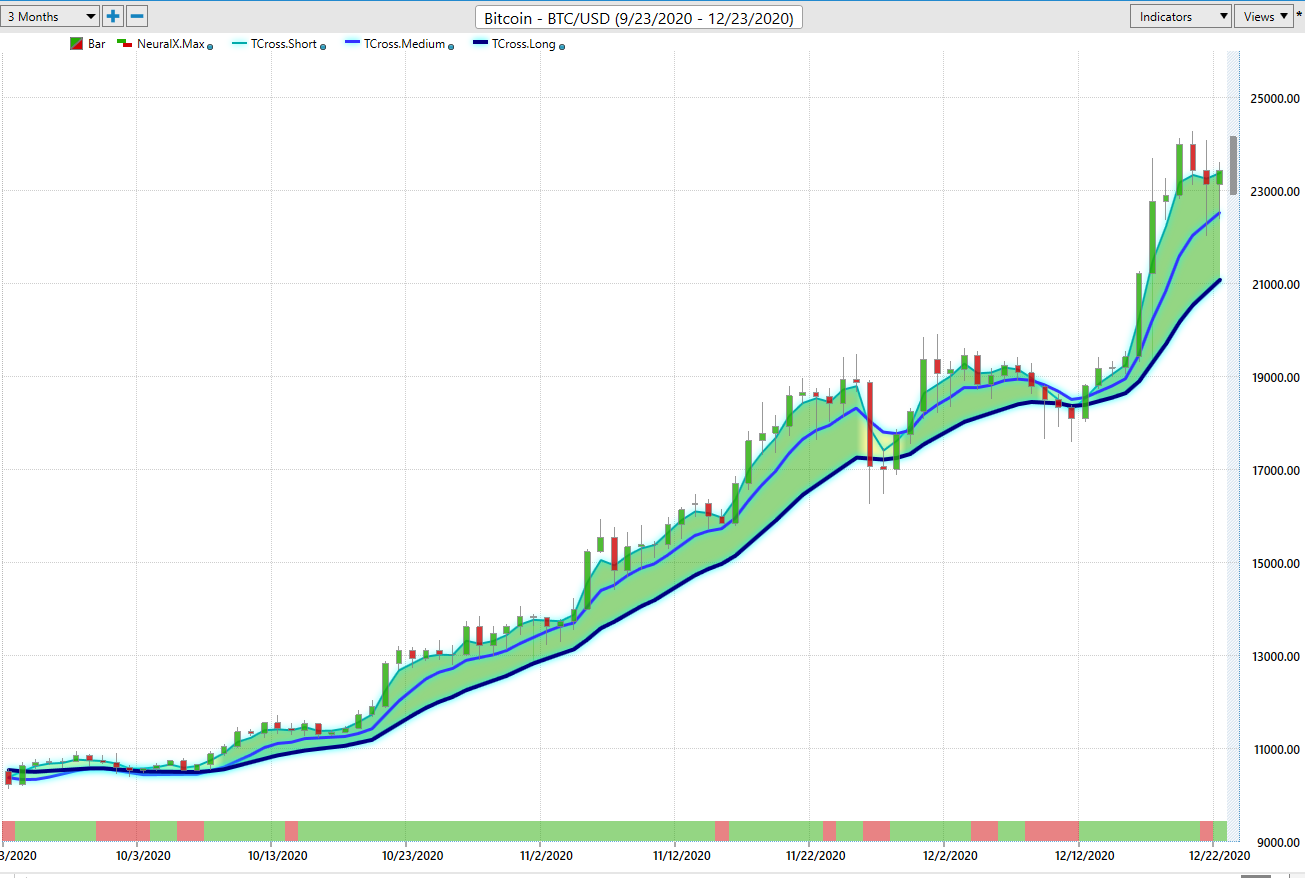
When you perform this relative strength calculation across all asset classes, you’ll see that Bitcoin is at the top of the charts for performance across all asset classes and time frames. Now, there will be weeks, months, quarters when you will see a rotation in leadership occur. But an ongoing premise of successful MACRO traders is they look for the strongest trend as measured by Relative Strength and then try to comprehend what is driving the price action.
When Paul Tudor Jones announced his entry into Bitcoin it was trading at $8500. Today it is at $24,000. The Relative Strength was a vital metric that Jones evaluated when he studied his longer term assessment of the economy and markets.
He concluded his investment thesis on bitcoin as follows:
“If you take cash, on the other hand, and you think about it from a purchasing power standpoint, if you own cash in the world today, you know your central bank has an avowed goal of depreciating its value 2% per year,” Jones said. “So, you have, in essence, a wasting asset in your hands.”
Bitcoin, on the other hand, isn’t subject to the whims of government spending, but is itself risky because it’s only 11 years old, Jones said. He also confirmed that he has a portion of his portfolio invested in gold, a popular inflation hedge, and said he thought the metal could go “substantially higher” if inflation spikes.
“When I think of bitcoin, look at it as one tiny part of a portfolio. It may end up being the best performer of all of them, I kind of think it might be,” he said. “But I’m very conservative. I’m going to keep a tiny percent of my assets in it and that’s it. It has not stood the test of time, for instance, the way gold has.”
Successful traders are obsessed at finding the fastest horse in the race.
This concept can be drilled down to an individual industry or stock sector as well.
Cross-referencing this idea or concept with artificial intelligence is mighty powerful ammunition for traders. Artificial Intelligence, machine learning and neural networks are designed to uncover the statistically best move forward.
A picture is worth a thousand words and a lot more money.
You too can start finding the fastest horse in the races you want to monitor, whether it be stocks, crypto or other asset classes.
Intrigued? Visit with us and check out the a.i. at our Next Live Training.
Discover why artificial intelligence is the solution professional traders go-to for less risk, more rewards, and guaranteed peace of mind.
It’s not magic. It’s machine learning.
Make it count.
IMPORTANT NOTICE!
THERE IS SUBSTANTIAL RISK OF LOSS ASSOCIATED WITH TRADING. ONLY RISK CAPITAL SHOULD BE USED TO TRADE. TRADING STOCKS, FUTURES, OPTIONS, FOREX, AND ETFs IS NOT SUITABLE FOR EVERYONE.
DISCLAIMER: STOCKS, FUTURES, OPTIONS, ETFs AND CURRENCY TRADING ALL HAVE LARGE POTENTIAL REWARDS, BUT THEY ALSO HAVE LARGE POTENTIAL RISK. YOU MUST BE AWARE OF THE RISKS AND BE WILLING TO ACCEPT THEM IN ORDER TO INVEST IN THESE MARKETS. DON’T TRADE WITH MONEY YOU CAN’T AFFORD TO LOSE. THIS ARTICLE AND WEBSITE IS NEITHER A SOLICITATION NOR AN OFFER TO BUY/SELL FUTURES, OPTIONS, STOCKS, OR CURRENCIES. NO REPRESENTATION IS BEING MADE THAT ANY ACCOUNT WILL OR IS LIKELY TO ACHIEVE PROFITS OR LOSSES SIMILAR TO THOSE DISCUSSED ON THIS ARTICLE OR WEBSITE. THE PAST PERFORMANCE OF ANY TRADING SYSTEM OR METHODOLOGY IS NOT NECESSARILY INDICATIVE OF FUTURE RESULTS. CFTC RULE 4.41 – HYPOTHETICAL OR SIMULATED PERFORMANCE RESULTS HAVE CERTAIN LIMITATIONS. UNLIKE AN ACTUAL PERFORMANCE RECORD, SIMULATED RESULTS DO NOT REPRESENT ACTUAL TRADING. ALSO, SINCE THE TRADES HAVE NOT BEEN EXECUTED, THE RESULTS MAY HAVE UNDER-OR-OVER COMPENSATED FOR THE IMPACT, IF ANY, OF CERTAIN MARKET FACTORS, SUCH AS LACK OF LIQUIDITY. SIMULATED TRADING PROGRAMS IN GENERAL ARE ALSO SUBJECT TO THE FACT THAT THEY ARE DESIGNED WITH THE BENEFIT OF HINDSIGHT. NO REPRESENTATION IS BEING MADE THAT ANY ACCOUNT WILL OR IS LIKELY TO ACHIEVE PROFIT OR LOSSES SIMILAR TO THOSE SHOWN.
[/fusion_text][/fusion_builder_column][/fusion_builder_row][/fusion_builder_container]


