


Trading is fundamentally a process, a disciplined approach that encompasses the identification of potential opportunities and the meticulous allocation of capital. This process demands a trader to be highly selective, constantly sifting through myriad options to discern the most promising investments.
It’s not merely about the act of buying and selling but involves a comprehensive analysis to locate potential growth areas, assess risks, and ensure that capital is invested where it has the highest probability of generating substantial returns. Being discriminating in this context means recognizing not just the opportunities that align with one’s trading strategy, but also being aware of market conditions, economic indicators, and individual asset performance to make informed decisions. This strategic allocation of capital, underpinned by rigorous research and risk management, is what differentiates successful trading from mere speculation.
Let me explain.
Whenever I talk with traders the very first question which I always ask is, “what is the worst trade you ever made?” Traders can talk about this topic for hours discussing the pain they endured at the hands of a market which they completely misinterpreted.
My follow-up question though is where the rubber meets the road. I always ask the same group of traders, “what did you learn from that experience?” Usually, the silence is deafening.
In the trading world, success is predicated not just on the decisions made in the present, but significantly on the lessons learned from past outcomes. Every trade offers a wealth of insights into the market’s behavior, the effectiveness of one’s strategy, and the impact of external factors on asset performance. The process of continuous learning from these results is indispensable for refining decision-making processes. It involves a meticulous analysis of both successful and unsuccessful investments to identify patterns, understand missteps, and adapt strategies accordingly. The losing side of the ledger is where great traders learn wisdom and skill. This reflective practice enables traders and investors to evolve their approaches, making them more resilient to market volatilities and better equipped to capitalize on opportunities. Thus, the commitment to learning from one’s results is a cornerstone of sustainable success in trading, as it fosters a deeper understanding of the market dynamics and enhances one’s ability to make informed, strategic decisions.
In this article I will explore an approach to trading that can best be described as isolating winners. This approach involves three important steps in a process that focuses on locating giant opportunities with less risk. The process is broken down into three distinct filters:
1. Create a list of ASSETS that are testing or breaching their 52-week highs.
2. Next, measure the RELATIVE strength of the assets and compare their performance to an important benchmark like the S&P 500 Index.
3. Lastly, track the very top performers from that analysis with artificial intelligence to focus on the best move forward.
This process focuses your attention on the strongest trends measured by their performance. From this point forward simply have the artificial intelligence track those trends!
The 52 Week High Boundary
In the dynamic world of trading, a distinct pattern emerges where winners often continue to win, a phenomenon that underscores the momentum-driven nature of financial markets. This principle is vividly illustrated by assets that breach or are testing their 52-week highs, signaling not just current strength but also potential for continued upward movement. Such milestones communicate a robust vote of confidence from the market, indicating that the asset has consistently performed well enough to approach or surpass previous peaks. This momentum is significant; it reflects not just past successes but also the collective anticipation of future gains, drawing more investors towards the asset in a self-reinforcing cycle of demand and appreciation.
The act of an asset hitting its 52-week highs serves as a beacon, signaling to the market that it has successfully navigated the myriad challenges that could have hampered its growth. These milestones are not just arbitrary numbers; they represent a confluence of positive sentiment, strong fundamentals, or external factors favoring the asset’s sector or industry. Importantly, they attract attention from a broad spectrum of investors, from technical traders attracted to the momentum to fundamental investors reassured by the underlying strength this performance suggests. Consequently, assets testing these highs often become focal points for increased trading activity, as they are perceived to have the resilience and momentum necessary to overcome obstacles and continue their ascent. This scenario encapsulates the essence of momentum trading, where recognizing and capitalizing on such trends can lead to substantial gains, underlining the adage that in the trading world, winners often keep on winning.
Great traders are constantly tracking assets that are testing and breaching their 52-week highs! This is always among the first things we do whenever we analyze an asset. You will find hundreds of candidate vying for your attention who are all demonstrating huge potential.
Measuring Relative Strength Performance
Ever taken a deep dive into the workings of a stock, wondering if the market’s major players, those with the financial firepower to sway a stock’s journey, are busy gathering or liquidating their shares? Let me introduce you to the power player in analytical tools for such a scenario: relative strength analysis.
Relative Strength Performance (RSP) and the Relative Strength Index (RSI) developed by Welles Wilder serve distinct purposes in financial analysis, despite their similar names. RSP is a comparative measure that evaluates how well a stock or security performs against another stock, a sector, or a market index over a given period, essentially highlighting outperformers or underperformers within a market. It’s used to identify trends and momentum by comparing the price movements of two assets.
In this article we focus on Relative Strength Performance.
On the other hand, RSI is a technical indicator that measures the speed and change of price movements of a single security, aiming to identify overbought or oversold conditions in the market. RSI is calculated using a formula that produces a value between 0 and 100, indicating potential reversal points based on internal strength or weakness. Thus, while RSP focuses on comparative performance, RSI is concerned with the internal momentum of a single security’s price.
Relative Strength Performance is essentially a no-nonsense gauge of performance. Here’s the deal: we’re zeroing in on comparing a stock’s trajectory against an index or its counterparts in the market over set periods—be it the last year or any other timeframe of choice. The goal? To crack the code on the stock’s track record. Now, you might think, “What’s the point of looking backward to gauge forward momentum?” But here’s where it gets interesting. A stock that consistently outshines its peers or the broader market is waving a big, red flag that it’s a contender worth watching, akin to picking a star athlete based on past victories. It shows they’ve got the chops, no additional seasoning required. When you study this concept you will discover that Relative Strength performance is often used on shorter term time frames to detect strength in its early stages.
The formula for Relative Strength Performance is very straightforward. You are comparing the performance of one asset to a benchmark. Whenever the performance is greater than 1 the asset outperforms the benchmark. When the RSP is less than 1, it is underperforming the benchmark.
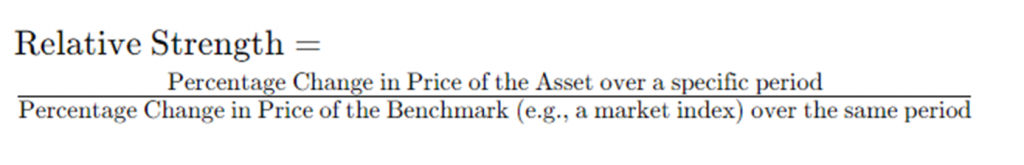
Picture this: you’re on a quest to unlock the secrets behind relative strength. It’s not just about throwing numbers together willy-nilly; it’s about diving deep, mathematically speaking, to see how a single stock stands up against the grand stage of the market. There’s not just one road to this destination—oh no, there are several paths you can take. But, regardless of the route, the end goal is always the same: capturing the essence of a stock’s momentum and sizing it up against the market’s broad shoulders. It’s like comparing the speed of a sprinter to that of the entire race. That’s the heart of the matter when we talk about relative strength.
From this angle, when a stock is outperforming, it’s like a beacon for institutional investors, signaling that the asset is on the right track. This isn’t just about throwing money around. It’s rooted in the company’s ability to convincingly communicate its worth as an investment to those with the big bucks. And there’s more. Such standout performance suggests not just that there’s a demand for what the company’s selling but that it’s also nailing the delivery of its goods and services to the market.
So, we’re not just talking about a stock that’s doing well; we’re highlighting a scenario where a company’s performance, its rapport with institutional investors, management’s strategic communication, and its market delivery are all firing on all cylinders. This approach, hinging on understanding past performance, is invaluable, offering a treasure trove of insights and solidifying the crucial role of relative strength analysis in mapping out a stock’s future trajectory.
Now, imagine a tool so incisive, it slices through the market’s noise to spotlight the stars of the stock world. I’m talking about the Relative Strength Performance, a gem frequently spotlighted in Investor’s Business Daily, and a favorite trick up the sleeve of the IBD founder, William O’Neal. Picture this: O’Neal conjures up a way to distill the essence of market winners and losers over the last year into a simple percentile ranking. Hit a score of 99, and you’re flying high above 99% of the competition. Stumble to a score of one, and well, it’s back to the drawing board for you. But here’s the kicker—with just this one sleek metric, you gain instant insight into where your stock stands in the grand American stock universe. And yes, while this magic can be performed on any global stage, Investor’s Business Daily gives us the lowdown for the U.S. scene. Looking to narrow your sights to the elite, the top 5% performers over the past year? Demand a composite rank of 95 or better, and voilà, you’ve sidelined 95% of the field, zeroing in on the crème de la crème. It’s that straightforward, that simple, that effective.
But you can perform the same calculation on your own by simply comparing the performance of the asset you are analyzing to an important benchmark to determine whether it is a good candidate for a winning stock.
Utilizing Artificial Intelligence to Balance Risk and Reward
The purpose of artificial intelligence (A.I.) in trading and investing is multifaceted, aimed at enhancing decision-making, efficiency, and accuracy within financial markets. A.I. leverages algorithms and machine learning to analyze vast datasets at speeds and depths unattainable by human traders, identifying patterns, trends, and predictive signals that inform investment decisions. Ultimately, A.I.’s integration into trading and investing seeks to capitalize on market opportunities more swiftly and accurately, providing a competitive edge in the fast-paced world of finance.
This process allows you to initially start focusing on assets that are making 52-week highs to then focusing on assets that are outperforming the broader markets. Once you have these stocks, futures, crypto on your radar you can now track them with the ai for a better trading experience.
Let me provide some charts which will highlight the power of this simple process:
GOLD
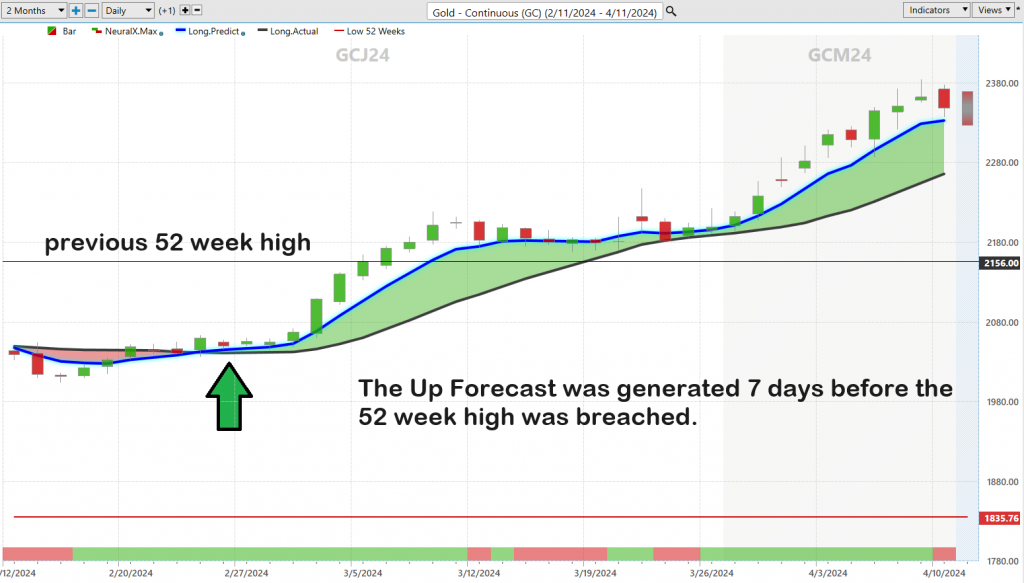
Gold tested its 52-week highs multiple times over the last year. Observe the weekly chart of Gold below as it tested its 52-week high at $2156.
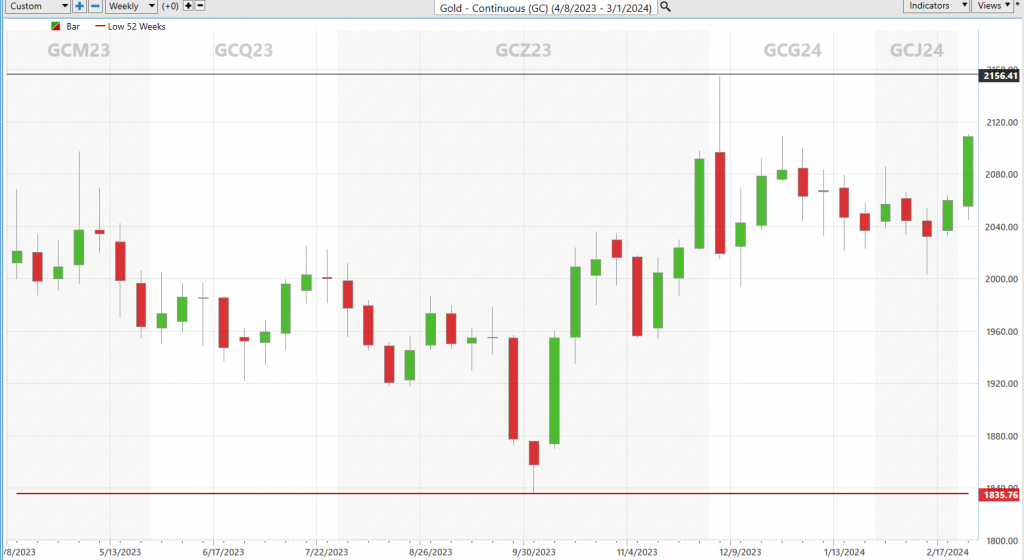
Over the previous 6-month time frame Gold had almost kept pace with the performance of the S&P 500. Gold had rallied 17.3% while the S&P 500 had rallied 18%. Gold was still underperforming the S&P 500 but not by much! Gold was now ready to test its 52-week highs with its highest relative strength performance of the year.
Lastly look at the VantagePoint A.I. Predictive Blue line forecast on Gold as it breached its 52-week highs at $2156 and never looked back!
This is the power of the 52-week high, relative strength performance and artificial intelligence.
Bitcoin
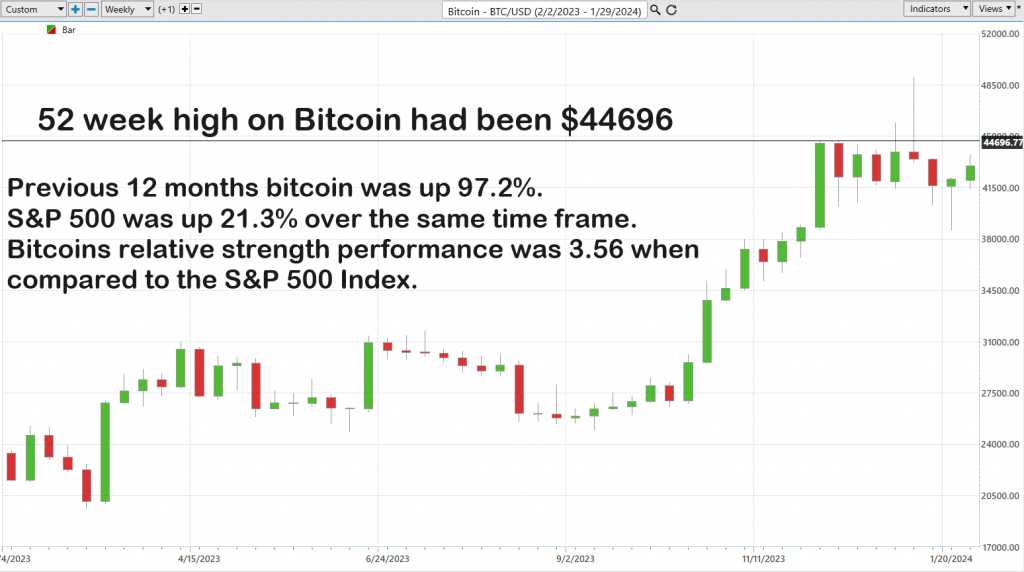
Whenever bitcoin tests its 52-week highs I always compare its annual performance to that of the S&P 500 Index.
From February 4, 2023, to February 4, 2024, Bitcoin was up 97.2% and testing its 52-week highs again. The S&P 500 over this same time frame was up 21.35%. So, the Relative Strength performance of Bitcoin in comparison to the S&P 500 Index was 3.56. Meaning that bitcoins’ performance was 356% better than the S&P 500 Index.
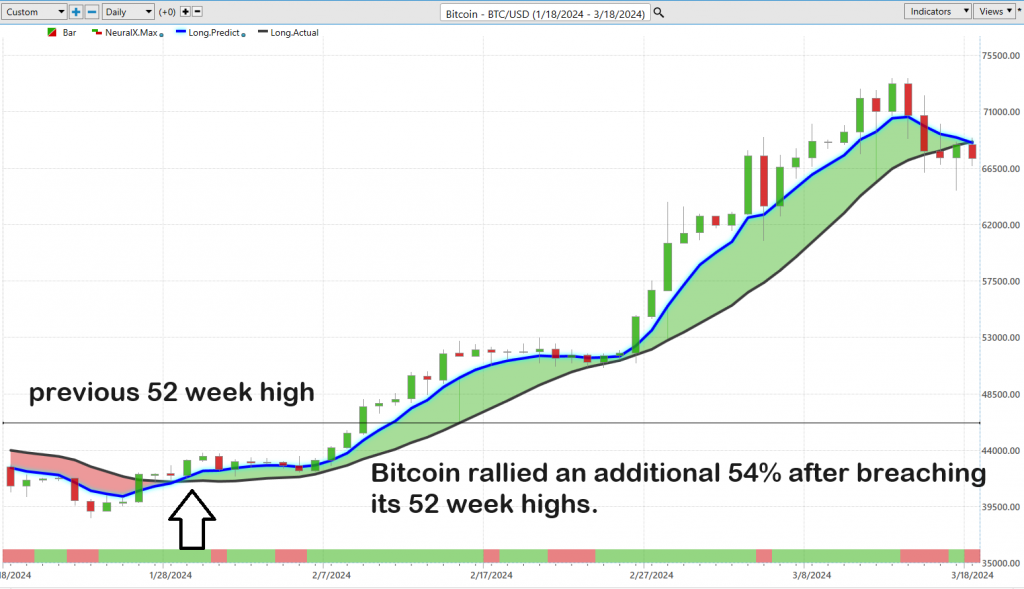
Now look at how the VantagePoint A.I. Predictive Blue Line navigated the volatility. Bitcoin rallied an additional 54% in 34 days after it breached its 52-week highs! Winners keep on winning!
For purposes of space and time I will simply provide the 52-week charts of some of the top winners of this process. I highly advise that you perform your own due diligence in researching this process.
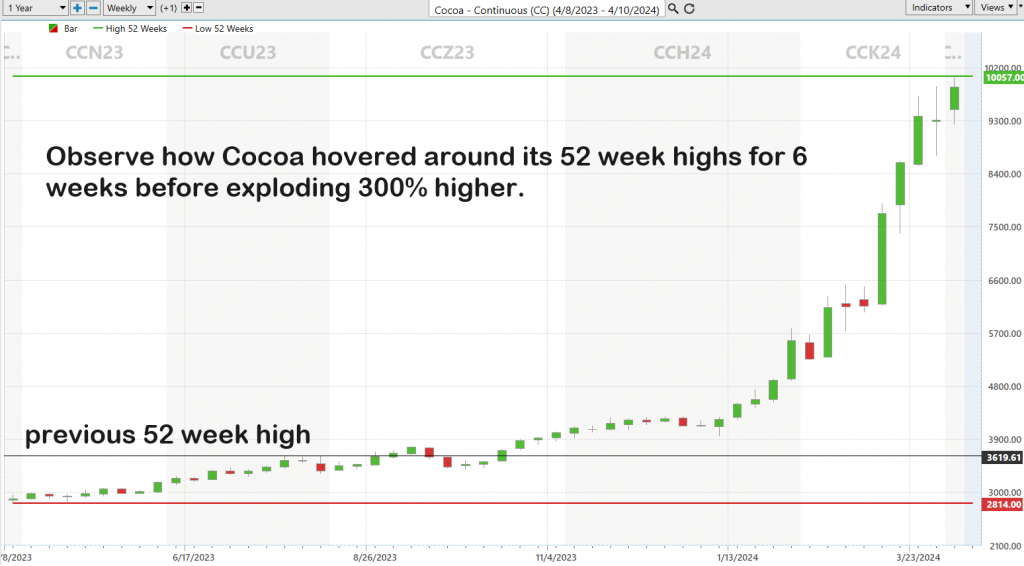
Cocoa
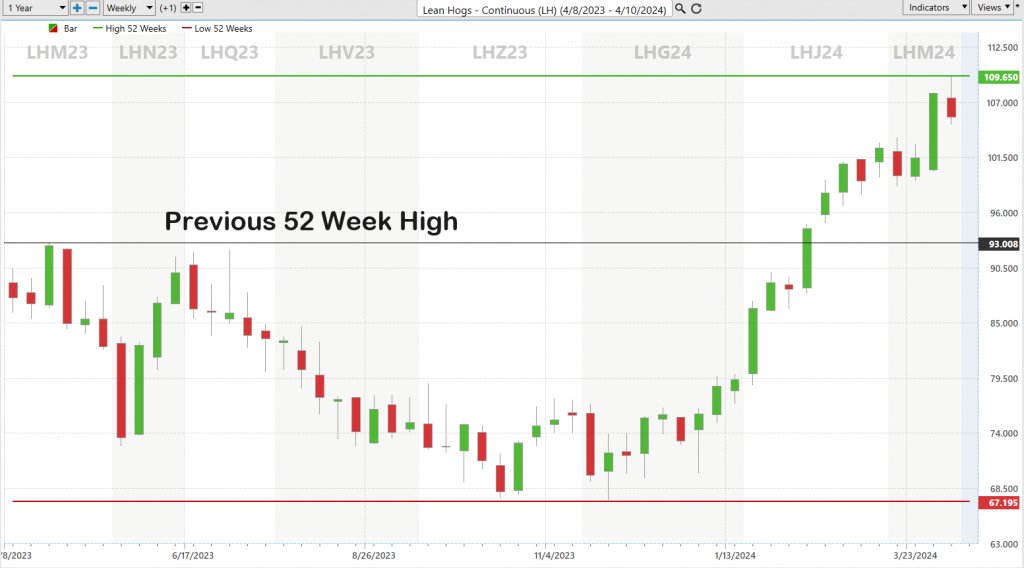
Lean Hogs
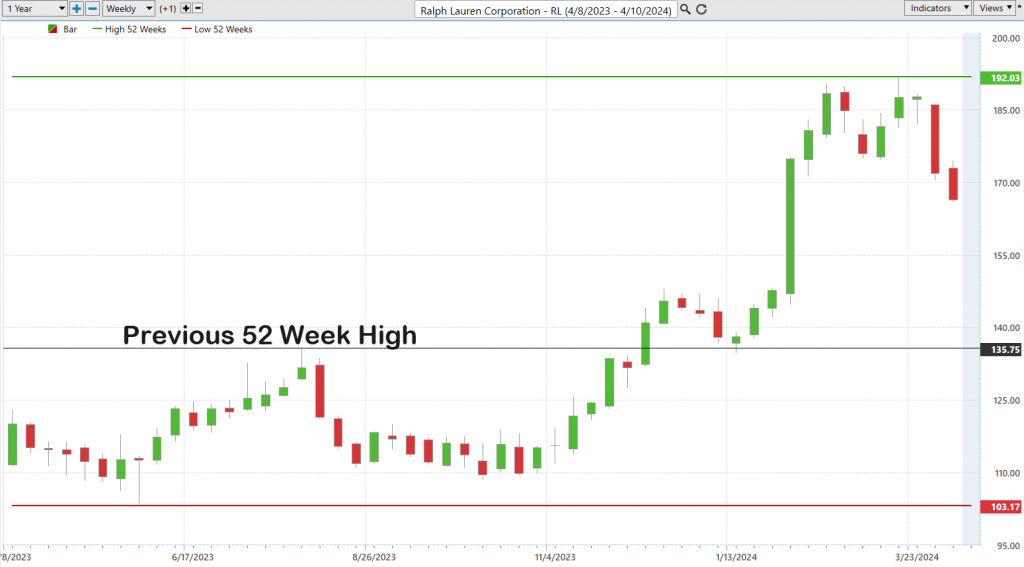
Ralph Lauren ($RL)
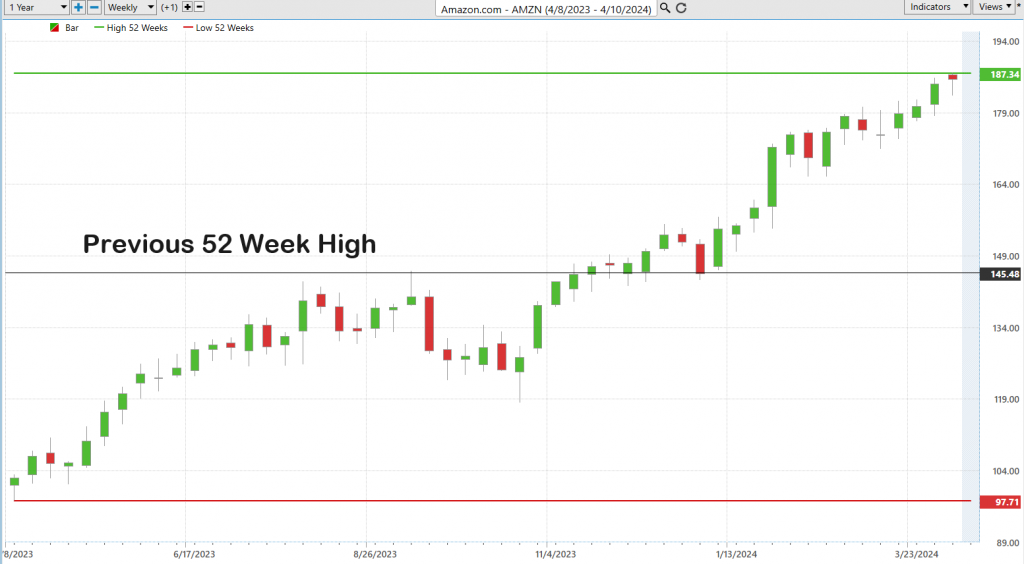
Amazon ($AMZN)
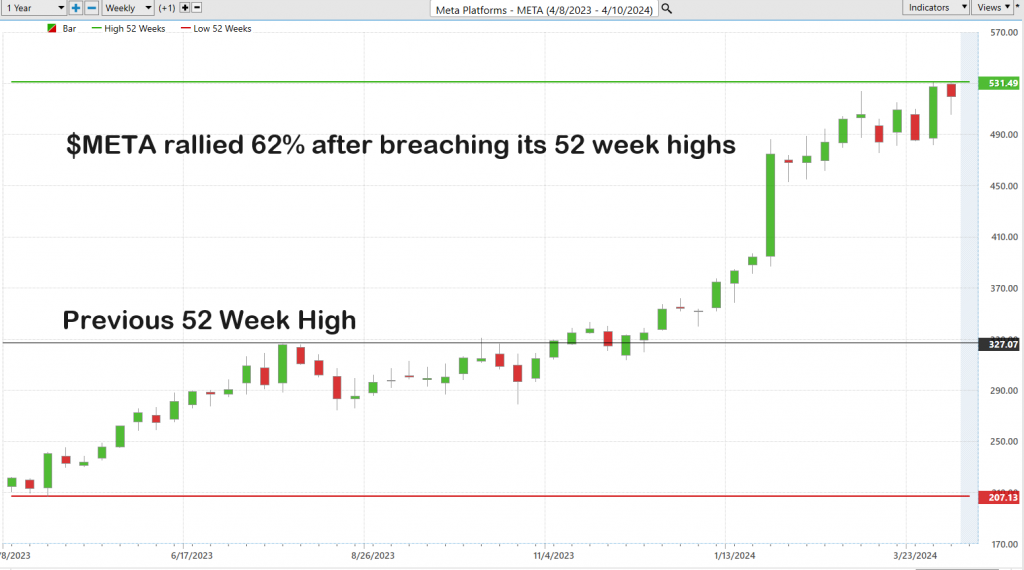
META ($META)
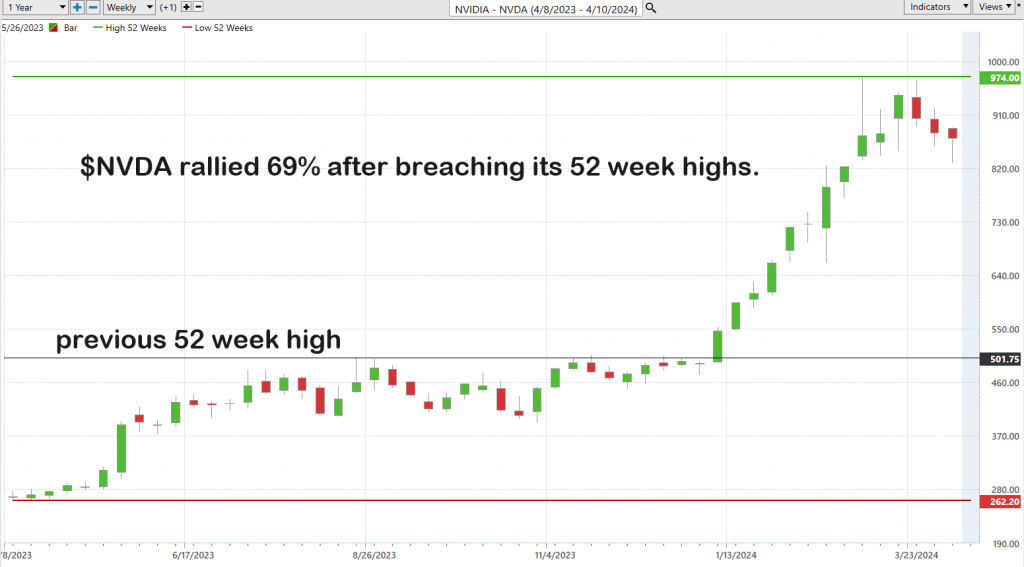
NVIDIA ($NVDA)
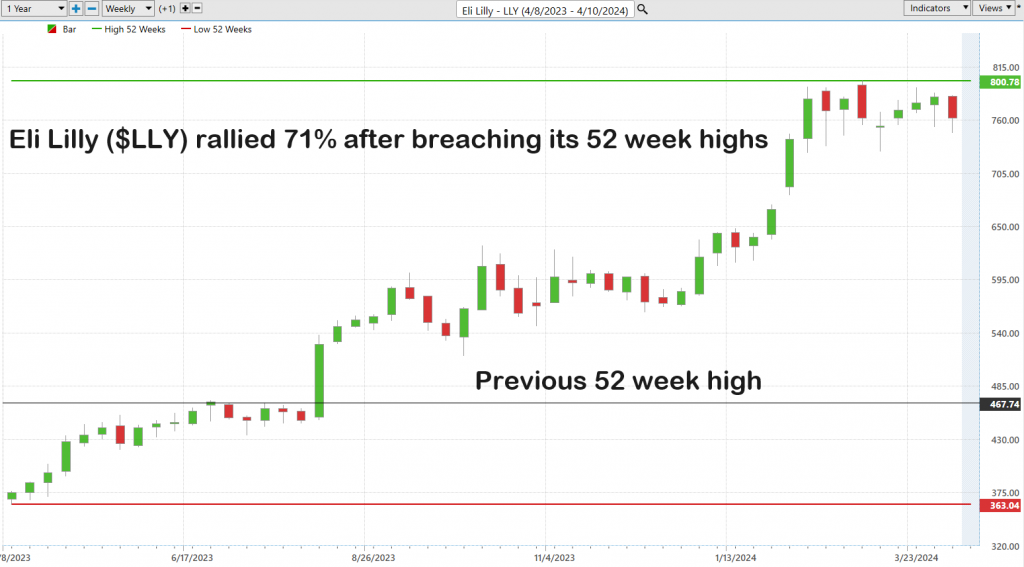
Eli Lilly ($LLY)
The methodology outlined represents a streamlined process for identifying the most robust trends in the market, beginning with a comprehensive list of assets that are either testing or surpassing their 52-week highs. This initial step serves as a powerful filter, isolating assets that are demonstrating strong momentum and potential for continued growth. By subsequently calculating the Relative Strength Performance (RSP) of each asset, we refine our focus further, comparing their performance not only against the broader market, represented by benchmarks like the S&P 500 Index, but also within their specific sectors. This dual approach allows investors to pinpoint not just the market leaders, but also the top performers in each sector, ensuring a diversified selection of high-quality performers.
If you want to filter that starting list even further look for assets that are simultaneously making 10-year highs as well as 52-week highs. The explosive nature of this trading setup will surely make it one of your favorite trading criteria.
Lastly, leveraging artificial intelligence (AI) to track and analyze these carefully selected stocks transforms this process from merely insightful to genuinely strategic. A.I.’s capability to digest vast amounts of data, spot emerging trends, and predict future movements with a degree of accuracy unattainable by human analysis means that investors are better equipped to make informed trading decisions. This combination of a methodical selection process based on 52-week highs and RSP analysis, together with the predictive power of A.I., creates a formidable strategy for uncovering and capitalizing on the strongest trends in the market. It is a testament to how technology and traditional investing/trading principles can converge to empower investors with a sophisticated toolkit for navigating the volatility of the financial markets.
Intrigued by this process? I’d like to invite you to our Live Online Free Learn How to Trade with Artificial Intelligence Masterclass which explores this topic in greater detail.
Step Up Your Trading Strategy: It doesn’t matter if you’re a veteran of the trading floor or just stepping into the game, folks. Here’s your golden ticket to truly unlocking what Artificial Intelligence can do in the trading arena. We’re talking about diving deep into the most innovative strategies, wielding the might of data to make those crucial trading decisions, and setting off on a voyage aimed straight at regular profits. Now’s your chance to grab your spot, to not just elevate but revolutionize your approach to trading with the power of A.I. by your side. This isn’t just any opportunity—it’s your chance to join the ranks of trading’s elite, leveraging A.I. for unparalleled success. Don’t let this ship sail without you; reserve your place today and take the first step on a transformative journey towards mastering the art of trading with A.I.
Are you feeling the silent, gnawing dread of watching your hard-earned wealth melt away, victim to the relentless devaluation of currency? It’s an insidious force, one that quietly diminishes your buying power, leaving you with a shadow of what you once had. Yet, amid this financial storm, there emerges a beacon of hope.
Envision for a moment the ability to not just safeguard, but to expand your wealth, standing strong against the onslaught of currency depreciation. We are on the cusp of introducing something truly groundbreaking—our cutting-edge artificial intelligence trading software.
Where traditional financial strategies may stumble amidst market upheavals, our AI-driven system excels. It’s finely tuned to adapt instantaneously to market shifts, executing decisions in the blink of an eye to both seize profits and sidestep losses. Gone are the days of tossing and turning, fretting over your fiscal well-being. Our software is your ally, enabling you to navigate your financial journey with unparalleled assurance.
For those of you keenly observing the economic horizon, it’s evident—our currency is under siege. A relentless barrage of money printing by governments is steadily diluting its worth, silently pilfering your purchasing power. This covert thief operates in the shadows, but I bring you heartening news: you need not stand defenseless.
Imagine a future where economic fluctuations are not a source of anxiety but an opportunity for prosperity.
This is the essence of our artificial intelligence trading software: to steadfastly position you in the sweet spot of market trends, at the perfect moment. AI doesn’t just aim for this target; it’s singularly fixated on it, perpetually calculating the optimal path forward.
It’s Not Magic.
It’s machine learning.
Make it count.
THERE IS A SUBSTANTIAL RISK OF LOSS ASSOCIATED WITH TRADING. ONLY RISK CAPITAL SHOULD BE USED TO TRADE. TRADING STOCKS, FUTURES, OPTIONS, FOREX, AND ETFs IS NOT SUITABLE FOR EVERYONE.IMPORTANT NOTICE!
DISCLAIMER: STOCKS, FUTURES, OPTIONS, ETFs AND CURRENCY TRADING ALL HAVE LARGE POTENTIAL REWARDS, BUT THEY ALSO HAVE LARGE POTENTIAL RISK. YOU MUST BE AWARE OF THE RISKS AND BE WILLING TO ACCEPT THEM IN ORDER TO INVEST IN THESE MARKETS. DON’T TRADE WITH MONEY YOU CAN’T AFFORD TO LOSE. THIS ARTICLE AND WEBSITE IS NEITHER A SOLICITATION NOR AN OFFER TO BUY/SELL FUTURES, OPTIONS, STOCKS, OR CURRENCIES. NO REPRESENTATION IS BEING MADE THAT ANY ACCOUNT WILL OR IS LIKELY TO ACHIEVE PROFITS OR LOSSES SIMILAR TO THOSE DISCUSSED ON THIS ARTICLE OR WEBSITE. THE PAST PERFORMANCE OF ANY TRADING SYSTEM OR METHODOLOGY IS NOT NECESSARILY INDICATIVE OF FUTURE RESULTS. CFTC RULE 4.41 – HYPOTHETICAL OR SIMULATED PERFORMANCE RESULTS HAVE CERTAIN LIMITATIONS. UNLIKE AN ACTUAL PERFORMANCE RECORD, SIMULATED RESULTS DO NOT REPRESENT ACTUAL TRADING. ALSO, SINCE THE TRADES HAVE NOT BEEN EXECUTED, THE RESULTS MAY HAVE UNDER-OR-OVER COMPENSATED FOR THE IMPACT, IF ANY, OF CERTAIN MARKET FACTORS, SUCH AS LACK OF LIQUIDITY. SIMULATED TRADING PROGRAMS IN GENERAL ARE ALSO SUBJECT TO THE FACT THAT THEY ARE DESIGNED WITH THE BENEFIT OF HINDSIGHT. NO REPRESENTATION IS BEING MADE THAT ANY ACCOUNT WILL OR IS LIKELY TO ACHIEVE PROFIT OR LOSSES SIMILAR TO THOSE SHOWN.