One of the fascinating things about risk is how everyone has an opinion about what it is, but very few can quantify it. Watch a sporting event between two teams and heated debates will develop over who will be the victor. In this type of situation, I would draw your attention to the Las Vegas bookmakers who are actively taking wagers on the event and are creating odds and payouts based upon potential outcomes. These bookmakers are not always correct, but they are quantifying the probabilities of an outcome for those who are interested in wagering.
This is remarkably like what occurs in the options markets across the financial landscape. Options are contractual agreements between buyers and sellers to make or accept delivery of a certain quantity of an asset at an agreed upon price at some point in the future. These option contracts and their pricing often have an extremely high degree of predictive value in determining what the probabilities of certain outcomes are going forward. In this article I will discuss why EVERYONE should pay attention to the pricing and the trend of the Volatility Index ($VIX) and show how it has a strong inverse correlation to the direction of the S&P 500 Index.
Before we can understand the nuances of volatility, we need to define a handful of terms. Volatility is a key concept in the financial markets that can have a major impact on prices, but it can be difficult to define. In general, volatility refers to the amount of uncertainty or risk associated with an asset.
Statistical volatility is a measure of the dispersion of returns for a given security or market index. Volatility can either be measured by using the standard deviation or variance between returns from that security or market index.
Statistical volatility is often used as a historical measure to assess risk of stock prices. It measures the dispersion of prices from the average over a given period. For example, if stock prices have been historically volatile, traders may expect wider bid-ask spreads and lower liquidity in that security.
However, traders believe that statistical volatility is not an accurate measure of current risk and prefer to use implied volatility. Implied volatility is extracted and measured from option prices and represents the market’s expectation of volatility in the future. The term “implied volatility” (IV) refers to the volatility that is implied by the market price of a financial asset. In other words, IV is what the market expects the volatility of an asset to be in the future. IV can be measured using options prices, and it is a key ingredient in the Black-Scholes option pricing model. IV is different from “statistical volatility” (SV), which is a measure of actual past volatility. While SV can be useful in assessing risk, it doesn’t necessarily provide any insight into future volatility. That’s where IV comes in. By peering into the market’s expectations for volatility, IV can give us a sense of what options pricing is telling us might happen in the future. It can be useful to compare implied volatility with historical volatility to get a sense of how the market is pricing risk in a security. In other words, what implied volatility is really measuring is that the options markets are implying about future expectations. Since options trade millions of contracts daily, it is worth paying attention to this and recognize that it is a barometer of opinions about what will happen moving forward.
The Volatility Index, or $VIX, is a measure of implied volatility of the S&P 500 Index. It’s used by traders to price options and measure market risk. Since implied volatility is based on the market’s expectation of future volatility, and it has a big effect on options prices. When the VIX is rising it means that options pricing is becoming more expensive. The VIX is often called the “fear index” because it spikes when markets are worried about a sell-off.
Let’s look at the $VIX over the last 6 months. Observe how over the last six months we have observed six different trend forecasts in the $VIX. I have delineated each change in trend forecast with the black vertical line below.
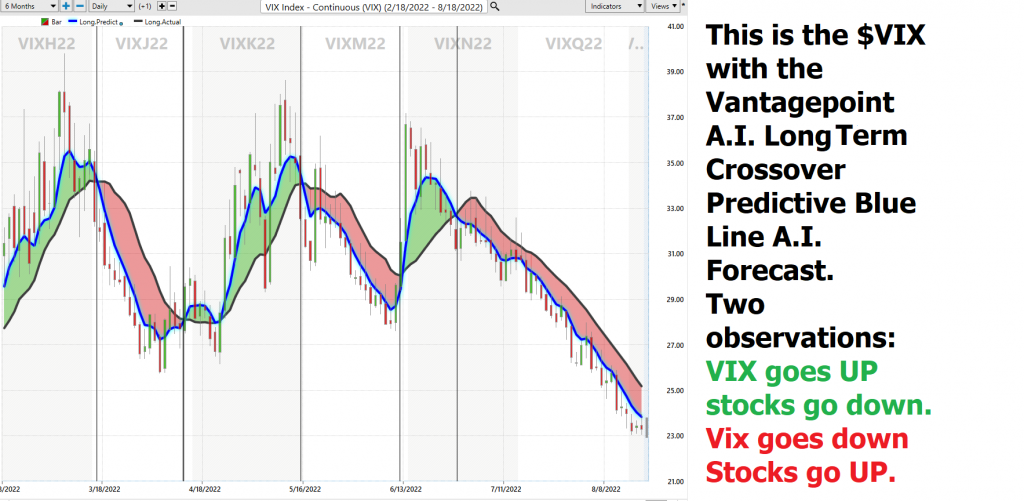
The Volatility Index, or $VIX, is a measurement of implied volatility of the S&P 500 Index. It is a contrary indicator, meaning that when $VIX is high, it is typically an indication that the market is near a top, and when $VIX is low, it is typically an indication that the market is near a bottom. This is because when implied volatility is high, options prices are also high, and when implied volatility is low, options prices are also low. Therefore, traders use $VIX as a contrarian indicator to help them make decisions about buying or selling options and determining the direction of the trend.
But I want to simplify this greatly by simply drawing your attention to the most obvious correlation between the $VIX a.i. trend forecast and the underlying trend of the S&P 500 Index. Let’s look at the exact same chart of the $VIX, overlayed with the corresponding price action of the S&P 500 Index.
This time notice that these two assets are very strongly inversely correlated.
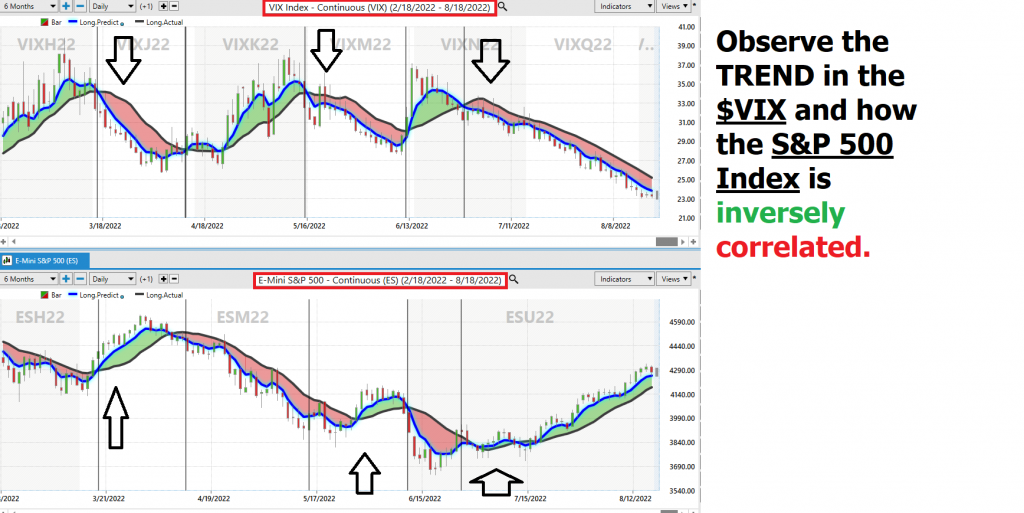
This is not an anomaly.
It is an important secret indicator that seasoned traders look at when they have uncertainty on the direction of the trend. I would compare it to how a sports enthusiast might pay attention to what the Las Vegas bookmakers are saying about the outcome of a sporting event. In this instance traders are simply asking the question, what is the options market volatility ($VIX) telling us about the future? When the $VIX is going lower options prices are becoming less expensive, fear is diminishing, and the result is that stock prices tend to rise. The inverse is also true, when the $VIX is rising, options prices are becoming more expensive, which means that price insurance is being more costly, as this occurs, the stock market tends to fall.
Let’s look at this amazing correlation since the beginning the pandemic and economic lockdown over the past few years.
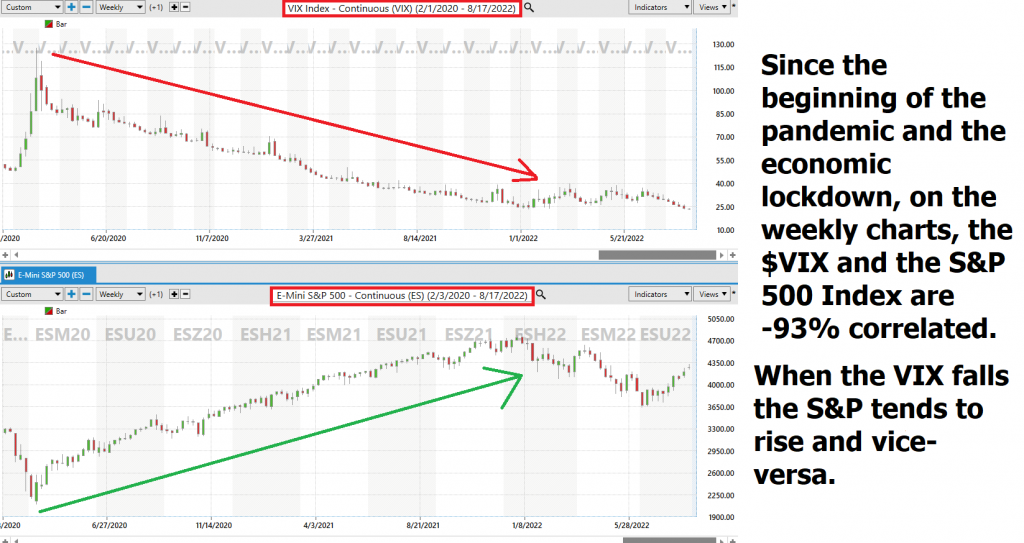
This chart represents the last 30 months of price action on a weekly basis. Statistically speaking the $VIX shows a negative 93% correlation to the price action in the S&P 500 index. In other words, if the VIX falls in value, the S&P will tend to rise 93% of the time on a weekly basis, and vice-versa.
Pretty incredible, isn’t it?
If you are an active S&P trader this knowledge is game changing and all it requires, is for you to start paying attention to the value of the $VIX.
- If the $VIX goes UP stocks tend to go Down.
- If the $VIX goes Down stocks tend to go Up.
Here is a chart of the $VIX with the S&P 500 on the bottom panel over the last two months.
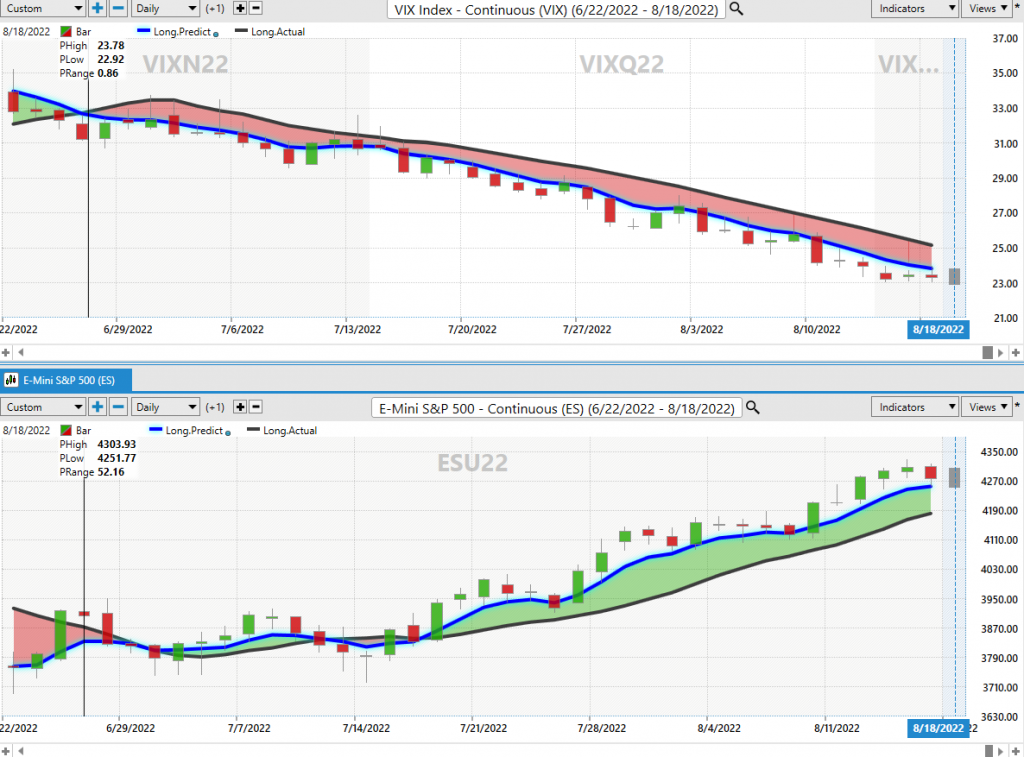
My question to you as you ponder your next trading decision, does your opinion have a better batting average than the $VIX?
Stop and think about all of the talking points that have emerged from the media as news headlines over the last two months. Inflation, budget deficits, trade deficits, currency devaluations, recession disagreements, yield curve concerns, failed earnings reports. There is enough worry in that last sentence to make most traders scared and uncertain about their trading decisions.
However, armed with this practical, simple, and powerful knowledge you can effectively navigate the financial landscape and improve your trading decision process.
This is the kind of information we discuss in our Live Online Masterclass “Learn to Trade With Artificial Intelligence” which I would like to extend an invitation for you to attend.
Our goal and objective in this training is to show traders how artificial intelligence can keep you out of dangerous market environments and more importantly help keep you on the right side, of the right trend at the right time.
The Answer A.I. offers may surprise you.
This is how small traders grow their accounts by taking small bites out of the market consistently.
Today Artificial Intelligence, Machine Learning and Neural Networks are an absolute necessity in protecting your portfolio.
That is why artificial intelligence for traders is so indispensable.
Mistakes are financially costly but for machine learning, it is the pathway to mastery and excellence. The real education in trading always lies in learning from the losers.
Most humans have a really hard time learning from bad experiences. The ego gets in the way, every time.
Since artificial intelligence has beaten humans in Poker, Chess, Jeopardy and Go! do you really think trading is any different?
Knowledge. Useful knowledge. And its application is what A.I. delivers.
This is how Vantagepoint artificial intelligence simplifies and empowers traders daily!
Intrigued?
Discover why artificial intelligence is the solution professional traders go to for less risk, more rewards, and guaranteed peace of mind.
Visit With US and check out the a.i. at our Next Live Training.
It’s not magic. It’s machine learning.
Make it count.
THERE IS A SUBSTANTIAL RISK OF LOSS ASSOCIATED WITH TRADING. ONLY RISK CAPITAL SHOULD BE USED TO TRADE. TRADING STOCKS, FUTURES, OPTIONS, FOREX, AND ETFs IS NOT SUITABLE FOR EVERYONE.IMPORTANT NOTICE!
DISCLAIMER: STOCKS, FUTURES, OPTIONS, ETFs AND CURRENCY TRADING ALL HAVE LARGE POTENTIAL REWARDS, BUT THEY ALSO HAVE LARGE POTENTIAL RISK. YOU MUST BE AWARE OF THE RISKS AND BE WILLING TO ACCEPT THEM IN ORDER TO INVEST IN THESE MARKETS. DON’T TRADE WITH MONEY YOU CAN’T AFFORD TO LOSE. THIS ARTICLE AND WEBSITE IS NEITHER A SOLICITATION NOR AN OFFER TO BUY/SELL FUTURES, OPTIONS, STOCKS, OR CURRENCIES. NO REPRESENTATION IS BEING MADE THAT ANY ACCOUNT WILL OR IS LIKELY TO ACHIEVE PROFITS OR LOSSES SIMILAR TO THOSE DISCUSSED ON THIS ARTICLE OR WEBSITE. THE PAST PERFORMANCE OF ANY TRADING SYSTEM OR METHODOLOGY IS NOT NECESSARILY INDICATIVE OF FUTURE RESULTS. CFTC RULE 4.41 – HYPOTHETICAL OR SIMULATED PERFORMANCE RESULTS HAVE CERTAIN LIMITATIONS. UNLIKE AN ACTUAL PERFORMANCE RECORD, SIMULATED RESULTS DO NOT REPRESENT ACTUAL TRADING. ALSO, SINCE THE TRADES HAVE NOT BEEN EXECUTED, THE RESULTS MAY HAVE UNDER-OR-OVER COMPENSATED FOR THE IMPACT, IF ANY, OF CERTAIN MARKET FACTORS, SUCH AS LACK OF LIQUIDITY. SIMULATED TRADING PROGRAMS IN GENERAL ARE ALSO SUBJECT TO THE FACT THAT THEY ARE DESIGNED WITH THE BENEFIT OF HINDSIGHT. NO REPRESENTATION IS BEING MADE THAT ANY ACCOUNT WILL OR IS LIKELY TO ACHIEVE PROFIT OR LOSSES SIMILAR TO THOSE SHOWN.