This week’s AI stock spotlight is Fortinet ($FTNT)
Fortinet is one of those companies Wall Street ignored for years because it sounded about as exciting as a tax seminar at a Holiday Inn. Then the internet turned into a digital version of the wild west and suddenly everybody realized cybersecurity mattered. The company was founded back in 2000 by brothers Ken and Michael Xie during the dot-com wreckage. Its mission was simple: stop hackers before they steal your money, your secrets, or your grandmother’s Facebook password. The company’s major turning point came when businesses realized cloud computing meant moving all their valuables into a neighborhood where the doors were made of cardboard. Today Fortinet protects enterprises, governments, telecom networks, hospitals, banks, and probably at least one government agency that still uses Internet Explorer. It matters because cyberattacks are now part of modern civilization, right between taxes and potholes.
Fortinet makes cybersecurity hardware and software. Mostly it sells digital guard dogs. The company’s flagship product is the FortiGate firewall, which acts like a nightclub bouncer deciding who gets into the network and who gets thrown into the alley. But Fortinet doesn’t just sell one gadget anymore. It has expanded into secure networking, cloud protection, AI-driven threat detection, operational technology security, and Secure Access Service Edge, which sounds like a Tom Clancy novel but basically means protecting people working remotely.
The important thing traders need to understand is that Fortinet is not just another software subscription company. Fortinet actually builds specialized hardware too. That matters. The company uses custom-designed security chips that help process data traffic faster and cheaper than competitors. In the cybersecurity business, speed matters because hackers work around the clock fueled by caffeine, cryptocurrency scams, and emotional instability.
Fortinet’s biggest revenue drivers are firewall appliances, security subscriptions, and long-term service contracts. Services are becoming increasingly important because recurring subscription revenue is Wall Street’s version of catnip. Investors love predictable cash flow the way raccoons love unattended garbage cans. Roughly two-thirds of revenue now comes from services and subscriptions, which means the business has become steadier and less dependent on giant hardware refresh cycles.
The customer base is huge and diverse. Enterprises, telecom operators, governments, healthcare providers, schools, banks, energy companies, and data centers all need protection. Every time AI expands, cloud traffic explodes, or another ransomware attack hits the headlines, Fortinet gets another sales pitch opportunity. Fear is one of the most reliable recurring revenue models in capitalism.
The company is headquartered in Sunnyvale, California, which is where technology firms go to compete for engineers. Ken Xie still runs the company and remains one of the more respected operators in cybersecurity. Fortinet employs roughly 14,000 people globally and competes directly against heavyweights like Palo Alto Networks, CrowdStrike, Cisco Systems, and Zscaler. Unlike some rivals, Fortinet has managed to combine growth with profitability, which on Wall Street is treated with the same astonishment as spotting a sober pirate.
Financially, Fortinet looks far healthier than many traders realize. Revenue growth reaccelerated sharply in the latest quarter. First quarter 2026 revenue jumped 20% year over year to roughly $1.85 billion, while product revenue exploded 41%. Billings climbed 31%. That is not “nice quarter” territory. That is “something changed” territory.
Margins are enormous. Gross margins hover around 80%, which means Fortinet sells digital security with roughly the same markup movie theaters charge for popcorn. Operating margins are also extremely strong, partly because the company built its own chips and infrastructure years ago instead of outsourcing every important function to somebody else.
Cash generation is another overlooked strength. Fortinet throws off serious free cash flow because cybersecurity subscriptions are sticky. Once a company installs your security infrastructure, replacing it becomes about as enjoyable as changing plumbing inside a submarine. The balance sheet is solid, debt levels are manageable, and the company is nowhere near financially stressed.
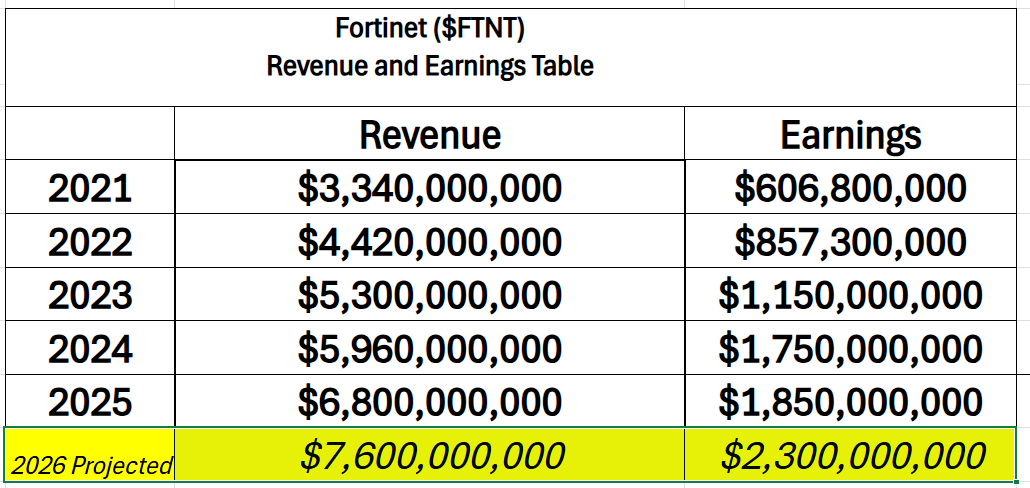
Fortinet’s growth story becomes much more impressive when you look beneath the headline revenue numbers. Revenue has climbed from roughly $3.3 billion in 2021 to a projected $7.6 billion in 2026, which is already strong enough to make Wall Street smile. But the real story is earnings growth. Earnings are projected to rise from about $607 million to $2.3 billion over the same period, which means profits are growing significantly faster than sales.
That matters because it signals improving efficiency. Fortinet is not just selling more cybersecurity products. It is squeezing more profit out of every dollar of revenue. In plain English, the company is becoming a better machine. Higher margins, recurring subscription revenue, economies of scale, and disciplined spending are allowing earnings to accelerate faster than top-line growth.
This is one of the reasons institutional traders continue gravitating toward the stock. Plenty of technology companies can grow revenue when money is cheap and investors are optimistic. Far fewer can dramatically expand profitability at the same time. Fortinet’s numbers suggest management is not simply chasing growth for growth’s sake. They are building a business that converts rising cybersecurity demand into increasingly powerful cash generation.
What traders often misunderstand is this: Fortinet is not priced like a slow utility stock anymore, but it also is not the unprofitable “growth at any cost” software story people associate with speculative tech. It sits in a weird middle ground where it behaves partly like a mature cash machine and partly like an AI infrastructure growth story. That combination is exactly why institutions keep buying it.
Right now traders are asking three giant questions.
First, is cybersecurity becoming an AI arms race? The answer appears to be yes. AI is helping hackers launch attacks faster, automate phishing campaigns, and exploit vulnerabilities at industrial scale. That means companies need stronger defenses. Fortinet management leaned heavily into this narrative during earnings, and Wall Street loved it.
Second, can Fortinet keep accelerating growth after a rough patch in 2024 and early 2025? Traders worried the firewall market was slowing. Then the latest quarter arrived and smashed expectations like a monster truck rally held inside a library. The market now believes demand has reaccelerated.
Third, can Fortinet compete against cloud-native rivals? This is the debate underneath the stock. CrowdStrike and Zscaler have been treated as flashy modern cloud-first security firms while Fortinet was sometimes viewed as old-school hardware. But the recent results suggest customers still value integrated networking and security systems. In fact, AI data centers and massive network traffic may actually favor Fortinet’s hardware-plus-software model.
Now let’s talk about what has actually moved the stock during the last 30 days.
The obvious catalyst was earnings. Fortinet crushed estimates. Revenue, EPS, margins, and billings all came in above expectations. Then management raised full-year guidance. Traders love upward guidance revisions the way Labrador retrievers love tennis balls.
But the bigger story hiding underneath earnings is institutional confidence. The market had been worried AI would commoditize cybersecurity software. Instead, AI appears to be increasing demand because cyber threats are becoming more sophisticated and nonstop. Fortinet’s earnings essentially told Wall Street: “Congratulations. The problem is getting worse.” That is bullish for cybersecurity companies.
What is already priced in? A lot of optimism. After the earnings explosion, traders are no longer treating Fortinet like a sleepy firewall vendor. Expectations have risen dramatically. The stock now assumes continued strong enterprise spending and sustained cybersecurity demand.
What Wall Street may still be missing is the operational technology security opportunity. Factories, utilities, transportation systems, and infrastructure networks increasingly need protection. Cybersecurity is no longer just about laptops and office Wi-Fi. It is about pipelines, manufacturing equipment, hospitals, and electrical grids. Modern warfare and industrial infrastructure now overlap with cybersecurity.
There is also another irony here. Traders keep lumping Fortinet into software. But a meaningful part of its strength comes from physical infrastructure spending tied to networking and AI traffic growth. AI data centers require security everywhere. Every new AI deployment creates more network traffic. More traffic means more vulnerability points. More vulnerability points mean more Fortinet sales opportunities.
That is part of why the stock has rallied so hard over the past 90 days. Yes, cybersecurity demand improved. But the broader AI infrastructure trade helped too. Traders chasing semiconductors, networking, and AI infrastructure started looking for adjacent beneficiaries.
This is where the comparison to SOXL matters. The semiconductor trade has been absolutely ferocious. Leveraged semiconductor ETFs exploded higher because AI infrastructure spending became the hottest story in markets. Data centers need chips. Chips need networking. Networking needs cybersecurity. Fortinet got pulled into that current.
The semiconductor rally helped create bullish momentum across the entire AI infrastructure ecosystem. Fortinet became part cybersecurity story, part AI infrastructure trade, and part institutional momentum darling.
Year-to-date, the stock is up because three narratives aligned perfectly.
AI-driven cyber threats are increasing.
Enterprise spending remained resilient.
Fortinet’s margins proved stronger than expected.
The data mattered more than the storytelling. Billings growth accelerating to 31% was the giant flashing neon sign. Traders focus on billings because it signals future revenue momentum.
Analysts are mostly right to be bullish here. The evidence supports stronger demand trends and improving execution. But analysts also have a long history of extrapolating good conditions forever.
The biggest assumption analysts may still underestimate is competitive pressure. Cybersecurity changes quickly. One bad product cycle or one major breach can shift customer trust overnight. This industry is brutally unforgiving.
What could go right from here? Continued AI infrastructure growth, escalating cyber threats, government security spending, and expanding enterprise refresh cycles could all push Fortinet higher. If operational technology security really accelerates, the company could see another major leg of growth.
The single biggest upside surprise would be Fortinet becoming viewed less as a cybersecurity vendor and more as core AI infrastructure plumbing. That kind of valuation rerating could push multiples significantly higher.
What could go wrong? Enterprise IT spending could weaken if the economy slows. Competition could intensify. Large customers could delay hardware refreshes. Or investors could decide the stock moved too far too fast after earnings.
The single biggest blind spot traders should respect is expectations risk. Once Wall Street falls in love with a stock, merely “good” results can trigger violent selloffs. Stocks do not collapse because companies are bad. They collapse because expectations became insane.
Here are the top three catalysts traders should watch next.
Second quarter earnings in early August 2026. This matters because traders will want proof the explosive Q1 momentum was real and sustainable.
Major cybersecurity conferences throughout summer 2026. Product announcements and AI security commentary can move sentiment quickly in this sector.
Federal spending and infrastructure security developments during the second half of 2026. Governments globally are increasing cybersecurity budgets as geopolitical tensions rise.
For the trend to continue, three things must stay true.
Cybersecurity demand must remain strong.
Billings growth must remain elevated.
Margins must stay healthy.
The early warning sign would be slowing billings growth combined with weaker guidance. That would suggest customers are delaying spending or competitors are gaining share. In this market, slowing momentum gets punished.
Fortinet remains one of the cleaner institutional growth stories in technology right now. The company sells fear reduction in a world becoming more digitally dangerous by the hour. That is a pretty durable business model. Civilization keeps adding more connected devices, more cloud traffic, more AI systems, and more opportunities for criminals, governments, and bored teenagers in hoodies to cause chaos.
Which means Fortinet probably keeps getting invited to the party. At least until the market decides it has had too much punch again.
In this analysis we will review and evaluate forecasts using the following set of indicators and tools.
Wall Street Analysts Ratings and Forecasts
52 Week High and Low Boundaries
Best-Case / Worst-Case Scenario Analysis
VantagePoint AI Predictive Blue Line
Neural Network Forecast (Machine Learning)
VantagePoint AI Daily Range Forecast
Intermarket Analysis
Our Suggestion
We rely upon artificial intelligence to guide our trading decisions. But intelligent speculation requires more than signals alone. We also study the underlying fundamentals to determine whether the business reality supports the technical story unfolding on the chart. When fundamentals and price action move in harmony, the probabilities often shift dramatically in the trader’s favor.
Wall Street Analysts Price Forecasts
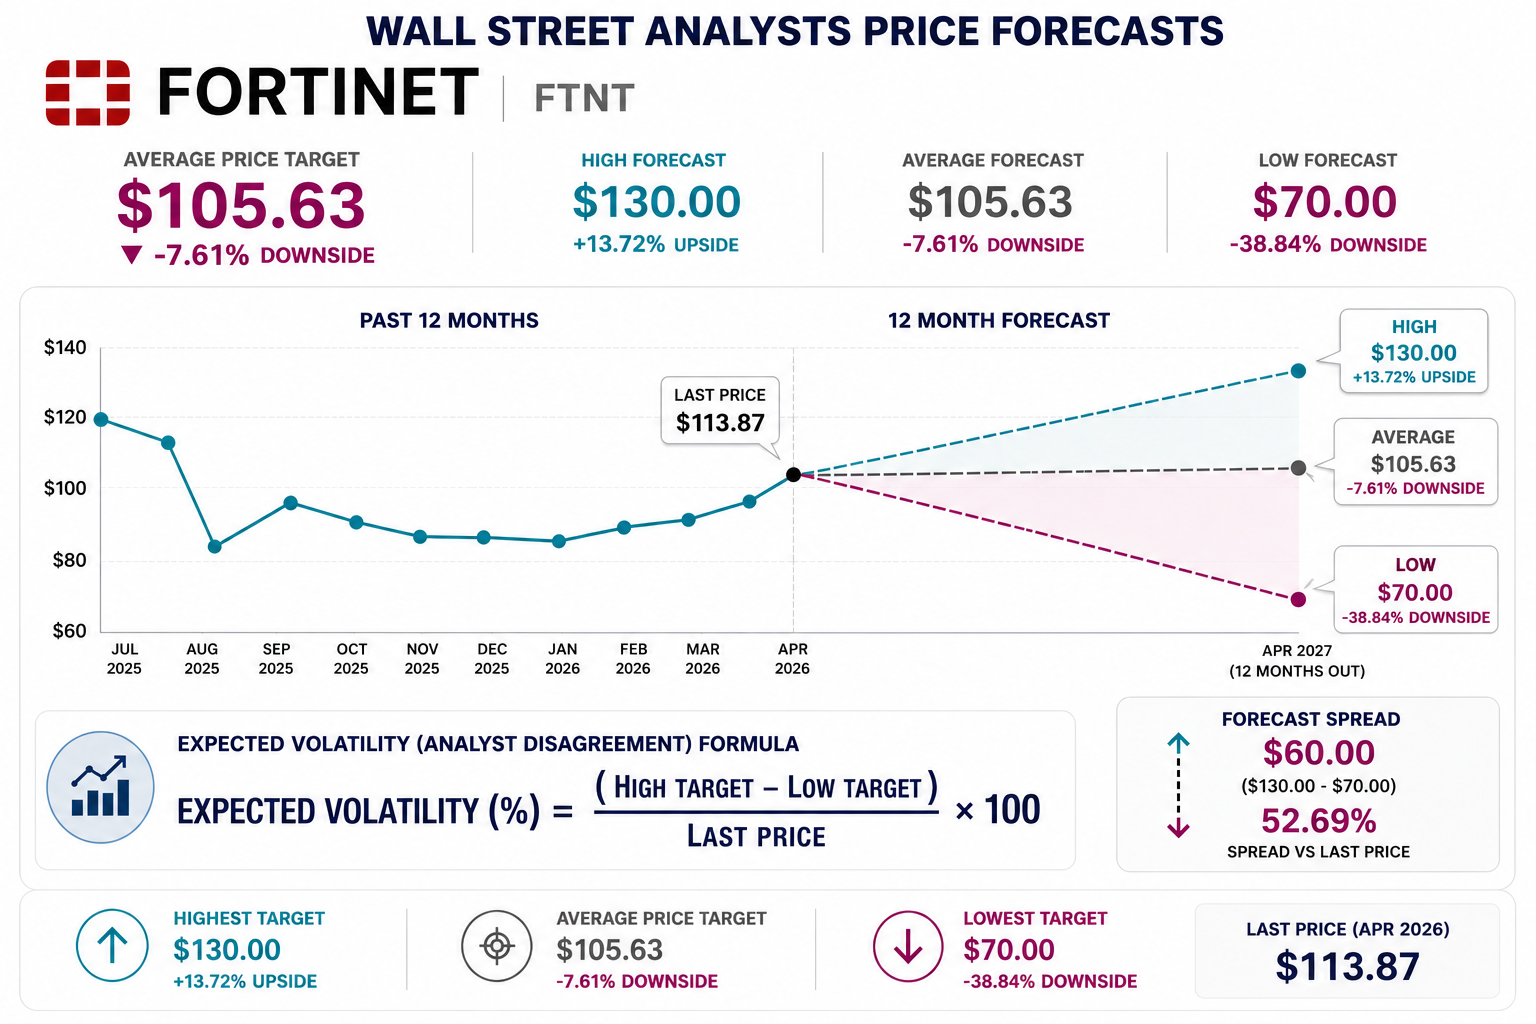
Wall Street’s view on Fortinet tells you almost everything you need to know about the current market environment. The average analyst price target sits at $105.63, below the recent closing price of $113.87, implying modest downside from current levels. But the real story is not the average. It is the extraordinary disagreement underneath the surface. The highest target on the Street is $130, while the lowest sits all the way down at $70. That is a forecast spread of 52.69% of the current price, which is Wall Street’s way of saying uncertainty around cybersecurity spending, enterprise demand, valuation, and future growth remains unusually high.
This is what happens when a company becomes strategically important while simultaneously becoming expensive. Fortinet sits at the center of several powerful trends: digital infrastructure expansion, rising cyber threats, AI-driven security demands, and corporate network modernization. But markets rarely reward great stories without demanding equally great execution. Analysts are effectively debating whether Fortinet deserves a premium multiple as a dominant cybersecurity platform, or whether slowing growth and tougher competition justify a meaningful reset in expectations.
For traders, this type of dispersion matters because large disagreements among analysts often translate directly into volatility around earnings reports, guidance revisions, and macroeconomic headlines. In other words, Wall Street is not calmly forecasting the future here. It is negotiating it in real time. The stock’s next major move will likely depend less on what analysts currently think and more on whether Fortinet can continue proving that cybersecurity spending remains mission-critical even in a world where corporations are becoming increasingly selective about where every dollar gets allocated.
52-Week High and Low Boundaries
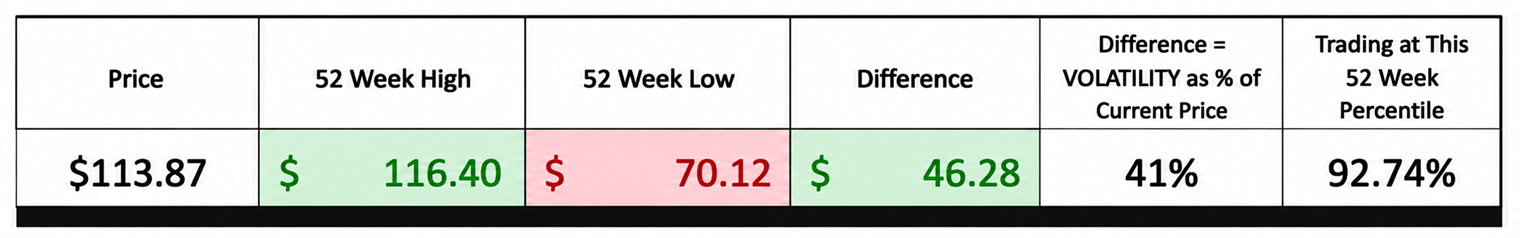
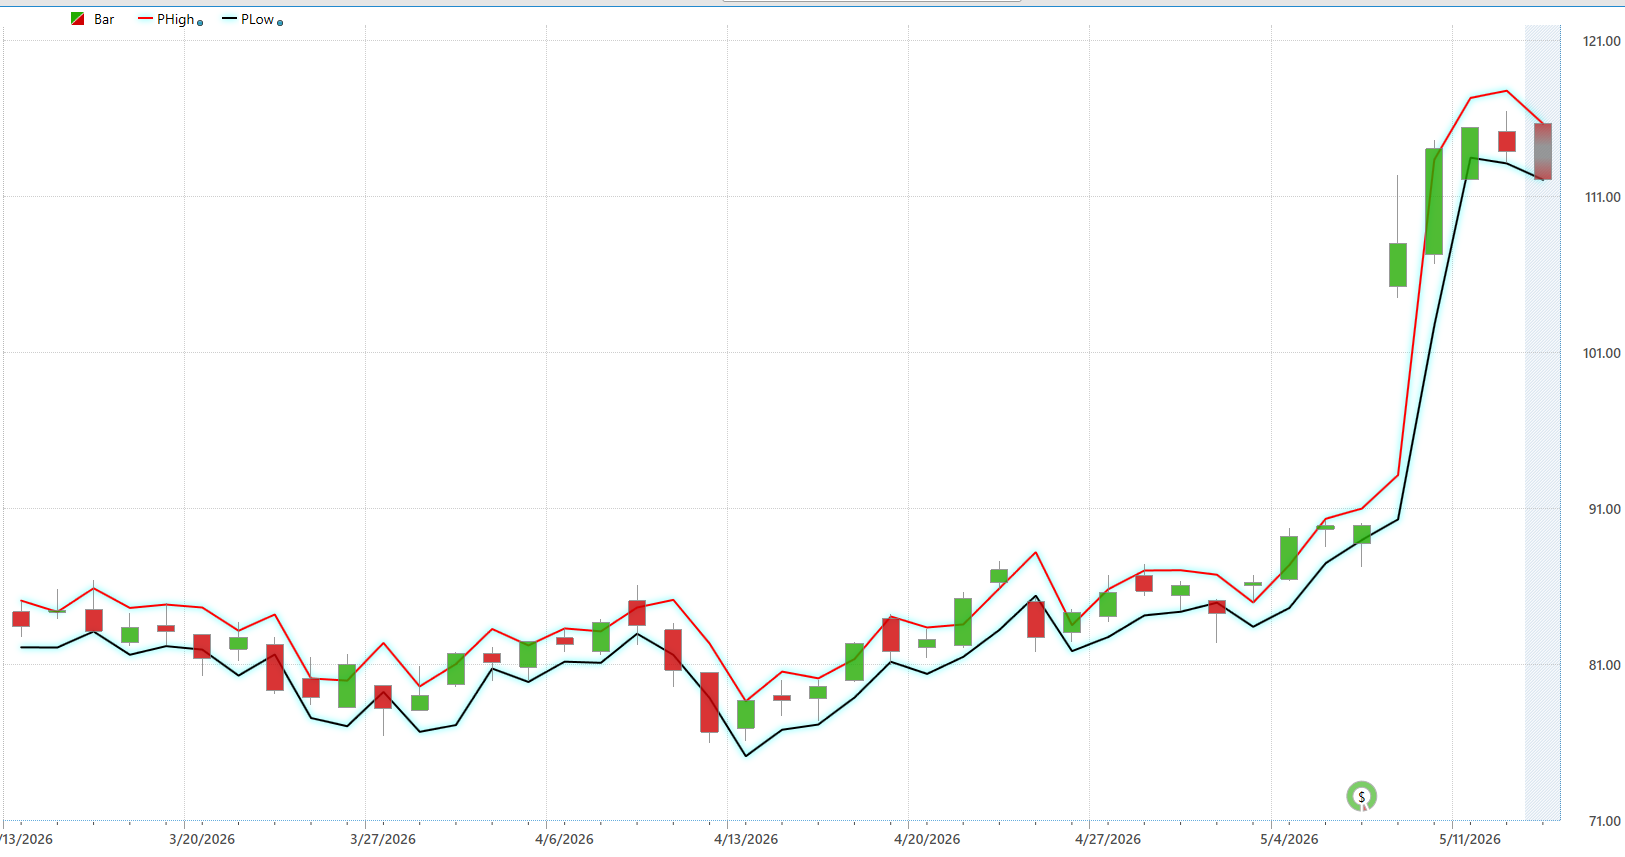
The chart on Fortinet tells a very different story than the average Wall Street analyst target. While analysts debate whether the stock should be worth $70 or $130, price itself is doing something far more important. It is testing the upper boundary of its entire 52-week trading range. The current 52-week high sits near $116.46, while the 52-week low rests near $70.12. That means the stock has already traveled roughly 66% from its lowest level back toward the top of its range. In trading terms, that is not stabilization. That is momentum.
What makes this chart especially important is the violence of the recovery. Last summer, Fortinet experienced a brutal collapse that wiped out months of gains in just a few weeks. Many stocks never psychologically recover from those kinds of breaks because institutional money tends to move on quietly while retail investors remain trapped hoping for recovery. But that is not what happened here. Over the past several months the stock methodically rebuilt its structure, reclaimed lost ground, and is now pressing directly into the upper edge of resistance. That tells you buyers are still aggressively willing to accumulate shares despite elevated valuations and broad uncertainty across technology markets.
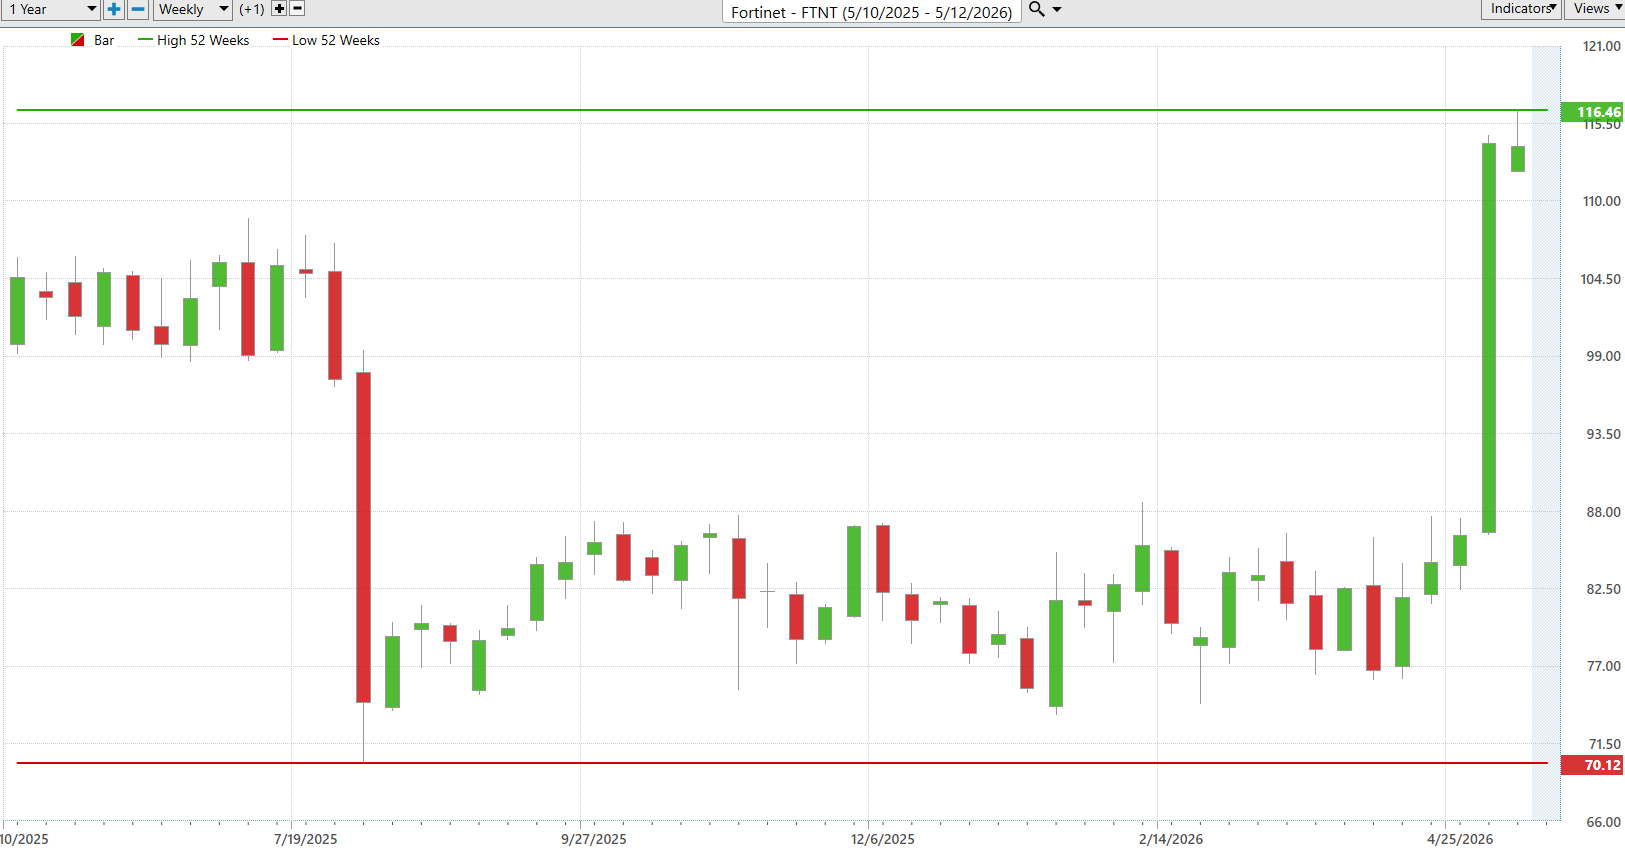
From a trader’s perspective, the most important lesson is simple: strong stocks behave differently near their highs than weak stocks do. Weak stocks retreat from resistance. Strong stocks camp underneath it. The closer price remains to a 52-week high without collapsing, the more pressure builds for a potential breakout into price discovery. And if Fortinet successfully clears the $116.46 boundary with conviction, Wall Street’s analyst targets may suddenly start chasing the stock higher instead of trying to define its ceiling.
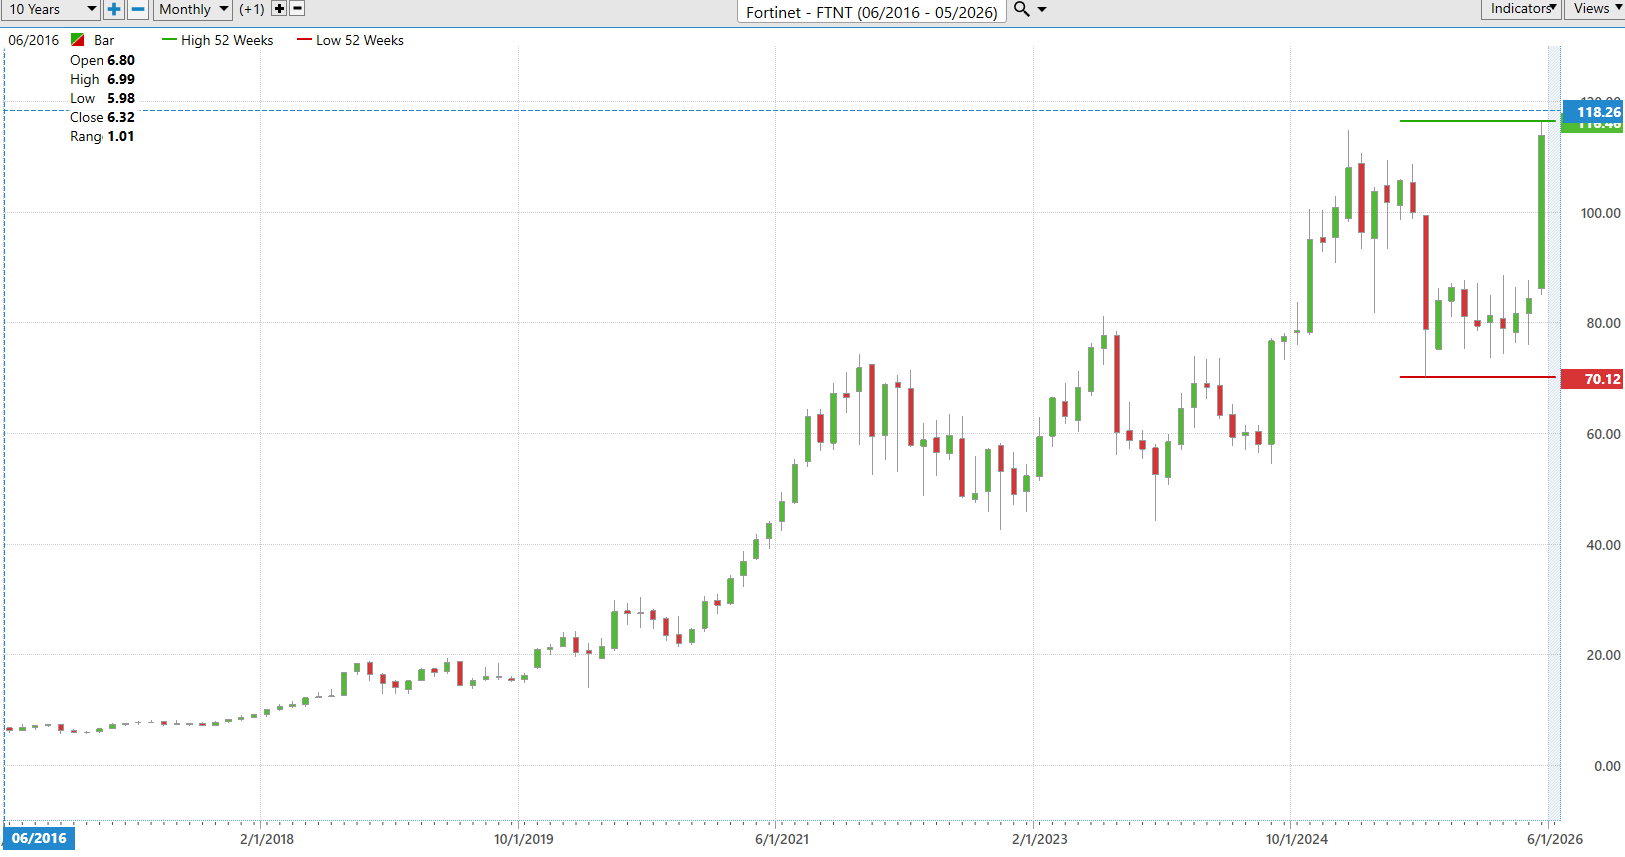
There is a reason we obsess over stocks making simultaneous new 52-week highs and new 10-year highs. That is where institutional money stops “testing” positions and starts aggressively accumulating shares because the market is signaling demand is overwhelming supply across every meaningful time frame. Right now, Fortinet checks both boxes, which instantly places it into one of the strongest momentum categories a trader can monitor. You do not need a PhD in finance to understand the implication here: when a stock is pushing into territory it has never traded at before while most investors are still debating whether it is “too high,” that is often exactly when the biggest trends are just getting started.
Best-Case/Worst-Case Scenario Analysis
There is an old Wall Street truth that most traders never fully appreciate until the market humiliates them personally: volatility is not theoretical. It is emotional. It is financial. And it is always larger than people expect while they are comfortably sitting on the sidelines. That is why studying the largest uninterrupted rallies and declines over the last 52 weeks is not an academic exercise. It is preparation. The attached charts for Fortinet ($FTNT) reveal exactly what intelligent traders should be measuring before they ever place a trade.
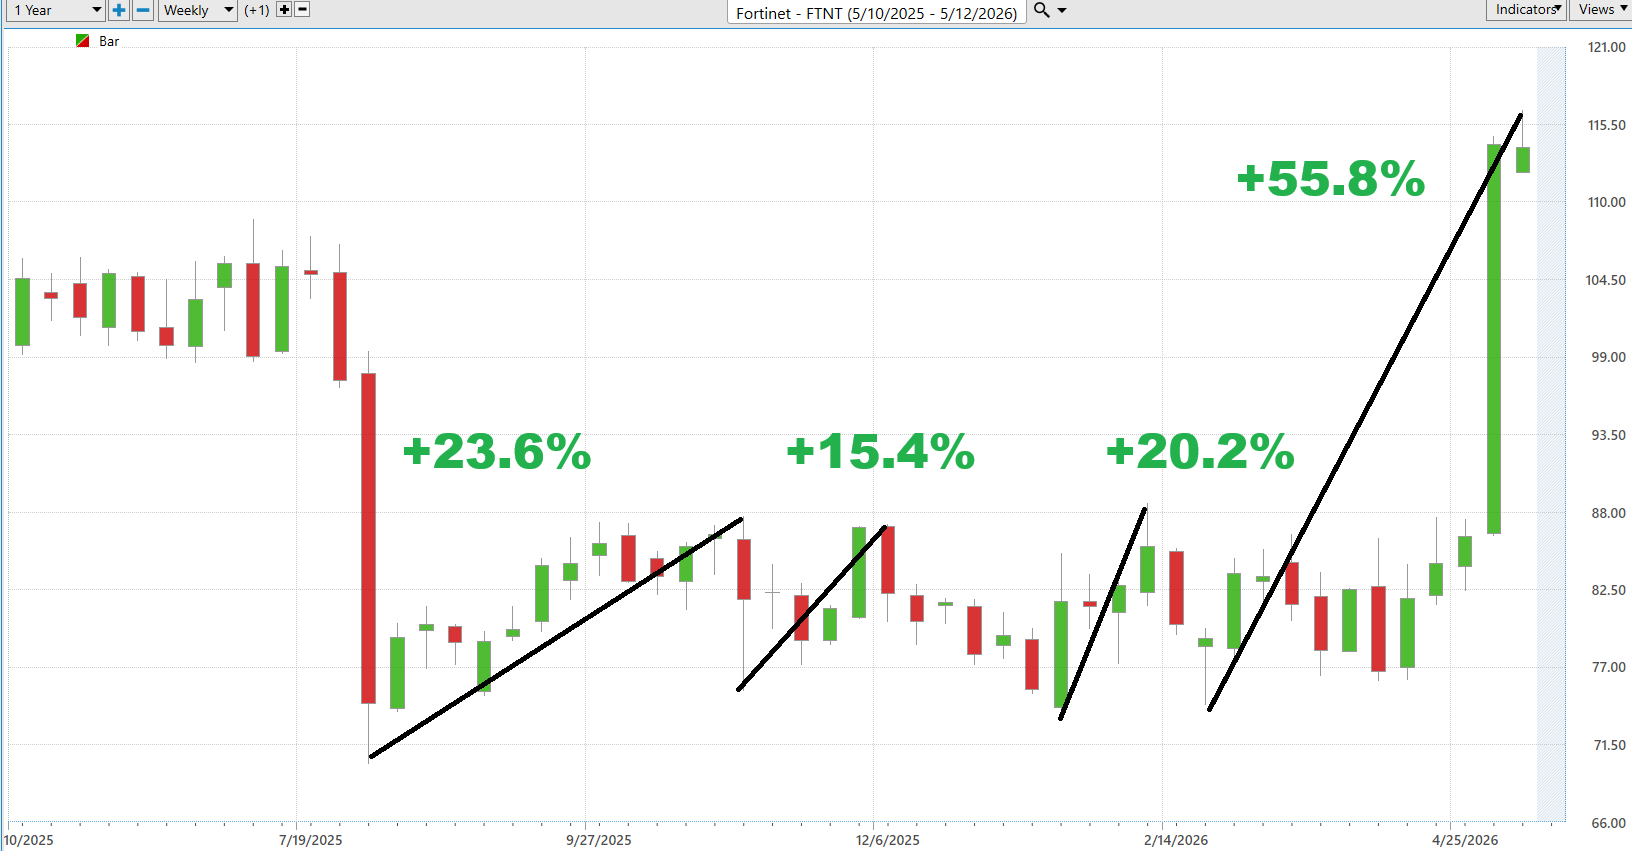
The first chart tells a remarkable story. Over the last year, $FTNT produced multiple powerful advances of +23.6%, +15.4%, +20.2%, and a breathtaking +55.8% rally. These are not random fluctuations. They are evidence of institutional accumulation and aggressive demand. Great stocks rarely move in straight lines, but when leadership emerges, it often advances in explosive waves that are far larger than the average investor expects. A trader studying these rallies immediately recognizes an important reality: when momentum captures Wall Street’s imagination, price can travel dramatically farther and faster than logic alone would predict.
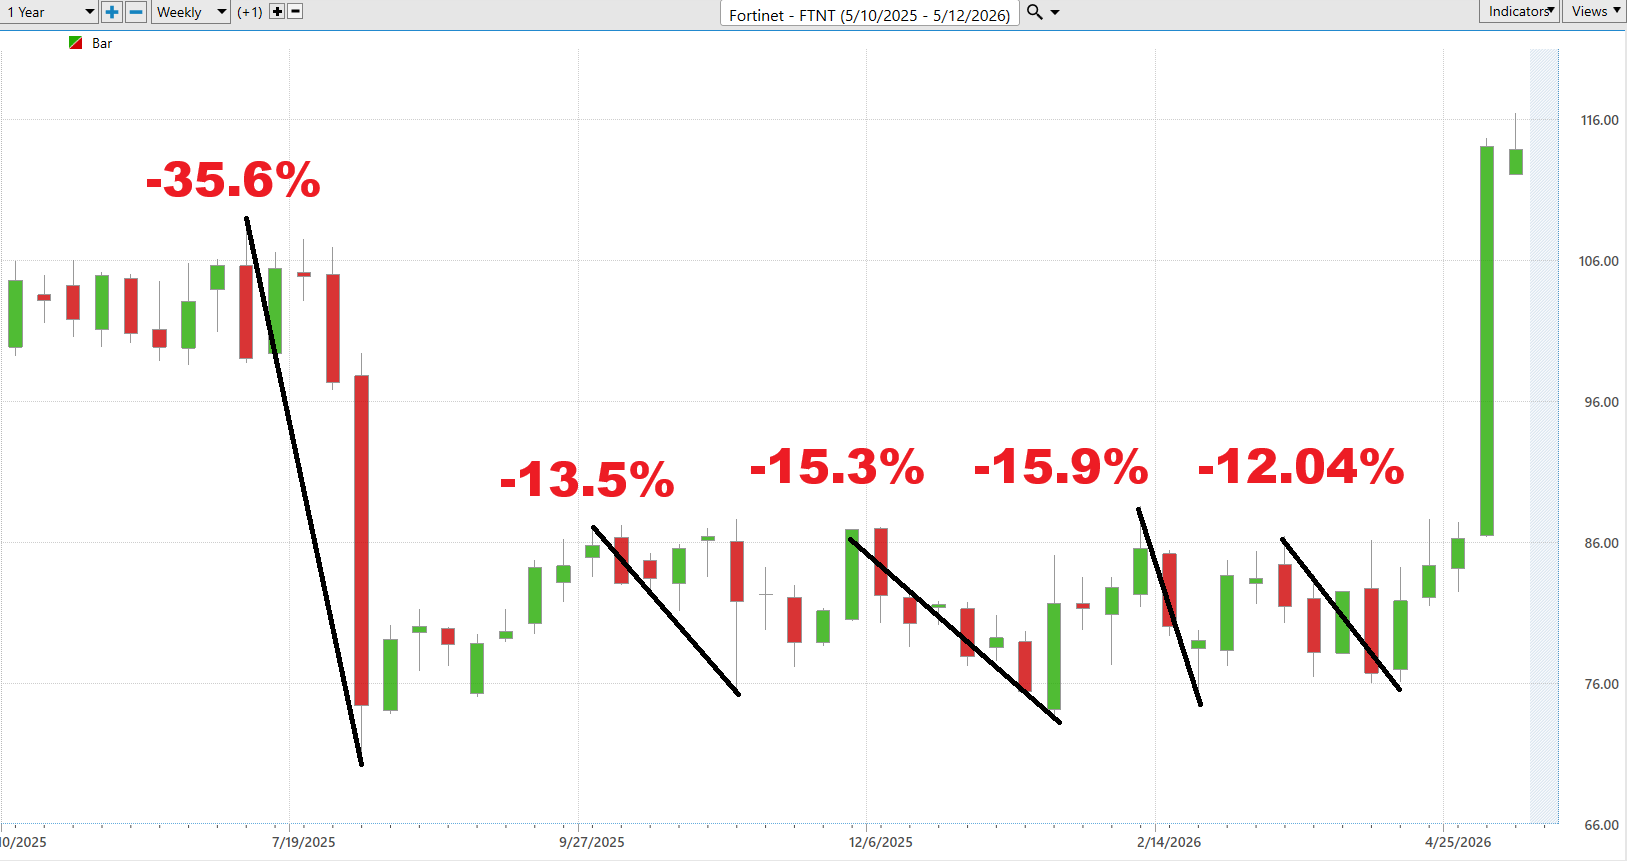
Now compare that optimism against the second chart. The same stock also experienced sharp corrections of -35.6%, -13.5%, -15.3%, -15.9%, and -12.04% during the exact same period. This is the part of trading most people prefer to ignore. Strong stocks are not comfortable stocks. Leadership attracts volatility because institutions compete aggressively for position. The weak hands panic. The headlines change daily. Fear enters the room. And unless a trader understands these historical downside movements in advance, they often abandon good positions at precisely the wrong moment.
This is why the most practical traders in the world begin with the scoreboard of historical reality rather than prediction. The best-case scenario establishes what the market has already demonstrated it is capable of rewarding. The worst-case scenario establishes the pain threshold that history suggests may occur again. Together, these measurements create something infinitely more valuable than hope or opinion: rational expectations. They allow traders to define opportunity, position size intelligently, manage emotional risk, and avoid catastrophic decision-making under pressure.
Great trading is based on facts, not wishful thinking. The same principle governs intelligent speculation. The trader who studies the largest rallies and declines of a stock like $FTNT is not attempting to predict the future with certainty. He is simply learning the boundaries of possibility. And in markets, understanding the boundaries of possibility is often the difference between disciplined success and expensive regret.
Next we compare $FTNT to the broader stock market averages.
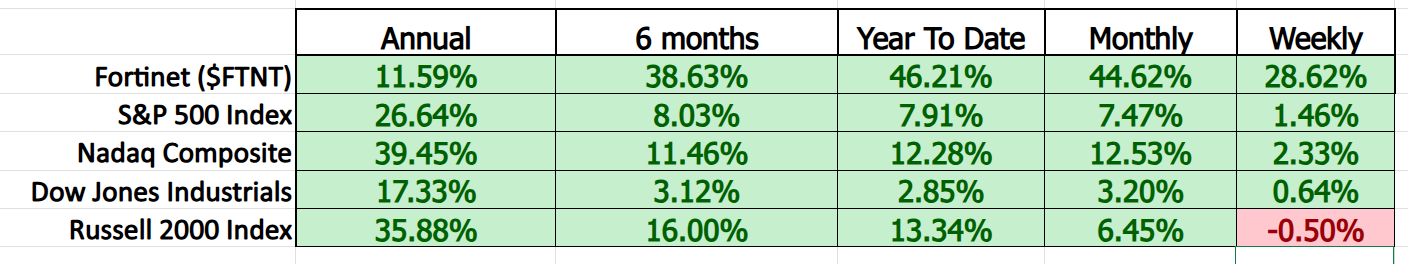
The attached comparison scoreboard reveals something very important about Fortinet ($FTNT) right now: leadership has dramatically accelerated beneath the surface. While most traders continue staring at the major indexes, $FTNT has quietly separated itself from nearly every major benchmark over the shorter-term time frames that matter most to active traders. Over the last week alone, $FTNT gained 28.62%, while the S&P 500 Index advanced only 1.46% and the Nasdaq Composite rose just 2.33%. That is not normal market participation. That is relative strength announcing itself loudly.
What makes this especially interesting is the shift in momentum profile. On an annual basis, $FTNT actually trails the Nasdaq Composite, the Russell 2000 Index, and even the S&P 500 Index. But once you shorten the time horizon to six months, year-to-date, monthly, and weekly performance, the picture changes dramatically. Suddenly $FTNT becomes the dominant leader across the board. This kind of transition often matters because institutional money rarely rotates into a stock all at once. Leadership usually begins quietly, strengthens gradually, and then accelerates aggressively once Wall Street realizes the trend is real.
The scoreboard also exposes something traders frequently misunderstand about market averages. The indexes themselves are showing relatively modest performance over shorter-term periods, yet individual leadership stocks like $FTNT are moving with tremendous force underneath the surface. This is the definition of a selection market. Capital is not flowing evenly into everything. It is concentrating into specific names demonstrating superior momentum, earnings confidence, and institutional sponsorship. The trader who learns to identify these pockets of strength early gains a tremendous advantage over those still trying to predict what the entire market should do next.
Most importantly, this type of relative strength tends to become self-reinforcing. Strong stocks attract attention. Attention attracts momentum traders, institutional positioning, analyst upgrades, and media coverage. That does not guarantee higher prices tomorrow morning. Nothing in markets is guaranteed. But history repeatedly shows that stocks materially outperforming major indexes across multiple shorter-term time frames deserve very close attention because winners often keep on winning far longer than most traders believe possible.
Vantagepoint AI Predictive Blue Line
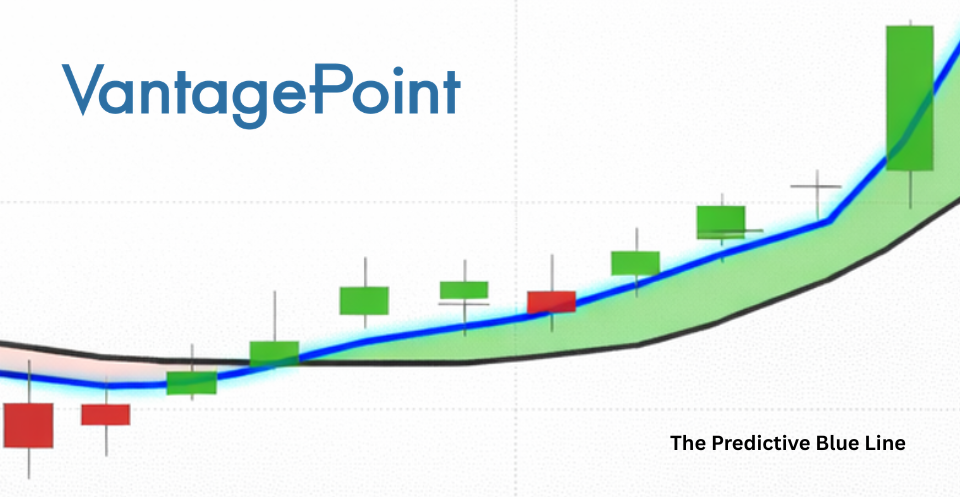
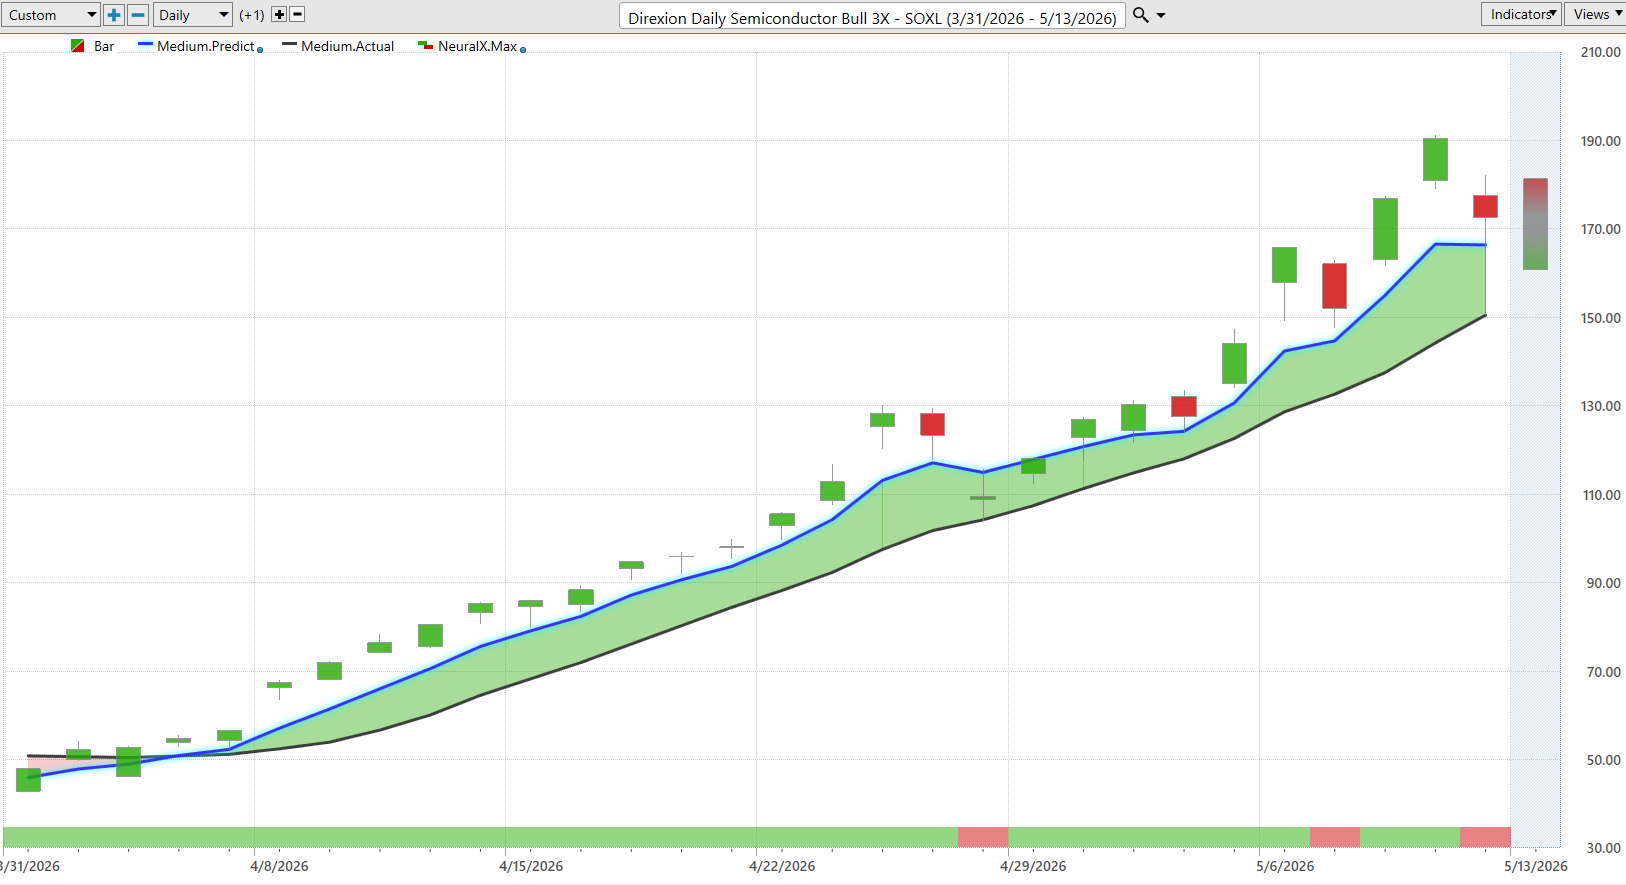
The Predictive Blue Line chart on Fortinet ($FTNT) showcases exactly why the slope direction of the Predictive Blue Line matters so much to traders. The blue line is designed to forecast the future direction of short-term price movement. The black line represents the traditional 10 day moving average, which only tells you what has already happened. In other words, one is attempting to forecast future trend direction while the other simply reports history after the fact. That distinction is enormous when real money is involved.
Notice what began developing in late April. The Predictive Blue Line turned higher first, well before the explosive acceleration in price became obvious to the broader market. Then the separation between the blue line and the black line widened dramatically as momentum intensified. This widening spread is often a very important clue because it suggests that upward trend pressure is strengthening faster than normal. By the time most traders emotionally recognized the move, $FTNT had already experienced a major portion of the advance.
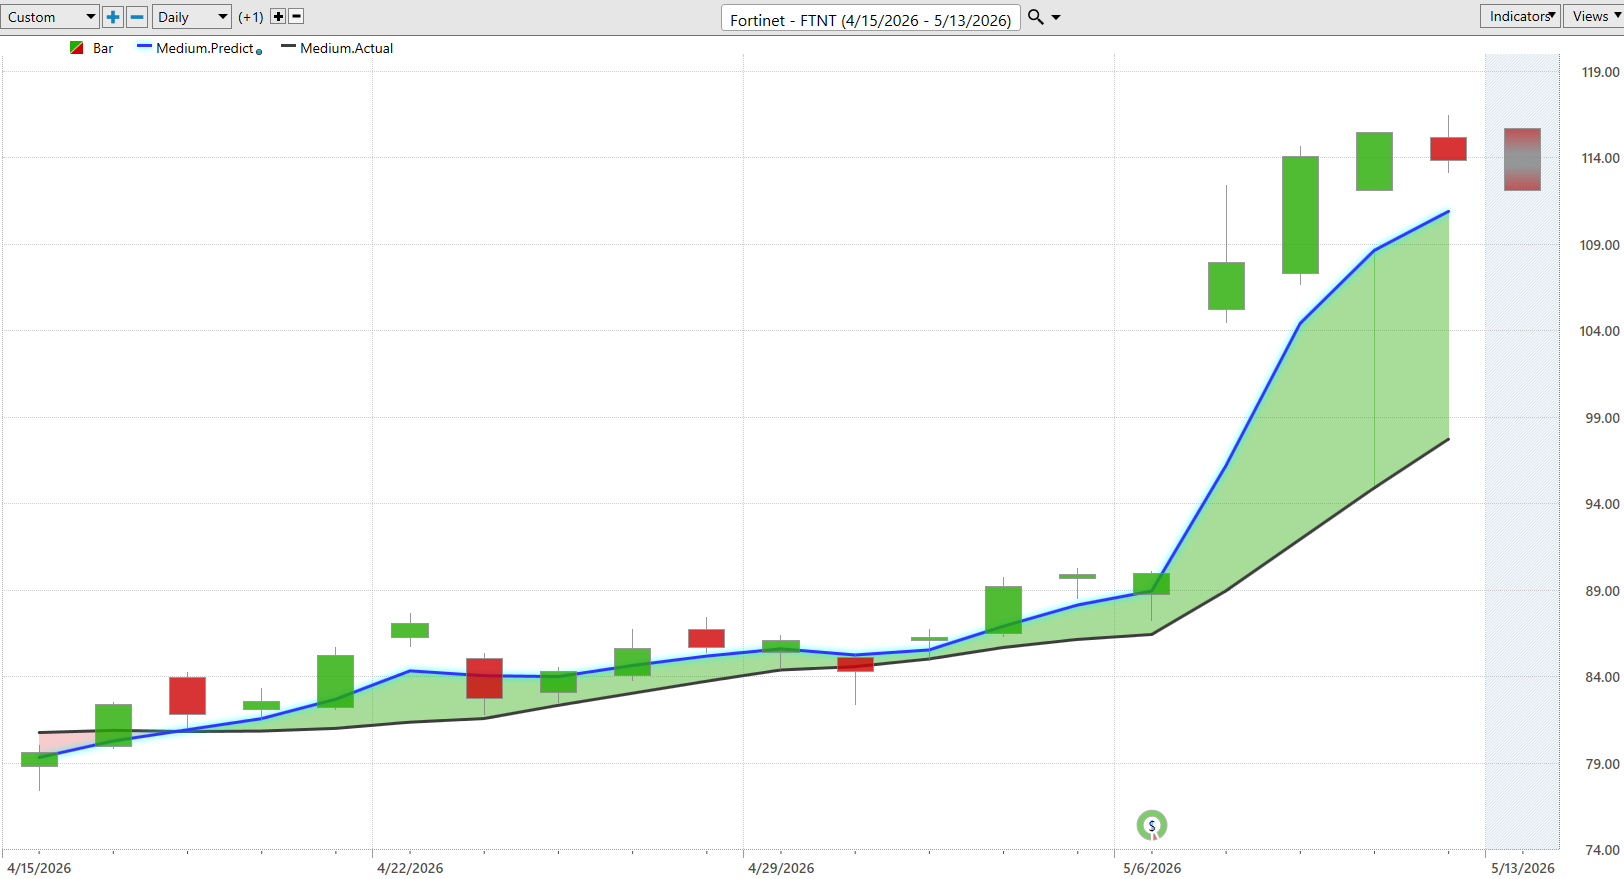
One of the most important concepts traders must understand is that trends rarely move in straight lines forever. Markets breathe. They surge, consolidate, pause, and retrace. That is why professional traders pay very close attention to pullbacks toward the Predictive Blue Line during strong uptrends. In powerful bullish environments, these pullbacks frequently become areas where opportunity reappears while fear temporarily shakes weaker traders out of their positions.
The real lesson from this chart is not simply that $FTNT rallied aggressively. It is that the Predictive Blue Line identified and confirmed the strengthening trend structure early while the majority of traders were still reacting emotionally to headlines, opinions, and noise. The slope direction of the Predictive Blue Line remains one of the simplest and most practical ways to determine whether momentum is strengthening, weakening, or beginning to reverse. And in trading, staying aligned with the dominant trend is often far more important than trying to predict every short-term twist and turn.
VantagePoint AI Neural Index (Machine Learning)
The chart below of Fortinet ($FTNT) highlights one of the most important concepts traders can learn about the Neural Index: short-term strength and weakness often reveal themselves before the crowd emotionally reacts to price movement. The Neural Index is designed to forecast probable market direction over the next 48 to 72 hours using artificial intelligence and intermarket analysis. When the Neural Index turns green, it signals that short-term market conditions are statistically favoring higher prices. When it turns red, it warns traders that momentum may weaken and that price often reverts back toward the Predictive Blue Line or lower.
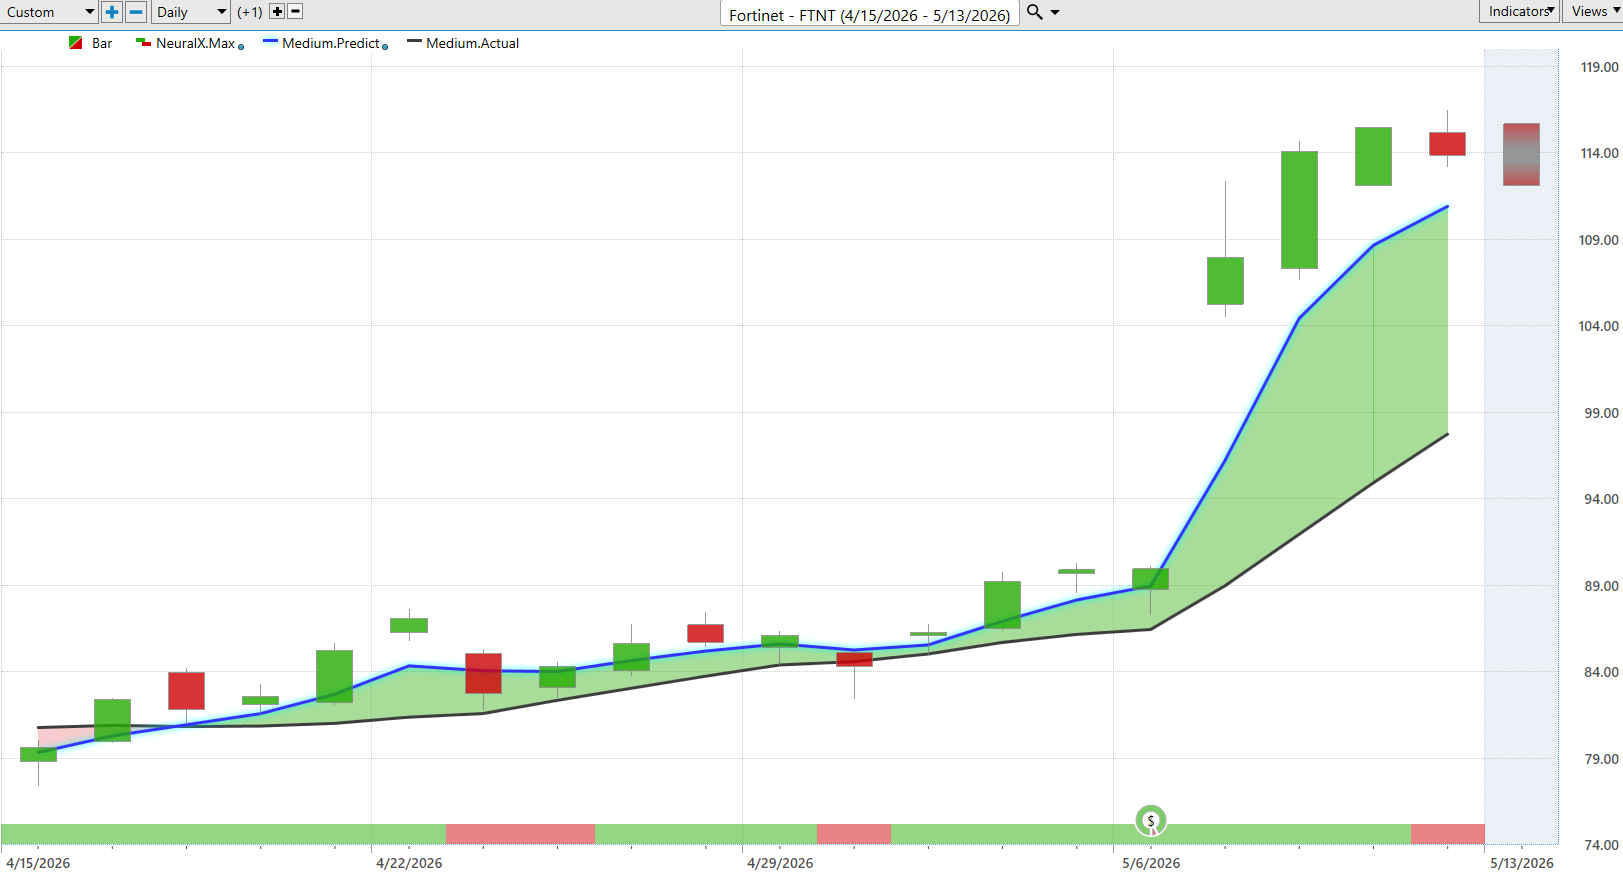
What stands out immediately in this chart is the consistency of the green Neural Index readings during the explosive advance in $FTNT. Notice how the Neural Index remained overwhelmingly bullish while the Predictive Blue Line continued sloping sharply upward. This alignment is extremely important because one of the highest probability trading environments occurs when both the Predictive Blue Line and the Neural Index are confirming the same directional trend simultaneously. In simple terms, the larger trend and the short-term forecast were working together rather than fighting each other.
Equally important are the brief periods where the Neural Index turned red. These moments acted as early warnings that short-term exhaustion or consolidation could develop. In many cases, a red Neural Index during an uptrend coincides with price pulling back toward the Predictive Blue Line as traders temporarily take profits or momentum pauses. Professional traders understand that these short-term warnings are not necessarily signals that the larger uptrend is over. Often they are simply alerts that volatility and reversion risk are increasing over the immediate short-term window.
The broader lesson is that markets are not static. Trends expand and contract continuously. The Neural Index attempts to identify these short-term shifts before they fully appear in price action alone. That is why traders pay close attention when the Neural Index and Predictive Blue Line align together. When both indicators confirm bullish conditions simultaneously, strong trends often accelerate. When they diverge, traders become more cautious because the probability of consolidation, pullback, or increased volatility rises materially. In the case of $FTNT, the persistent alignment between the bullish Neural Index and sharply rising Predictive Blue Line helped confirm one of the strongest momentum advances the stock has experienced in months.
VantagePoint AI Daily Range Forecast
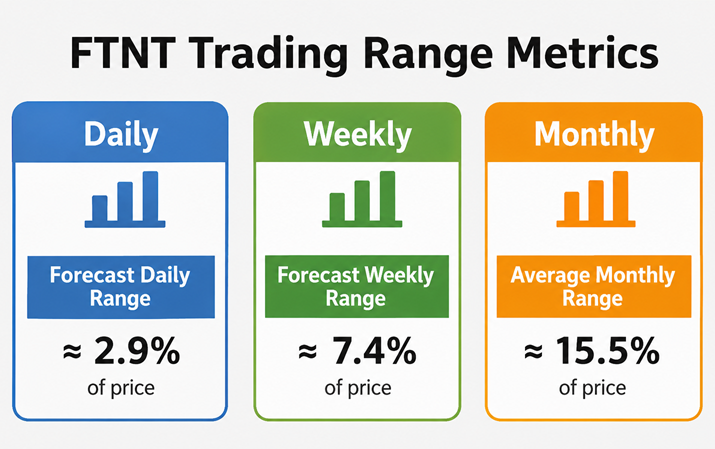
All traders recognize the dangers and opportunities hidden within volatile markets. But what every trader really wants to know is simple: where is the risk and opportunity today? That is precisely what the VantagePoint AI Daily Range Forecast is designed to answer. It does not merely tell traders that volatility exists. It attempts to define the boundaries where price movement is statistically most likely to occur before the next trading session even begins.
In the case of Fortinet, those boundaries have become increasingly important because volatility is expanding alongside momentum. The trading range metrics show an expected daily move of approximately 2.9%, a projected weekly range near 7.4%, and an average monthly range approaching 15.5% of price. On a stock trading near $113.87, that translates into an expected daily movement of roughly $3.30 in either direction. For active traders, that is not trivial noise. It is the battlefield where profit and loss decisions are made every single day.
What makes the current setup especially noteworthy is how dramatically the character of the chart has changed in a relatively short period of time. For much of March and April, Fortinet traded in a fairly controlled pattern with orderly projected highs and lows. Then institutional buying pressure accelerated sharply, driving the stock into a near-vertical breakout phase that pushed shares toward new highs. As price expanded higher, the projected range bands widened as well, signaling that volatility itself was now becoming part of the story.
This is why sophisticated traders obsess over forecast ranges instead of reacting emotionally to headlines. Markets are constantly repricing expectations in real time. A projected daily range is not a prediction carved into stone. It is a probabilistic map of where opportunity and danger are likely to exist as money flows through the market. In a stock like Fortinet, where momentum, institutional demand, and elevated expectations are now colliding simultaneously, understanding those boundaries can mean the difference between controlled decision-making and emotional speculation.
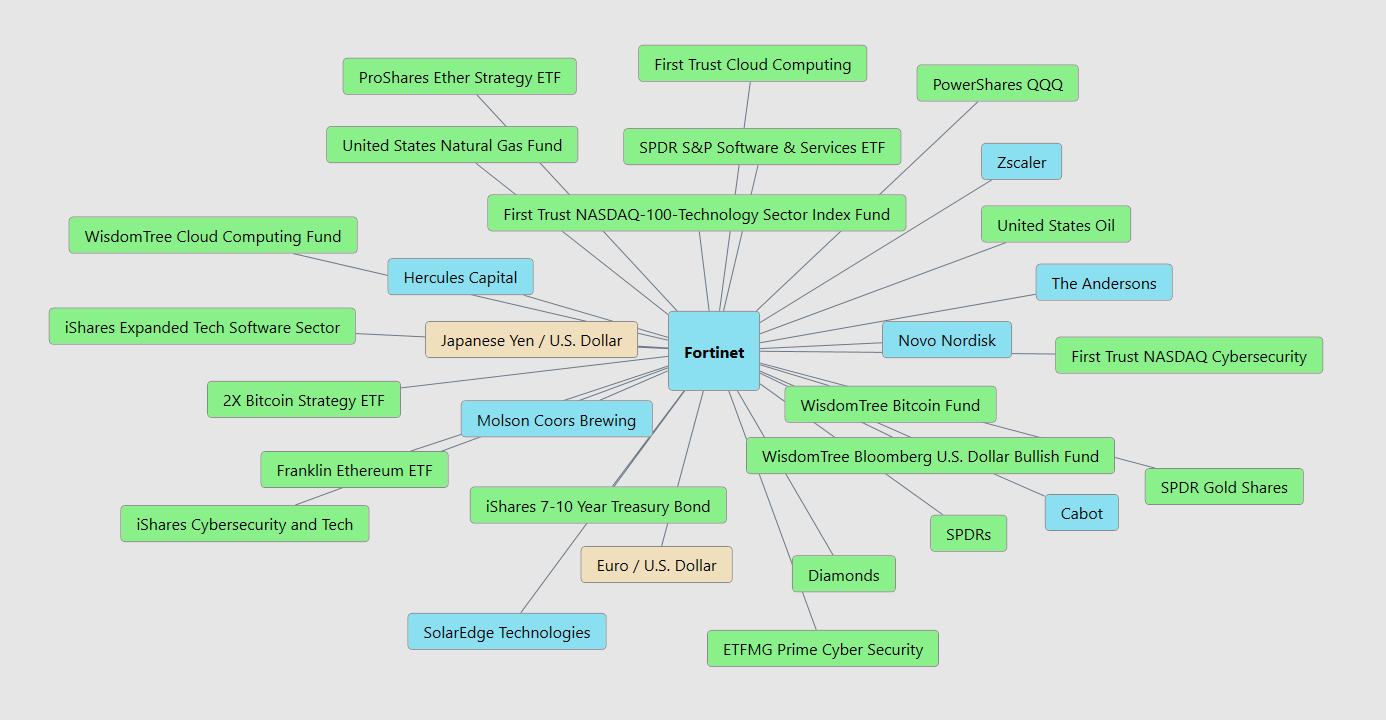
VantagePoint AI Intermarket Analysis
Most traders look at a stock chart and stop there. But markets do not move in isolation. Money flows between sectors, currencies, commodities, bonds, ETFs, and competing industries every single day. The intermarket map surrounding Fortinet tells a very important story right now. The stock is deeply connected to cloud computing, cybersecurity ETFs, software indexes, and major technology benchmarks like the QQQ and the NASDAQ-100 Technology Sector Index. That matters because when multiple technology-related markets are all moving in the same direction, trends tend to become stronger, more persistent, and harder to stop.
What stands out immediately is how heavily Fortinet is tied into cybersecurity and cloud infrastructure themes. Funds like the First Trust NASDAQ Cybersecurity ETF, iShares Cybersecurity and Tech, and ETFMG Prime Cyber Security ETF are all sitting directly in the web of influence. That means institutional money is not just betting on one company. It is flowing into the entire digital security ecosystem. Add in cloud-computing exposure, software ETFs, and major technology benchmarks, and you begin to understand why momentum in stocks like Fortinet can accelerate very quickly once the group catches institutional attention.
But the map also shows something deeper. There are connections to the U.S. Dollar, Treasury bonds, gold, oil, Bitcoin-related ETFs, and even currency markets like the Euro/U.S. Dollar and Japanese Yen/U.S. Dollar. That is the market quietly reminding traders that technology stocks do not trade inside a vacuum. Interest rates, currency strength, inflation expectations, and global liquidity all influence where capital flows next. The big lesson is simple: when multiple markets begin confirming the same narrative at the same time, that is when traders need to pay attention because intermarket agreement is often where the strongest trends are born.
Here are the 31 jey drivers of $FTNT price action.
Our Suggestion
Fortinet is no longer merely a cybersecurity company. It is becoming something far more important to Wall Street: a proving ground for how aggressively institutions are willing to pay for digital infrastructure in an increasingly AI-driven world.
The company’s next earnings report is expected in early August 2026, with Wall Street currently looking for quarterly earnings near $0.68 per share on revenue approaching $1.85 to $1.90 billion. After its most recent earnings release, management did something that sophisticated traders never ignore: they raised guidance. Full-year revenue expectations now sit near $7.7 to $7.9 billion, while earnings guidance moved above prior Wall Street estimates as well. That is the behavior of executives seeing demand remain stronger than many expected.
But perhaps the most revealing lesson from studying all of these charts together is that price itself is already telling the story long before analysts fully agree on it. The stock is simultaneously pressing into new 52-week highs and new 10-year highs, which remains one of the most powerful momentum signals in all of trading. Strong stocks do not wait for unanimous approval from Wall Street. They advance while analysts debate valuation, television commentators argue about macro risks, and skeptical investors convince themselves the move has gone “too far.” Meanwhile institutional money quietly continues accumulating shares because the market is discounting what comes next, not what already happened.
The intermarket relationships reinforce that same conclusion. Fortinet is deeply tied into cybersecurity ETFs, cloud-computing funds, software indexes, and large-cap technology benchmarks. That matters because when multiple related markets begin moving together, trends tend to strengthen instead of weaken.
Volatility is increasing because expectations are increasing.
And that may be the single most important takeaway from studying every one of these charts together. The market is not confused about Fortinet. It is intensely interested in Fortinet. The wide analyst forecast spread, the expanding daily range forecasts, the powerful breakout behavior, and the intermarket confirmation all point toward the same reality: this is a stock attracting enormous attention from institutional money at a very important technical moment. In a stock like Fortinet, understanding those boundaries can make the difference between reacting emotionally to volatility and positioning intelligently alongside the trend.
Our suggestion is simple. Respect the trend, but understand the volatility attached to it. Fortinet’s projected daily, weekly, and monthly trading ranges remind traders that opportunity and risk expand together.
Practice great money management on all of your trades. Position sizing is critical here.
Use the VantagePoint AI Daily Range Forecast to locate and isolate short term trading opportunities.
It’s not magic.
It’s machine learning.
Disclaimer: THERE IS A HIGH DEGREE OF RISK INVOLVED IN TRADING. IT IS NOT PRUDENT OR ADVISABLE TO MAKE TRADING DECISIONS THAT ARE BEYOND YOUR FINANCIAL MEANS OR INVOLVE TRADING CAPITAL THAT YOU ARE NOT WILLING AND CAPABLE OF LOSING.
VANTAGEPOINT’S MARKETING CAMPAIGNS, OF ANY KIND, DO NOT CONSTITUTE TRADING ADVICE OR AN ENDORSEMENT OR RECOMMENDATION BY VANTAGEPOINT AI OR ANY ASSOCIATED AFFILIATES OF ANY TRADING METHODS, PROGRAMS, SYSTEMS OR ROUTINES. VANTAGEPOINT’S PERSONNEL ARE NOT LICENSED BROKERS OR ADVISORS AND DO NOT OFFER TRADING ADVICE.