Register for a Free Live Training
The Hot Stocks Outlook uses VantagePoint’s market forecasts that are up to 87.4% accurate, demonstrating how traders can improve their timing and direction. In this week’s video, VantagePoint Software reviews forecasts for PowerShares $QQQ ($QQQ), Cousins Properties ($CUZ), Vornado Realty Trust ($VNO), Micron Technology ($MU). Alphabet ($GOOGL), Gorilla Technology Group ($GRRR), XPO Logistics ($XPO)
VantagePoint AI Hot Stocks Outlook for May 8, 2026
Hello again, traders, and welcome back to the Hot Stocks Outlook for May 8th, 2026. I hope you all have had a very nice week in the financial markets and, as always, we’re here to highlight the most recent VantagePoint AI predictive forecast.
So, if you haven’t already, be sure to go ahead and click the link down in the description below and you can get signed up for a live demonstration where you can learn all the specifics about how these predictive indicators and really artificial intelligence technologies that underpin VantagePoint’s predictive indicators can help you make much better trading decisions when out in the marketplace.
And so we have a really great example here actually of how all of these predictive tools work together here in Cousin Properties. Aside from the tech space, which we’ve really been highlighting since the beginning of April, this has been a really nice rally and trend so far.
But this has been another area where we’ve actually seen some strength in the market around some of these property management companies. So what we have here, of course, is daily bars and candles, right? So each one of these candles that you’re seeing there, well, that would represent a full and complete trading day.
And it’s right up against all of that daily price action that you’re going to notice that there is a black line but also a blue line value. And so what the black line is there is actually a simple moving average. So this is a very common technical analysis indicator.
And in this case, it’s a 10 period. So it just looks at the previous 10 close prices, adds them all together, and then divides by that number. And this is a very rudimentary approach to technical analysis.
So this is where all of the data to generate that black line value simply just comes from the past. It has no predictive capability. It really just summarizes what has already occurred.
And so this is what VantagePoint traders use as a baseline, but we’re able to compare that to the VantagePoint proprietary predicted moving average. And so for this number, which we can think of as essentially a price for that to get calculated and plotted and placed on the chart every evening for the trader, well, this is where the technology steps in.
And rather than looking at those past prices, what VantagePoint’s artificial neural networks are able to do is look at dozens of other markets that are known to drive and influence the future price of Cousin Properties.
Now, this can be things like the broader indices. We’ve seen huge moves out of the SPY and the Q’s. This can be things like other individual stocks in the marketplace. This can be ETF groups that potentially focus on this area of the market.
But VantagePoint has a global approach. So it’s even going to look at things like the value of the dollar index, the value of the bond market and interest rates, and additionally the value of commodities, especially those large macro driver commodities in the economy like oil and gold.
And so this is where VantagePoint takes in all of this data and incorporates that information, those predictive information via those neural networks into the forecast.
And so whenever we see this blue line, in this case you see crossing below the black line, well that’s going to suggest average prices are on the way down.
And so what’s really interesting about VantagePoint software is that we see a lot of the correlations in the market and see a lot of strength coming in at the same time.
So in the same way that we saw SPY and the Q’s turn up at the beginning of April, well sure enough particular stocks, the stronger stocks, we see getting that blue line moving above the black line and reversing trend.
But this is where this is really helpful. It’s not just that blue line over the black line. We also have this predicted neural index at the bottom of the chart.
You see this bar that goes from green to red back to green. Well, this is getting updated every single trading day. So the most recent trading day that we have here, but what it’s doing is predicting short-term strength or weakness over the next 48 hours.
And so what we have here is the overall trend direction provided by these predictive moving averages to get us ahead of that prevailing trend, and then a very short-term forecasting tool over the next couple of trading days.
And this can warn traders early of reversals in the market, but also potentially some short-term weakness within the uptrend.
And so if we take a close look at this, you see the neural index. It gets bullish here, here, and here. And well, what’s happening in the market? Well, the market’s moving sideways, but the trend is still predicted to be on the bearish side of things.
And so we see that yes, the market runs sideways, but as this neural index flips to bearish, that trend picks up and we see that acceleration to the downside until, of course, we see the neural index flip up to green and, sure enough, we start to see strength come into the market really coming out of March and into April.
And then we get that confirmation from the predictive indicators with VantagePoint as that blue line crosses above the black line.
And this is where a lot of stocks are really seeing the same thing via VantagePoint’s Intelliscans. This is where we really honed in on this in a lot of the tech names, a lot of the semiconductor stocks, and just the broader indices are a big clue that, hey, we want to look for these opportunities where the market can start to move higher.
Here in Cousin Properties, what’s great about this is then you have a roadmap moving forward. So, as the neural index gets bearish, well, you see the market again running sideways over the next couple of days.
But as that neural index gets bullish, you see that momentum coming into the market and clearly a lot of separation between that blue line and black line value indicating strength.
But that’s not all. We also have a VantagePoint predicted high and a predicted low. And now this really gets down to intraday price levels for traders.
And you really see how this works. As the trend is up, it’s going to point out these predictive lows and let you know, hey, this is where you want to look to be a buyer over these 48-hour periods or these end-of-day, next-day periods going into the market.
And this is really how this works for VantagePoint traders. You see this actually being the beginning of the week here, Monday and Tuesday, scooting down towards those predicted lows and then continuing on this uptrend.
So really nice move for the week here. But we can see that this goes all the way back to the beginning of the month here, right? The beginning of April, the beginning of last month.
We see shares up about 18%. And a lot of companies like this will pay nice dividends. This may be a very nice entry price for a potentially longer-term move and swing in the market.
So really nice move there over the past 25 trading days.
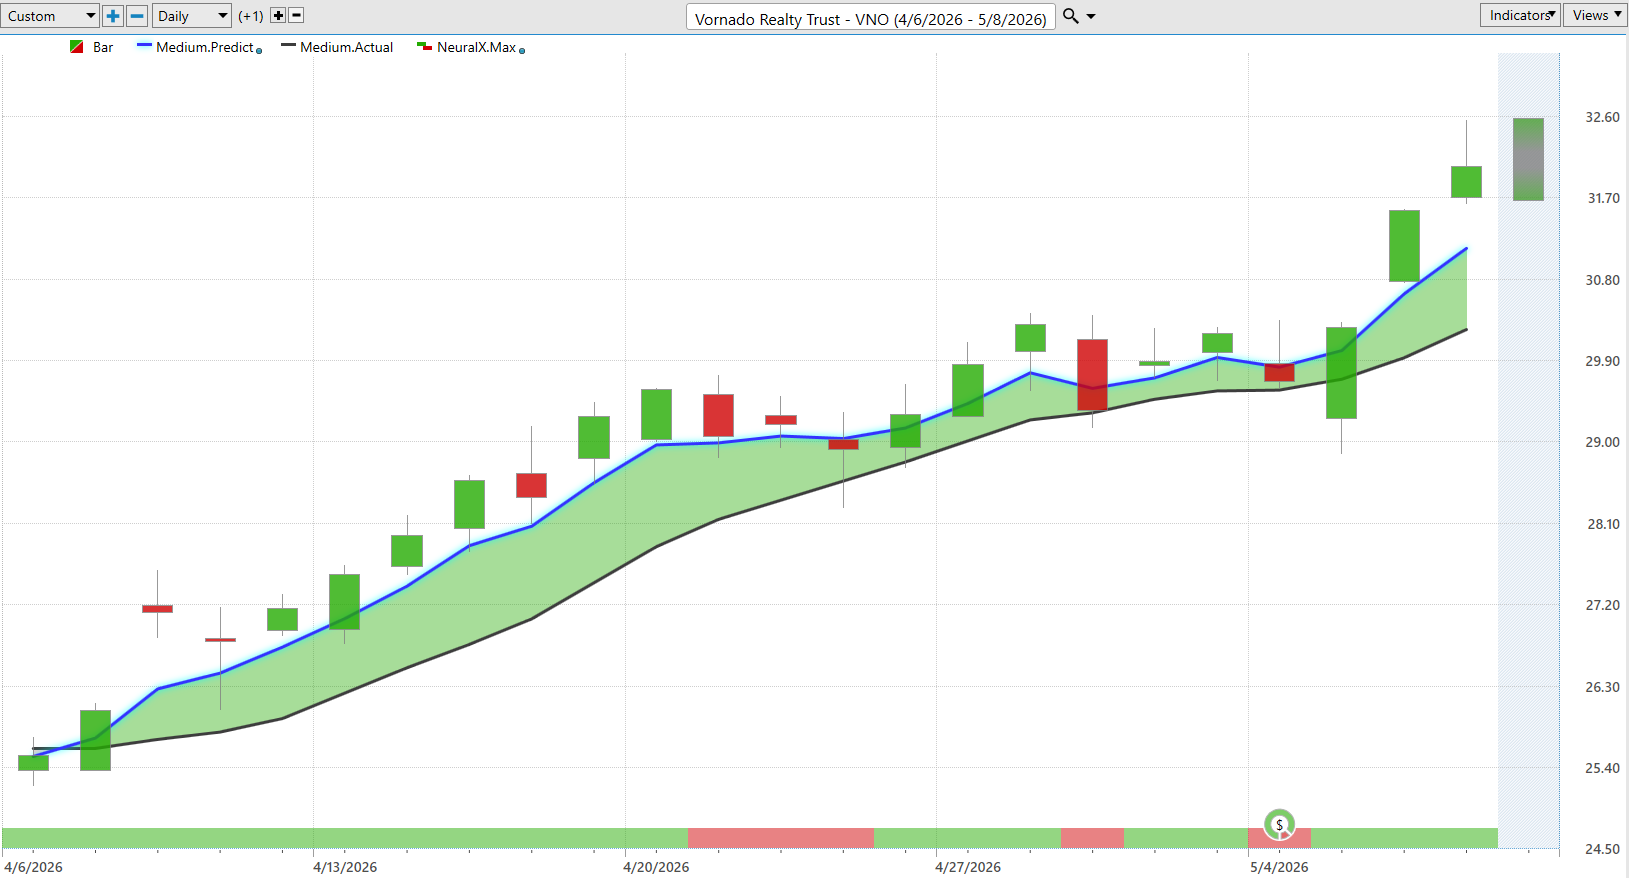
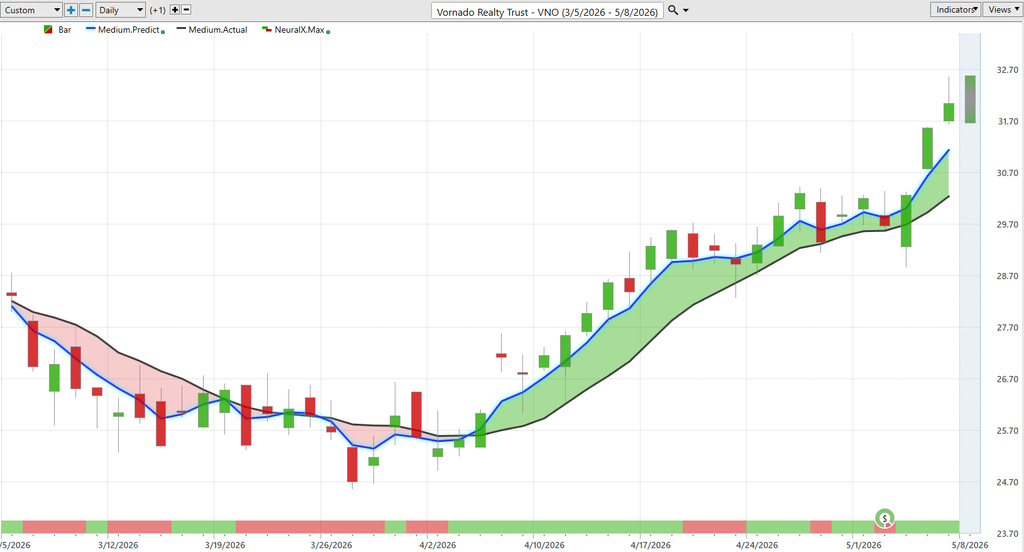
Really quickly here again, here’s Vornado Realty Trust. So again seeing these predictive moving averages start to pivot to the bullish side really across the board across this sector in a market where those S&Ps and Q’s are starting to move to the bullish side as well.
When we back out of this we can see that neural index gets bearish and sure enough what happens, we had been in a very strong momentum period, but then things always need to cool off for a little bit.
You don’t want to get too exciting expecting the market to continue higher the very next day. But this is where VantagePoint, of course, gives us this roadmap from these predicted highs and lows.
And we always want to pay attention to days like this where you come out of the range. Oftentimes you’ll scoot back towards that predicted low. Things moving around a little bit here.
But even still, those predicted lows are going to do a great job of just moving forward, navigating the price action.
You see we scoot a little bit lower here but closing inside the range. Here going into earnings we start to scoot a little bit lower.
But the software does this really great job of just adjusting, always taking in new information, providing those predictive indicators.
And really it’s the suite, the combination of these tools that really round out this forecast.
So we see as we come through earnings again what’s actually interesting about this, we see this a lot through weekends here. Here’s this predicted low from the end of the previous week.
And so with sort of that weekend liquidity going into the next week and earnings, look at that level coming right back into that predicted level and then earnings really acting as a catalyst, moving the stock much higher here.
So again these stocks don’t move a tremendous amount because they pay those larger dividends here, but this is still a 23% move.
Of course we’ve been in a market where the broader Q’s and some of these tech stocks have been rallying very aggressively.
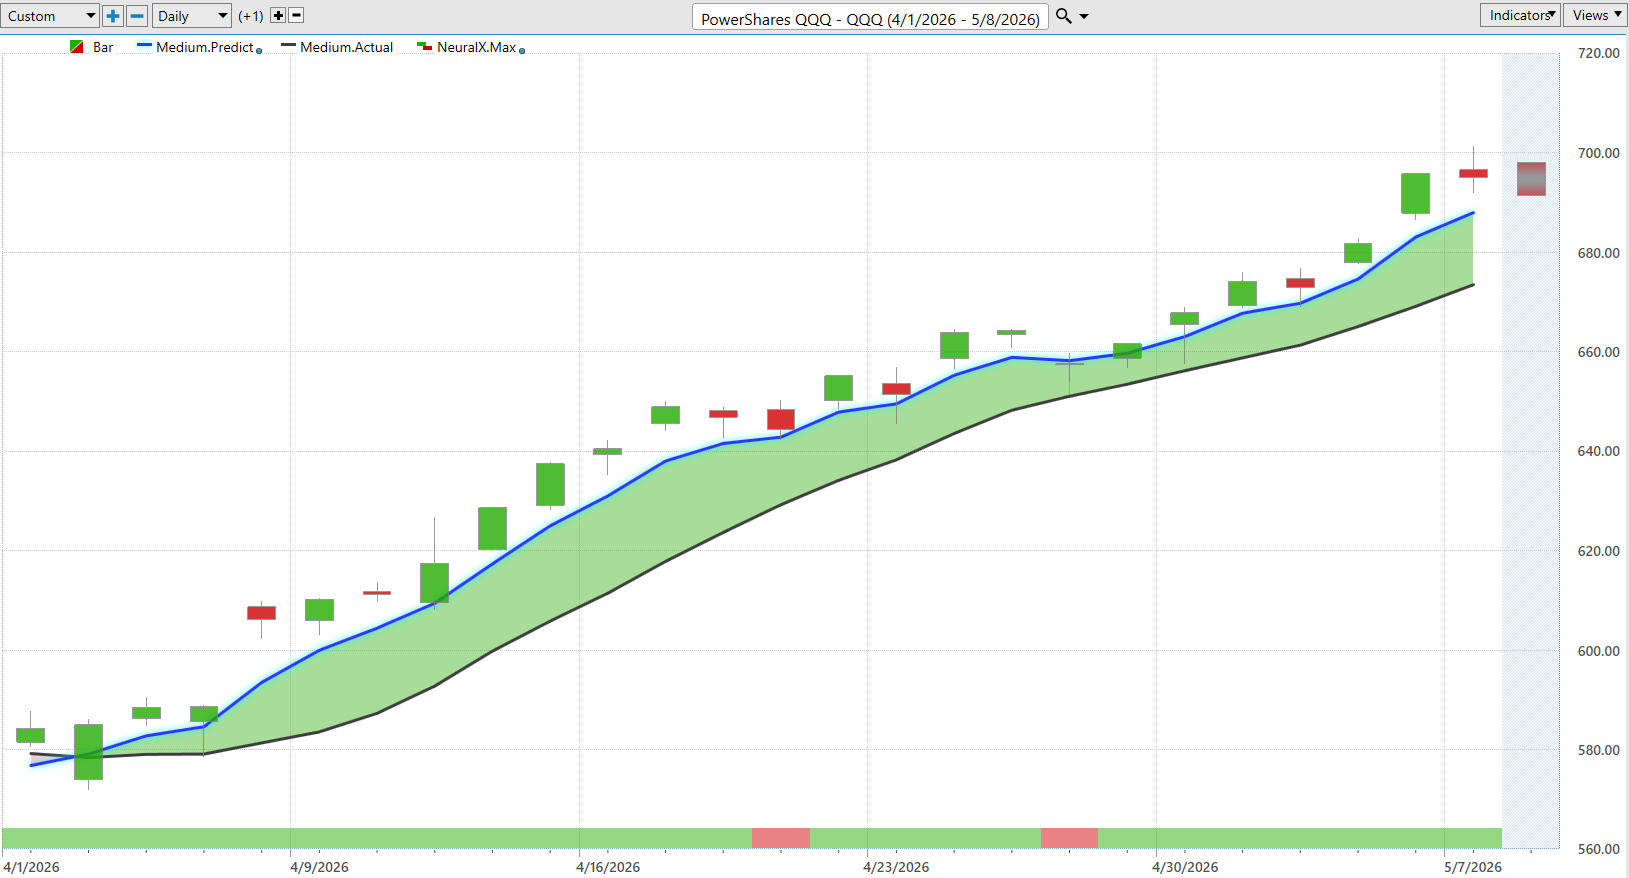
So here again we have the Q’s and we can be really quick on this one updating the chart. And well what do we see if you have these forecasts going into the week?
You see we scoot right down to that predicted low on Monday. The market barely pushes against it. You see the neural index bullish throughout this entire week.
So only really one way to look at this is the markets are still in a strong uptrend, getting definitely over 4% on Friday as we see shares going higher once again.
And this is taking place pretty aggressively in tech stocks.
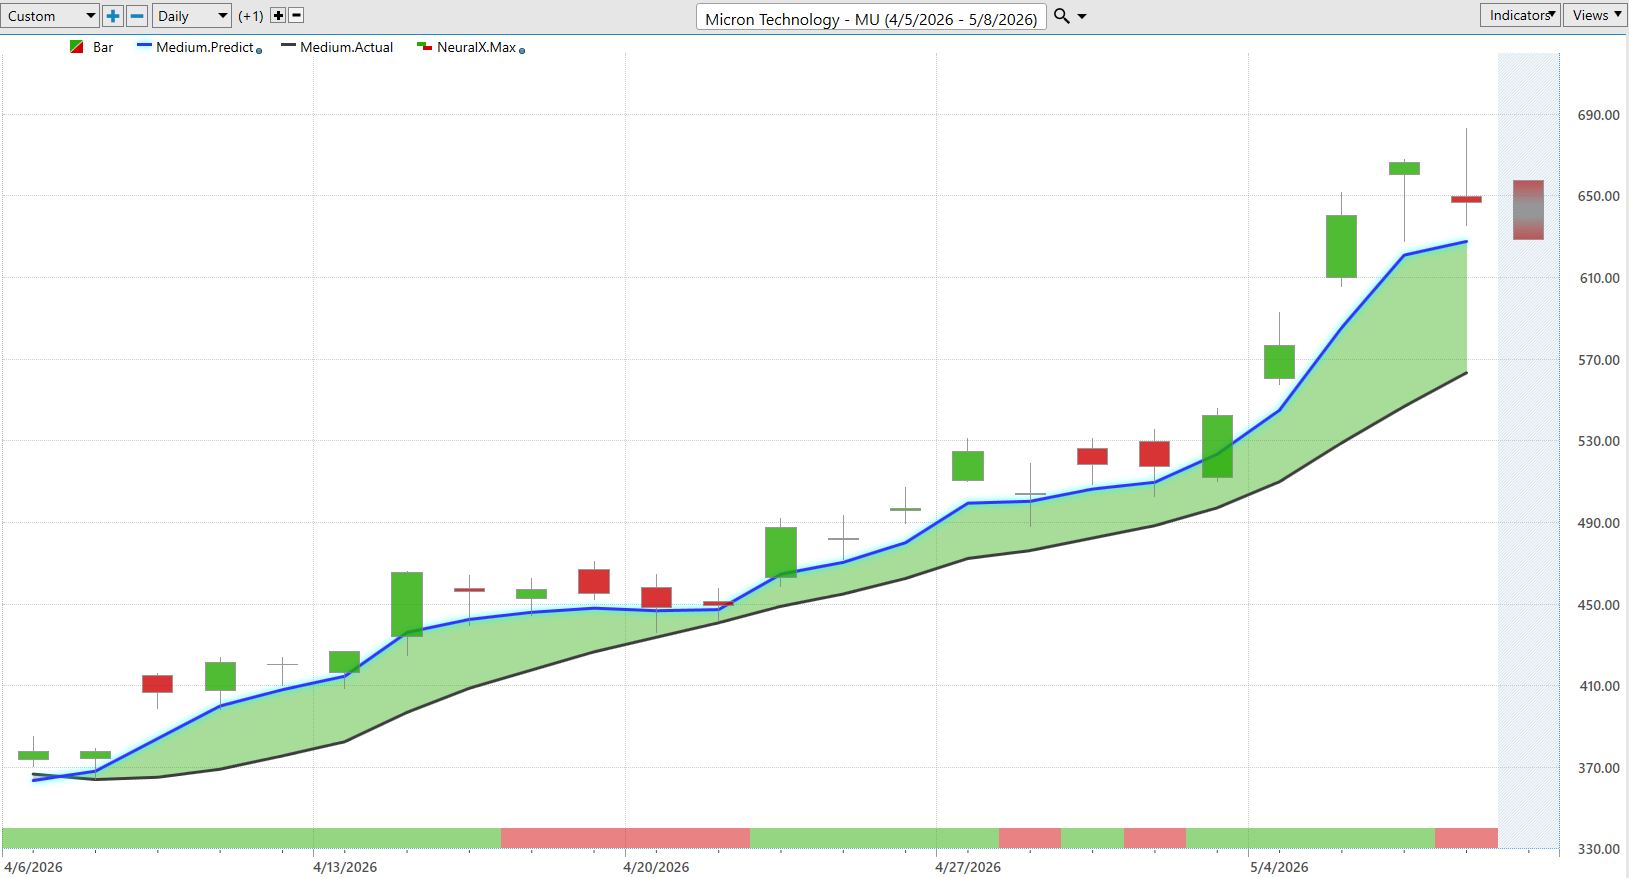
So here we see Micron blue line over black line. You see your neural index goes bearish warning of some of these sideways and retracement periods in the market.
But you have a really fine-tuned tool here that says look towards these predicted lows if you want to scoop up some shares.
The shorter-term traders can target those predicted highs and look to buy back in at lower price levels.
But again here you see really a tremendous week here across tech. Thursday here moving down to the predicted low and getting pretty far away from where these markets shifted.
And that means you’re likely going to see a lot more volatility as far as the daily ranges getting wider here.
When you have a nice entry, well, that helps you hold on to the market, trail stops, and stay involved in that longer-term move.
You see up 72% in the past 23 trading days.
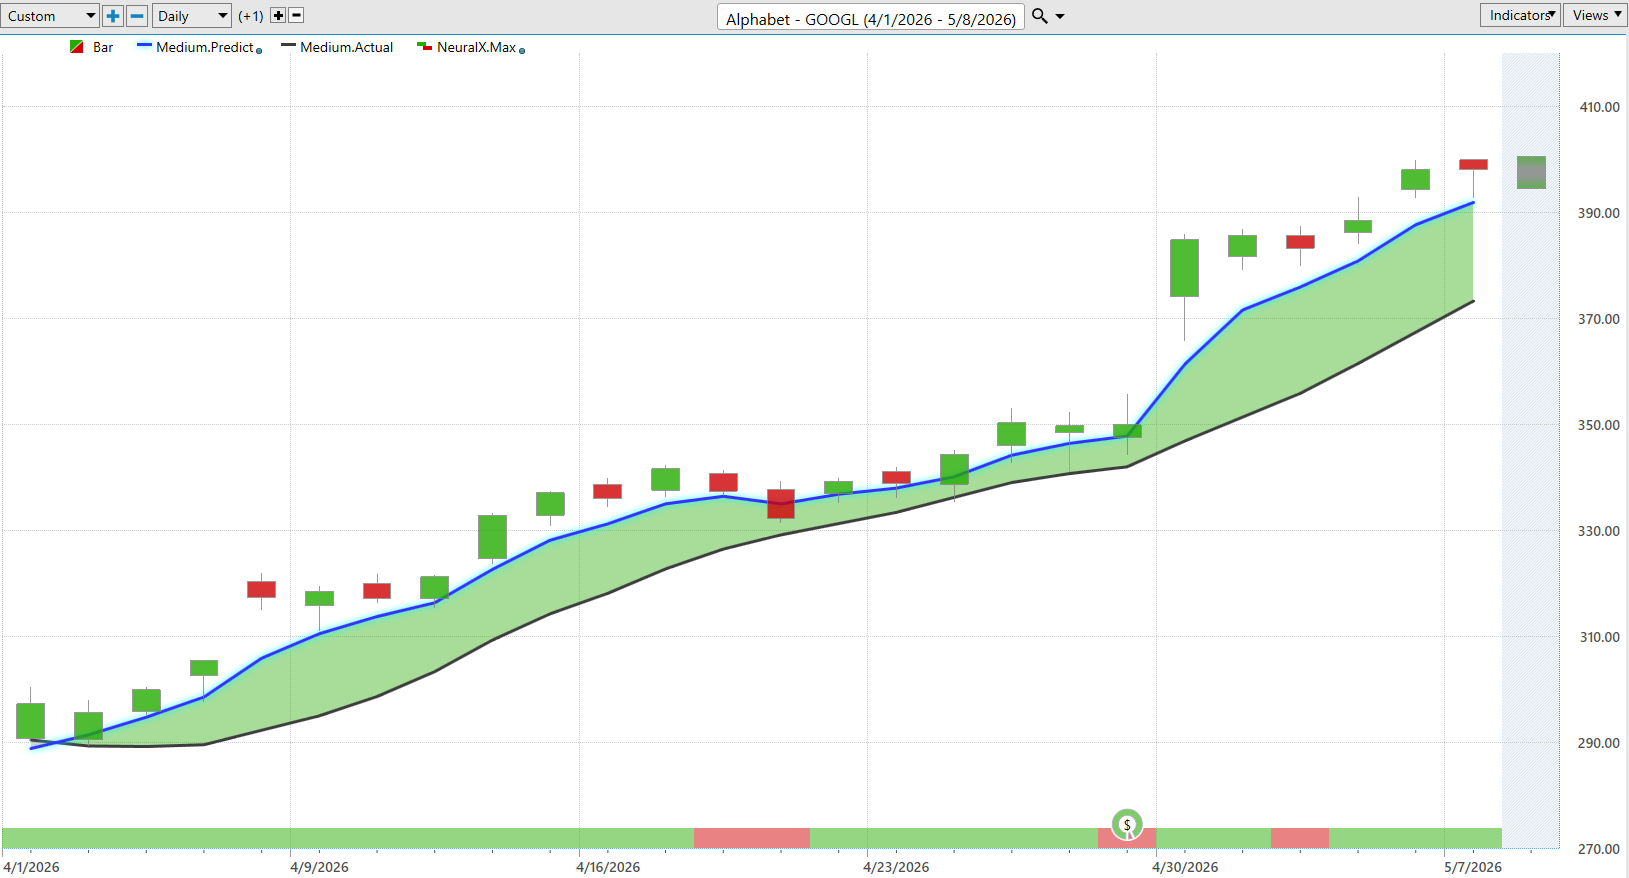
Here’s Google. Same thing as we see those indices start to turn higher. Really nice place to be as we see a lot of strength in this trend.
Little sideways price action here. Earnings just sort of volatility randomness around those earnings reports and you see really aggressively continuing that trending move.
But this was very early on. We see these early predicted lows being hit going into today. We’re up about 35%.
But numerous opportunities here as the markets for a little period here running sideways.
You see how VantagePoint does a good job of pinpointing that lower part of the range.
And again here as the Q’s scoot down to the predicted low, Google as well, after you get through earnings, might not be a bad place to scoop up shares and really take advantage of this strength we’ve seen over the past week from these short-term predictive indicators being very bullish here.
Gorilla Technology Group ($GRRR)
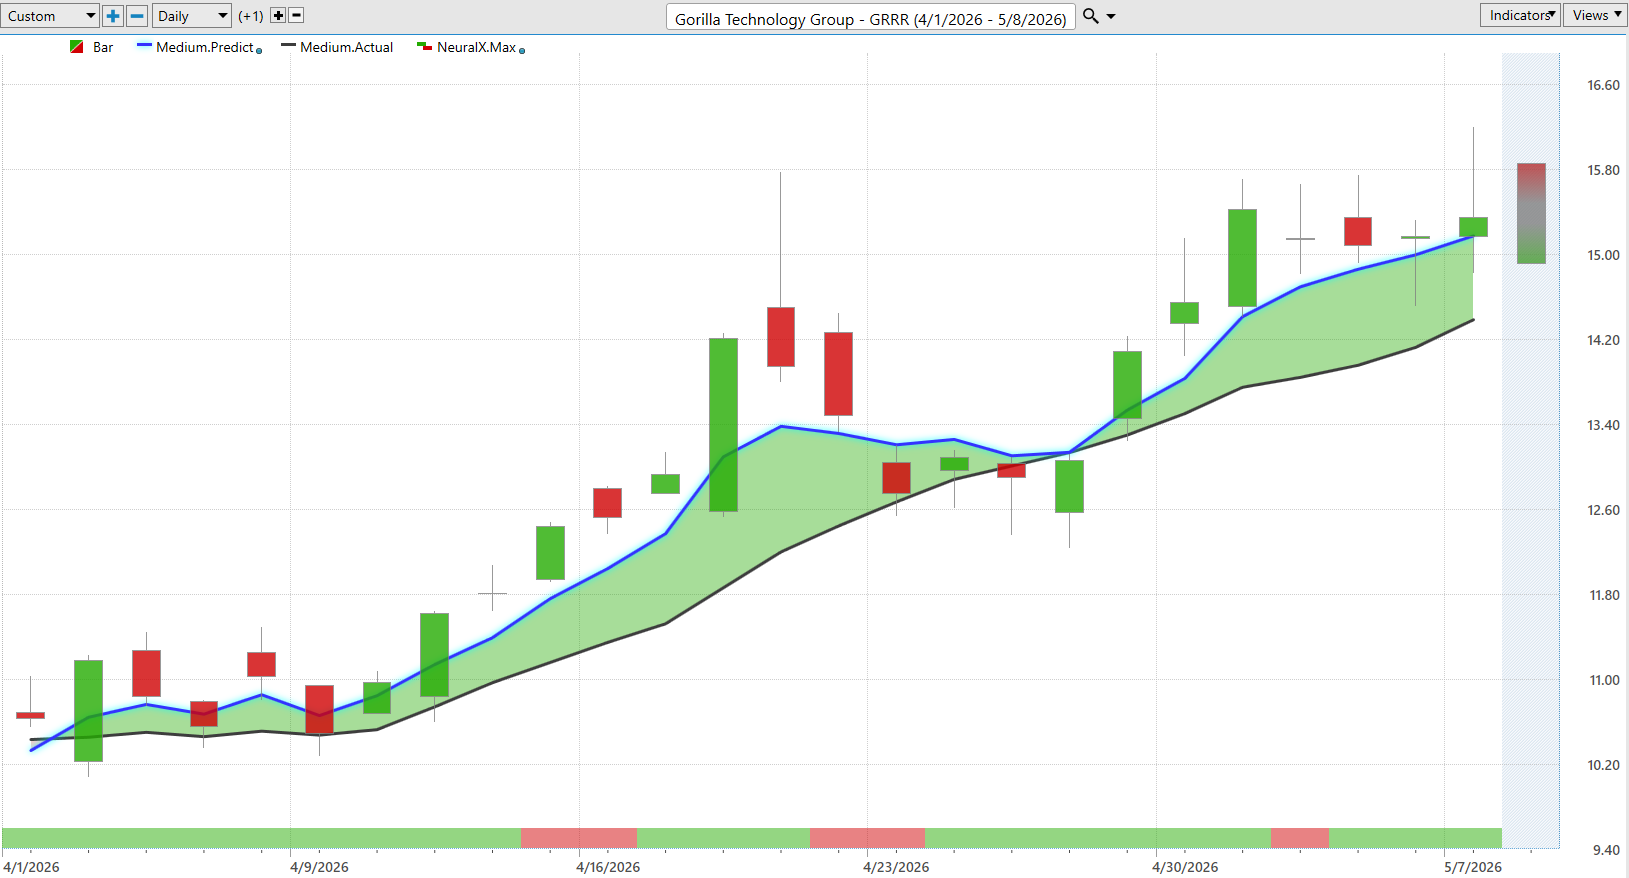
Here’s Gorilla Technology Group. So this has been another strong mover, a little more cheaply priced stock.
But look at these predicted lows just really being hit day after day after day.
And then we go into this retracement period and you see the same thing pointing out these levels where you can get a better entry price.
And then this whole week let you know look down towards these predicted lows.
If you’re a shorter-term trader, scoop some up down at the predicted lows, target the predicted highs.
It’s about an almost 6% move just this week here.
And of course tech still in that pretty strong uptrend.
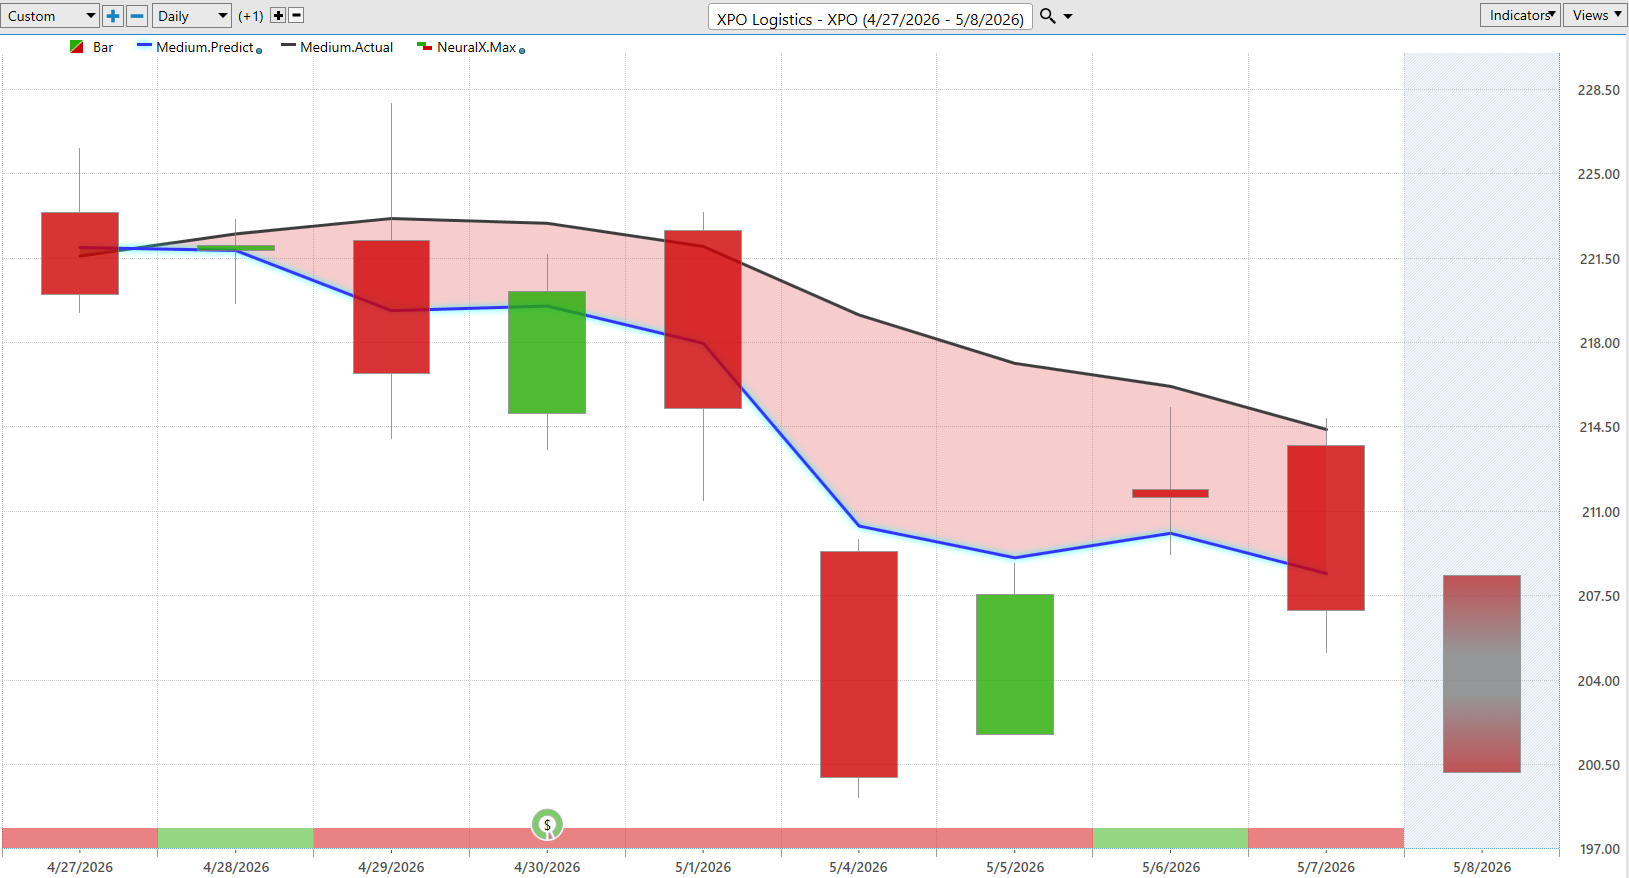
And lastly here we have XPO Logistics. And so I just wanted to bring in a name that looks a little bit weaker here.
We see that blue line crossing below the black line. Now notice the neural index bullish here. And sure enough, you’re getting this sort of sideways price action, higher high the next trading day.
But very clearly this flips to red. A lot of separation between that blue and the black line.
And then we have earnings right here in the middle of this.
But the overall direction here looks pretty bearish.
And these intraday predicted highs and lows that you get are really just pinpointing, hey, look up towards these predicted highs, short, only take profits on shorts.
And potentially not a bad place to sort of balance out the portfolio.
And we do have a very mixed market, right? There’s these tech stocks that are aggressively moving higher with the broader indices.
But some of these markets that may be a little bit more sensitive to some of the geopolitical risk, sensitive to higher oil prices.
That of course gets factored into these predictive forecasts and helps really fine-tune again these predictive indicators whether that be the predicted moving average, neural index, or those predictive highs and lows.
So we’ll go ahead and leave it there for today.
But once again, this has been our Hot Stocks Outlook for May 8th, 2026. Thank you all for watching. Best of luck out there and bye for now.