Welcome to the Artificial Intelligence Outlook for Forex trading.
VIDEO TRANSCRIPT
US DOLLAR
Okay, hello everyone, and welcome back. My name is Greg Firman, and this is the Vantage Point AI market outlook for the week of May the 11th, 2026.
Now, to get started this week, we’re going to do things a little bit differently here this week by breaking this down in the most simplistic form using the VP core indicators along with pricebased tools and, of course, that very important neural index.
So, let’s get started.
What we’re going to do is split the screen and look at the ma understand what is mainly driving the trades that you’re taking, which is the US Dollar in one way or the other.
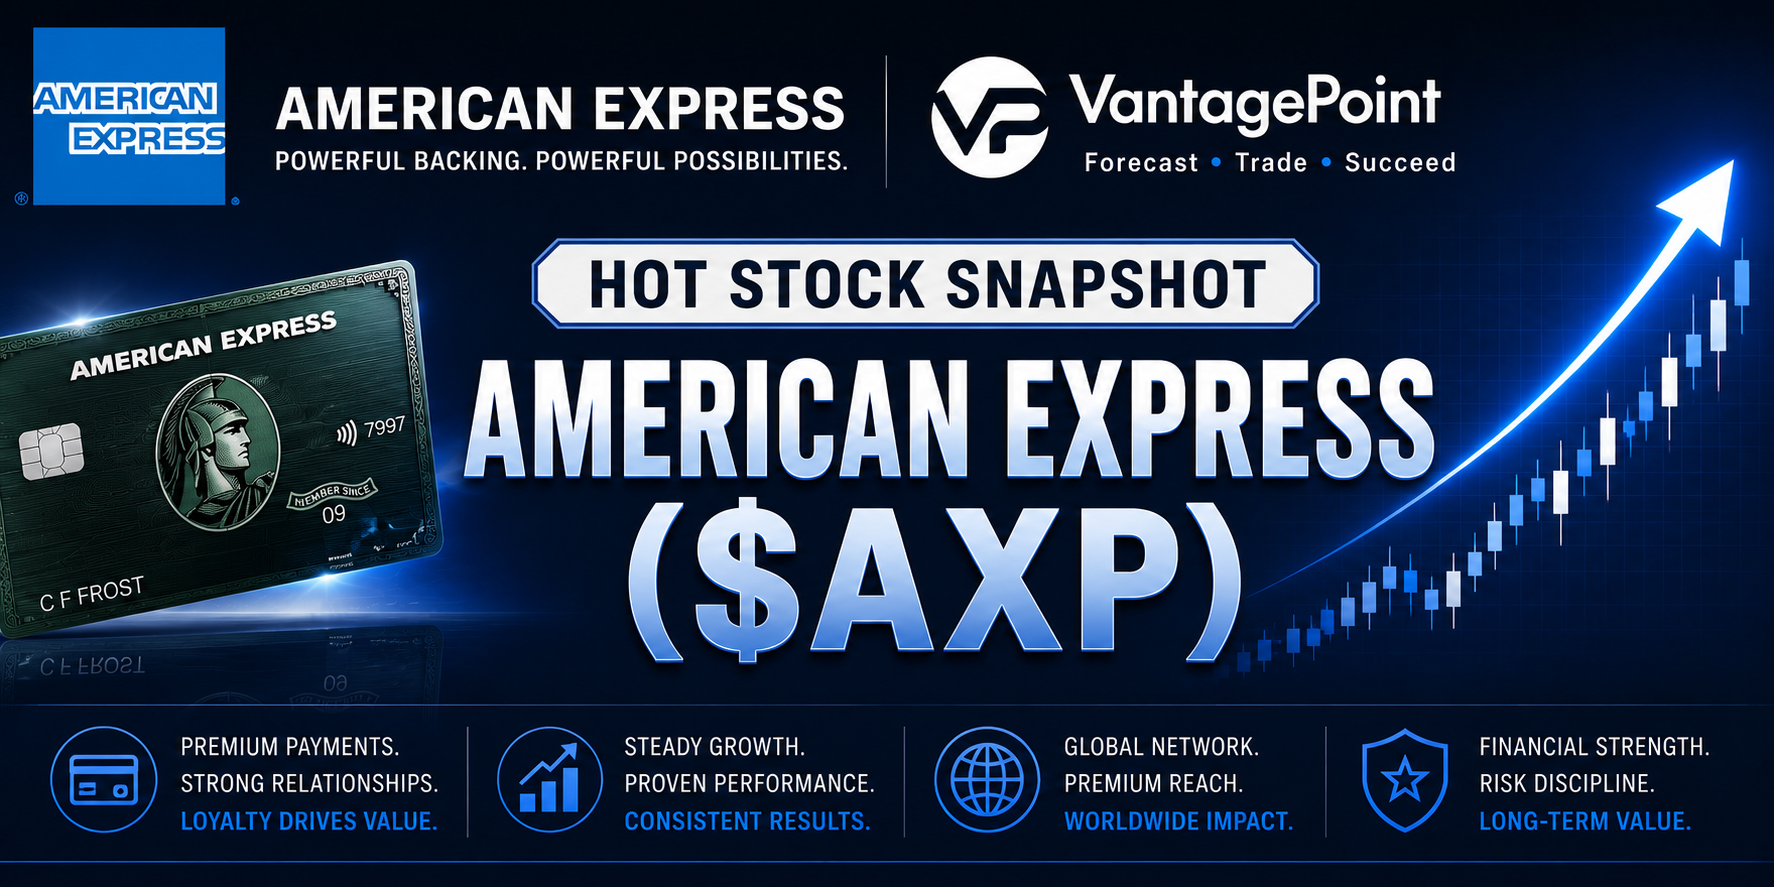
So right now, looking at the cash price of the Dollar Index, we can see that we’re below our t cross long. That level is coming in at 98.41, and we are also below the calendar yearly opening price 9823.
Now, we’re coming off that payroll number on Friday, but again, very debatable whether that number was good or not. Uh, in my view, it was mediocre or weak, uh, with the U6 number rising yet again. Uh, again, a number of different factors in that report that were not the best.
Wisdom Tree USDU / UUP / UDN
But either way, when we look at this and do a comparative analysis on the ETF side, the Wisdom Tree USDU, now this takes into account the emerging markets. That’s something we want to make sure we’re looking at.
Now, again, showing a different picture. We’re above the yearly opening price at 2576. The primary trend still technically is to the upside, but we’re below that very important tross long.
So for new viewers, what I’m using here on the indicator side is the triple EMA cross, but the single predicted moving average, the most important one, the T cross long.
Very simplistic theory here, guys. If we’re above it, we’re long. If we’re below it, we’re short. Or, in essence, if we’re below it, it’s bearish. If it’s above it, it’s bullish.
So as you can see, the one thing that both of these have in common is they are both below the VantagePoint tcross long.
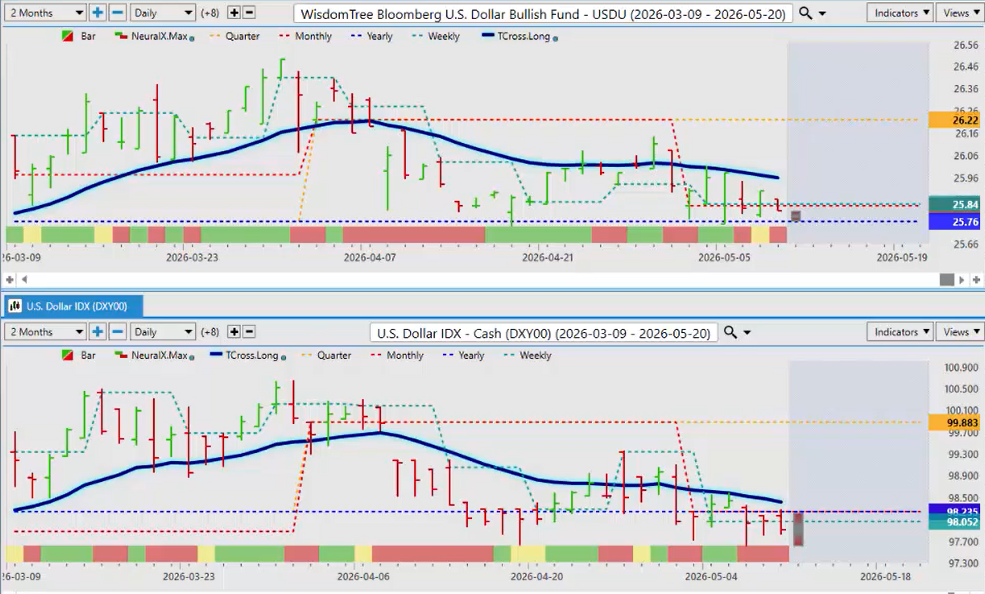
Now, that is the wisdom tree is a very important ETF, as is the power shares UUP, excuse me.
Now, again, still above its yearly opening price. So when we look at the cash price or the current price versus the ETF, the ETF is showing a slightly different picture.
Now, it could be lagging behind the market a bit, but I don’t think so. I think it’s just a matter of time before the dollar breaks down even lower, but the cash price is the leading one.
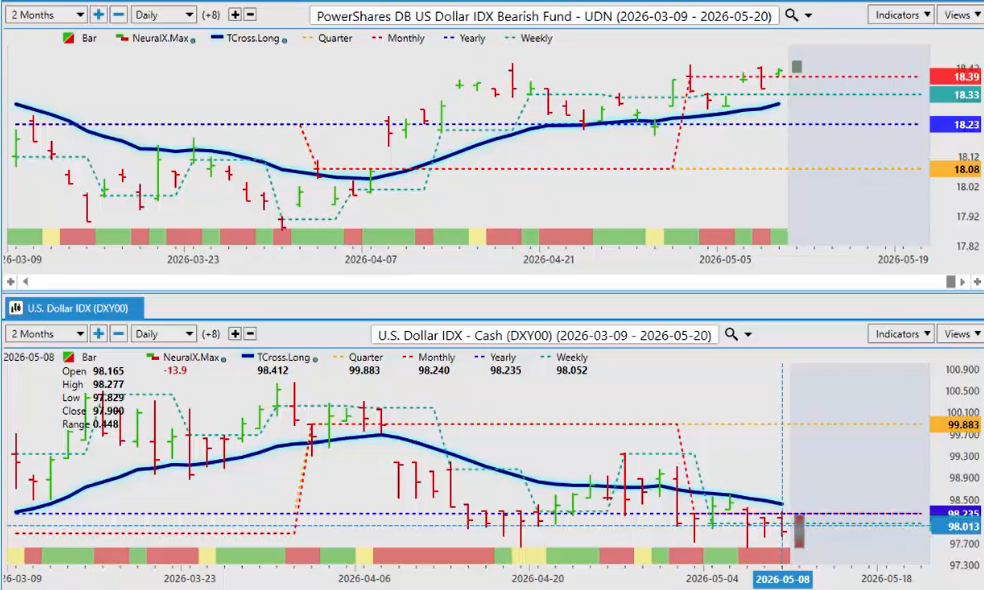
Now, the reason I would say this, if we look at the opposite of the UUP and look at the UDN, the UDN is firmly above its TCROSS long. That level is coming in at 1830, and 1823 is again the calendar yearly opening price that determines whether something is bullish or bearish.
So the UDN is basically an ETF that’s taking bets that the dollar is going lower. And as you can see, structurally this one is a very clear picture, and it matches the cash price of the dollar index.
Gold
Now from here, we start working in additional markets to understand what will happen if that dollar moves lower.
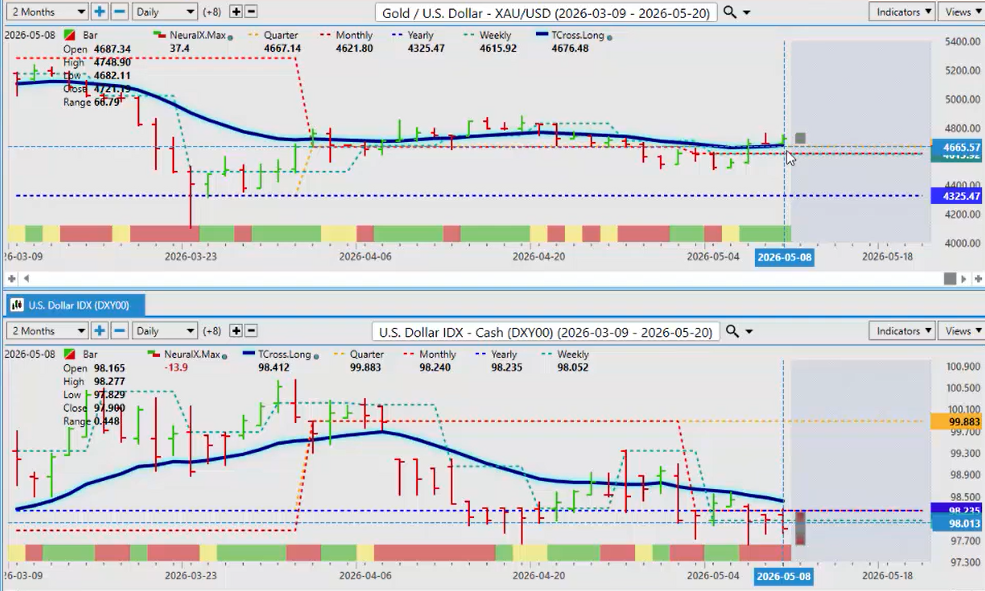
Now Gold, structurally speaking, this is again a very simplistic chart. The main core predicted moving average by itself. There’s no crossover here. There is uh no lag. There is no confusion of any kind.
We are above the yearly opening price at Gold 4325. We are above the quarterly and monthly opening price 4667 4621.
This looks like we’re getting ready to start another bull move in Gold. Now may take a few days to develop, but either way, there’s a warning sign that Gold is going higher and the dollar is getting ready to move lower.
But structurally speaking, you can see that we retested the calendar yearly opening price back in March, and we were ra continuing to rally off that particular area.
Bitcoin
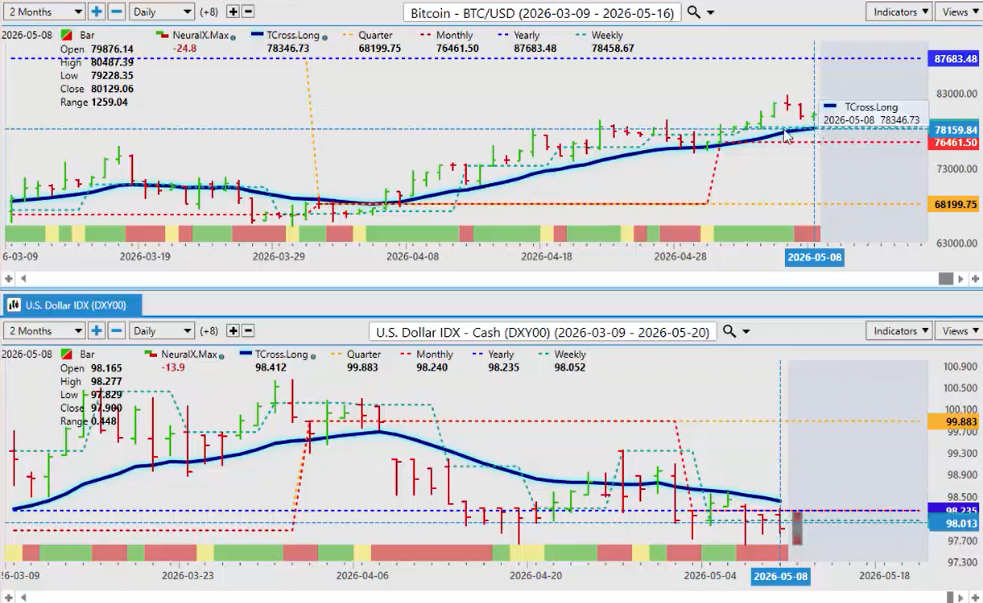
Now, Bitcoin again using the key or core predicted moving average, the tcross long 78,34673. We need to hold above this level if Bitcoin can advance higher.
In my respectful opinion only, I think it will be very difficult for Bitcoin to advance from here. In most cases, it will be mid-September into the end of October that we’ll see the next big rally and then, of course, next year.
I anticipate a good year for Bitcoin, but we’ll take this one week and one month at a time.
So right now, that TCross long is very important. We can also see that I’ve got the neural index embedded into here. We’ve had a a bullish move green neural index as we crossed over and closed above the T cross long.
But you can we can assess from here that that neural index is starting to warn us that it’s it potentially could turn bearish here.
So again, watch your TCross long, that core level that has zero lag. It’s a pivot level like a major support level, right?
So again, if we can hold above that, it can advance. But if it can’t, we’re going lower.
Equity Markets / S&P 500 / SPY / QQQ
Now, on the equity side, going into next week, take conceptually taking the same thing. If we look at Bitcoin, what was the main trigger for sending Bitcoin higher?
Well, I could say that it was because of Bitcoin purchases, more ETFs coming in. I heard hedge funds are buying it. Maybe that’s true, maybe it’s not.
But what I do know that’s factual based on inner market technical analysis is that when the dollar slipped and moved below the VP predicted moving average, Bitcoin immediately started moving higher.
I can assess that the equity markets very very similar here. You can pick on pick any one of the equity markets and you’ll see the same thing.
And for this weekly presentation, I can bring all of those in and get and we can look at all of this together very quickly and very accurately.
Okay. What was the main driver of the equity markets moving higher?
I would argue that the dollar moving lower put life back into the equity markets, back into Bitcoin.
So once again, when I’m looking at this, I would argue that the main driver is the dollar moving lower.
So if the dollar continues to move lower, the equities would move higher.
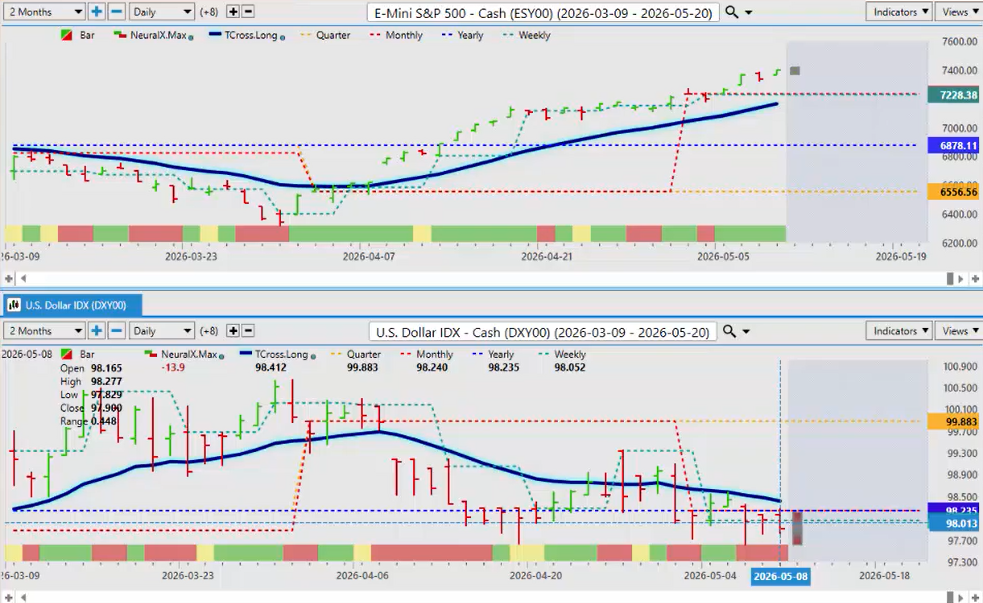
My concern here is the further we move away from this core VP predicted moving average, the tcross long, which is at 716543, the more likely it is we’re going to retrace to that.
But structurally speaking, the quarterly opening, the yearly opening price, the monthly opening price, this is bullish right across the board here, guys.
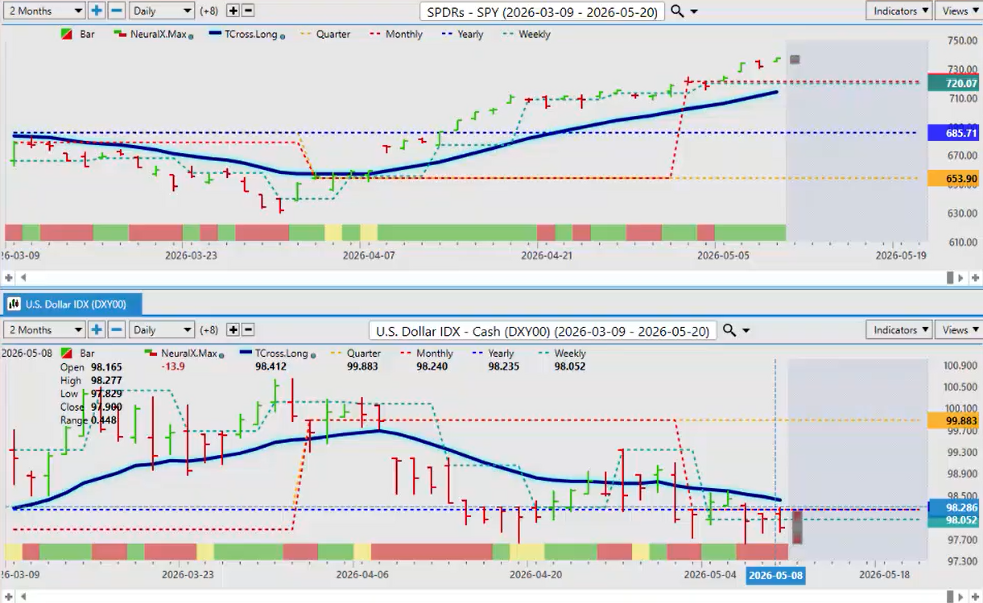
And if we look at the the S&P 500 cash or we look at the SPY, the ETF is a very effective way to trade this. One could argue it’s a better way to trade it, but either way, you can see that the SPY advanced.
When we look at the Q’s, the same thing.
The Q right here closed just a hair above that predicted moving average. And as the dollar tanked, that sent the Q’s back up, Bitcoin back up, the spy’s back up.
So we need to understand this going forward.
Now once again, the T cross long 66522. Now the more likely than not we’re going to have some type of retracement to begin the week. That would be considered we would use that as a buying opportunity.
The neural index is solid green right across the board. The dollar cash price is red, meaning down.
So once again, the cues are looking pretty decent here.
Global X DAX Futures / VIX
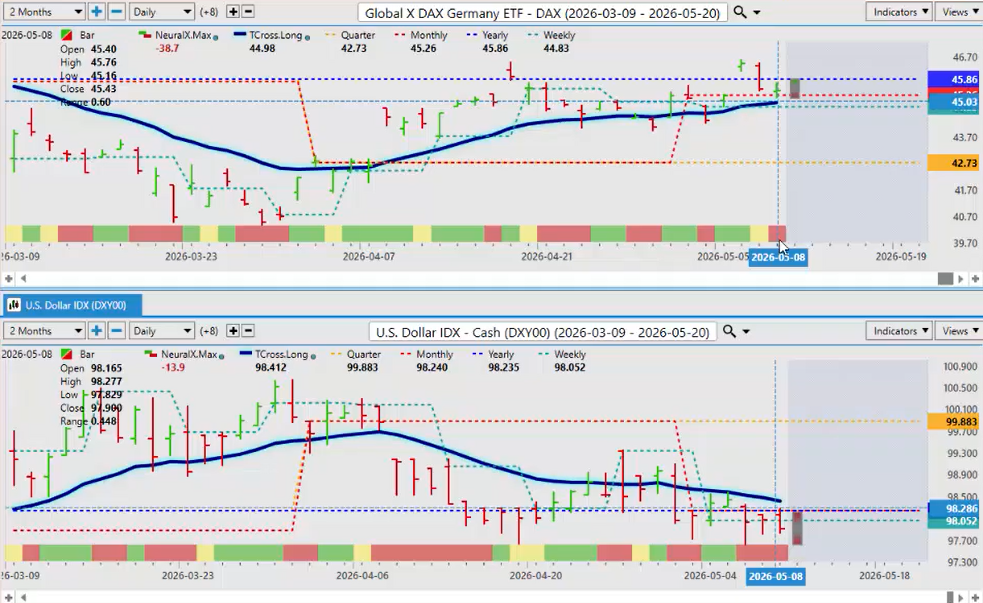
If we look at the global the global x DAX Futures, I talked about this last week. If the euro advances it will and the dollar moves lower the DAX will benefit from this.
The same thing can be said for next week.
So once again, the yearly opening price is the only thing that is stopping the DAX from breaking higher. But the tross long at 44.98, [clears throat] that is your buy zone right there.
Now, our neural index to start the week is a little bit red, saying there’s going to be some volatility. Perfectly normal.
If the DAX and the euro crash on Monday, you pick it up long on Tuesday. That’s the way it works. The Monday, Tuesday reversal that I’ve talked about on here very, very often.
But once again, we want to identify is 50 different indicators deciding the direction of these markets, or is the dollar playing the single biggest part in that?
And most people would just say, well, the inner market correlation is dollar down, gold up.
Well, that’s not what these VP charts are telling us, is it?
So again, understanding the importance of a currency in anything else you’re trading is critical.
And to close this particular section off, we want to make sure we’re looking at that VIX. The VIX is positively correlated to the dollar.
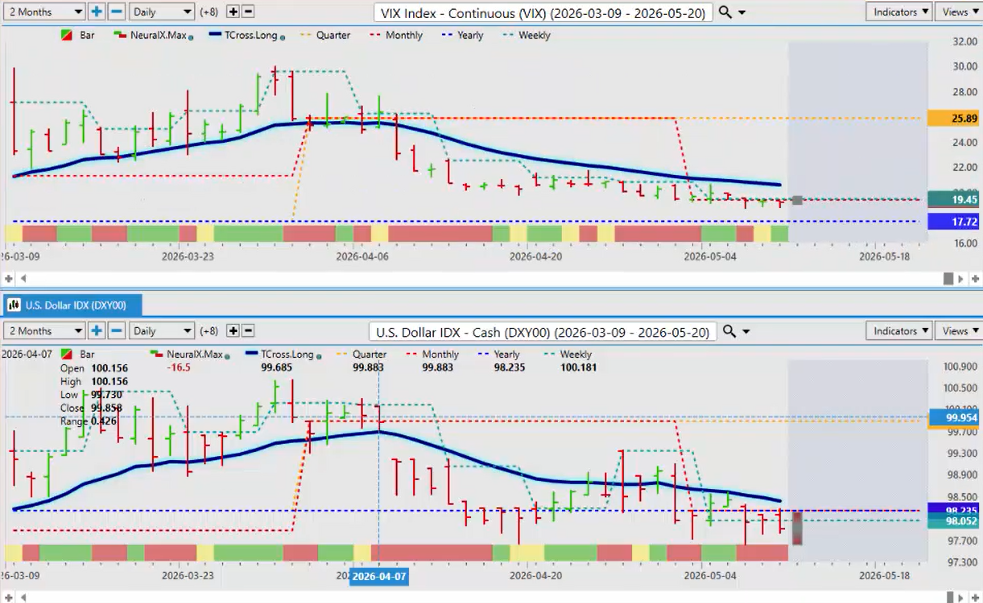
You can see that again when that dollar gapped lower and tanked, the VIX followed it down.
Now the difference here, which is very interesting, the VIX remains or at least the VIX continuous contracts remain above that calendar yearly opening price.
Now, it’s going to be very interesting to see if we can break through this. And right now, it looks very likely that that is going to happen.
Australian Dollar versus US Dollar
So, from here guys, we want to take the same thing and apply it to our forex trading.
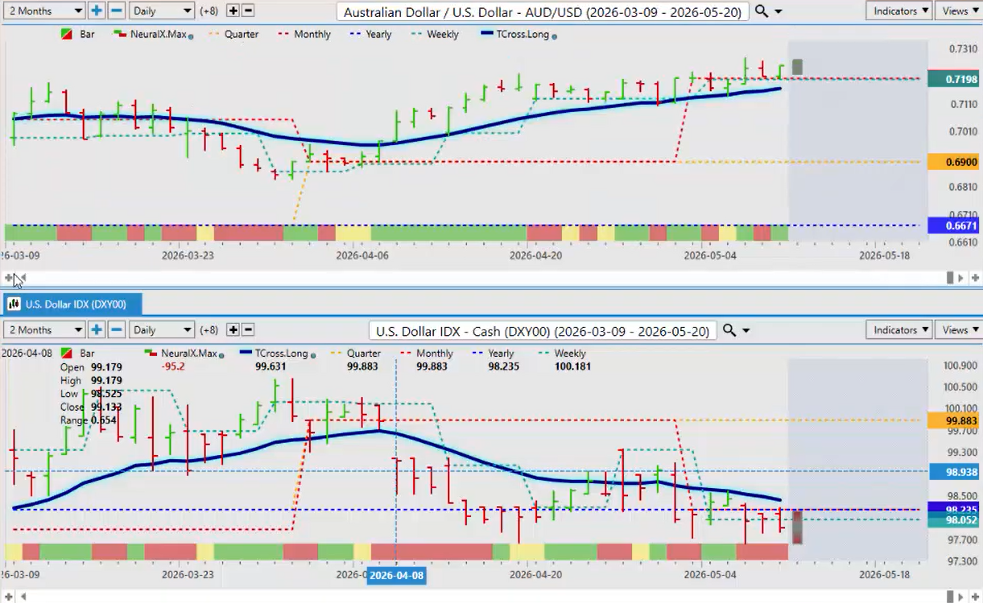
When we look at the forex market here, once again, the dollar moving lower, the Aussie US immediately capitalized on that. And when it crossed over the T cross long, there is absolutely zero lag with this particular trade setup, guys.
I’m not waiting for a crossover. I’m not I’m not putting a again, the whole idea of this week’s presentation is to simplify this down to help you guys say, okay, let’s [clears throat] break this down to its most fundamental trading perspective.
Are we positive on the year on the Aussie? Yes, we are. Since we’re above 6671, we’ve actually never been below it.
Are we above the quarterly and monthly opening price? Yes, we are.
When we crossed above the tross long on the first day, that triggered a multi-day rally.
I believe this can advance considerably higher into year end.
But for next week, the Tcross long 7165. The theory here is as long as we can hold above that, longs are in play.
New Zealand Dollar versus US Dollar
The same thing in this scenario would apply to the Kiwi. There’s no difference here, guys.
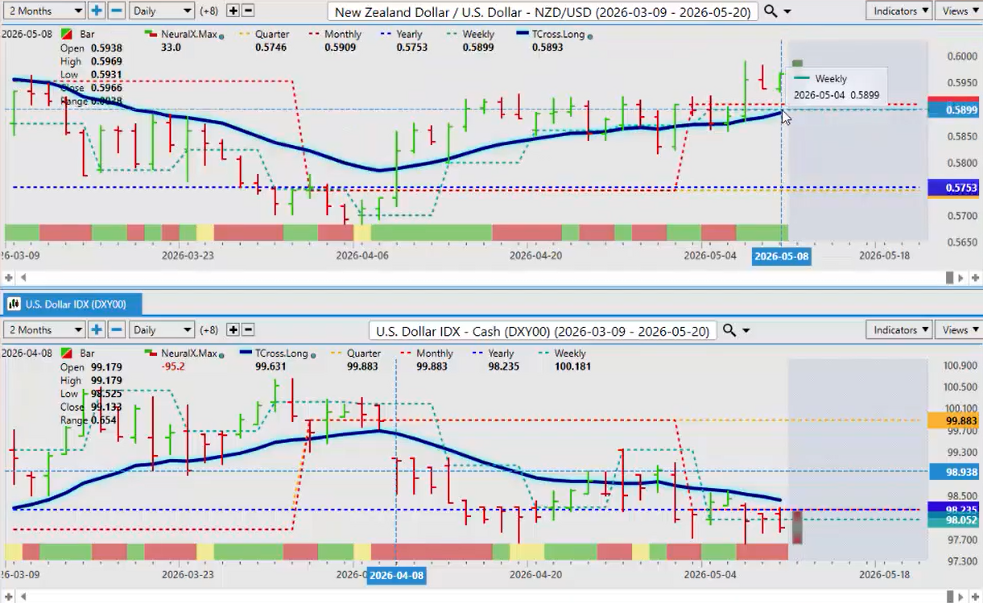
We’re above the yearly opening price. The Kiwi has definitely been more volatile, briefly breaking down below the calendar yearly opening price, but once we retook the yearly opening price with the Vantage Point Tross long, this led to a significant rally.
So again, for next week, the TROSS long is 58.93. That is our core pivot level. As long as we’re above that, longs still remain in play.
So again, if you’re looking at stop losses, it simply wouldn’t make sense if you were buying it on Monday to have your stop loss above 58.93. We would want them below that.
Euro US Pair
Right now again with the Euro US Pair, one of the main drivers in the forex market for next week. We’ve we’ve we’re holding all week above the tross long basically.
Now we’ve retaken the yearly opening price. So all of our support is sitting at the tross long at 11715 and the yearly opening price at 11732.
It’s very simplistic here, guys, right?
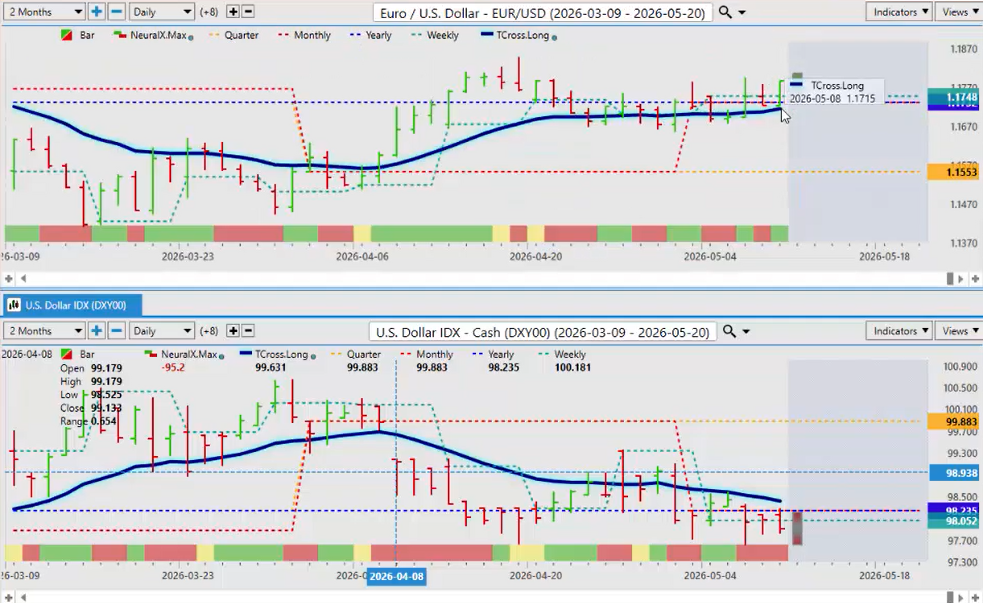
There isn’t anything to complicate this chart. I’ve got my correlated market. I know that the dollar moving up or down is going to drive the Euro US Pair, the Aussie US Pair, the Kiwi. It’s going to drive them all. Right?
So, if again looking at this for the savvy trader, you could say, “Okay, well, I don’t agree. I think that this is bearish.”
And I would absolutely respect that, guys.
So, and the way you would play that is you would put a sell stop below the vantage point t cross long.
That level again, if we look at the last updated bar, you would put a sell order below 11715 if you believe because if we break down and close below that, that would take the pressure off the upside.
So again, long and shorts are at almost the exact same level, guys, and that’s right at this 11715 area.
But you’re also likely going to see some buyers around 117732, the calendar yearly opening price.
Pound Dollar
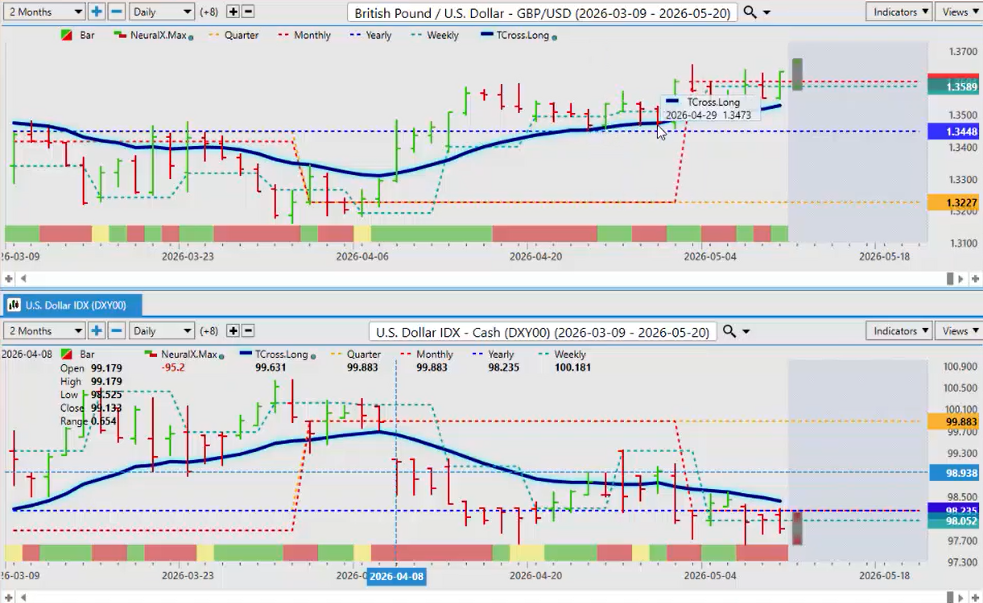
Now, when we look at the Pound Dollar, we see structurally the same thing with the market is holding above the yearly opening price. We’ve tested it multiple multiple times.
But where it’s the market is really drawn to is this singular blue line, which again is the T cross long by itself or the triple EMA cross without the T cross short or medium.
A single predicted moving average will dictate which way this goes.
If we can hold above 13529, then this this pair can extend higher. But we also need the US dollar moving lower.
That’s the way this game works, guys.
But we can assess here. Everything that I’ve looked at is somehow tied back to this US Dollar.
And that’s what most analysts in my respectful opinion only are not talking about.
And that is critical that we understand this right now.
Dollar Yen
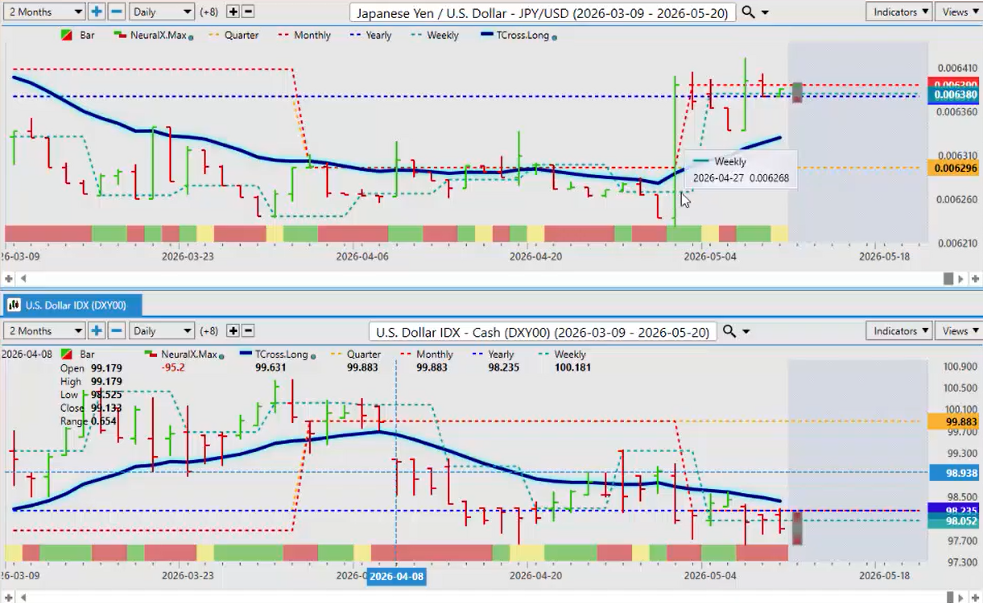
The Dollar Yen. The again this is a very interesting trade setup here. But again, I Okay, I apologize. I’ve got the wrong chart on there.
That’s better. Let me just fix that up here so we can see that. I had it backwards. I apologize.
Uh the Dollar Yen again showing us that the dollar is struggling. The dollar is the base currency.
Now, this is could be a make orb breakak week for this particular pair.
The yearly opening price 156.88 very important level. And the Tcross long is sitting right at the almost the same 158.
So again, if we can continue to hold below the Tcross long and we break down and stay below the yearly opening price, this really will demonstrate weakness that’s coming in the US dollar.
But if we can get back up above that that critical yearly opening price at 156.88, then the carry trade could be back on.
But be very cautious with this one, guys. Uh because I think there’s a lot more going on here if the Japan could use this hike rates simply to try and undo the carry trade and get people to stop selling their currency.
So again, the neural index for next week is pointing down, and this chart as you can see mirrors the dollar index.
US Swiss Franc
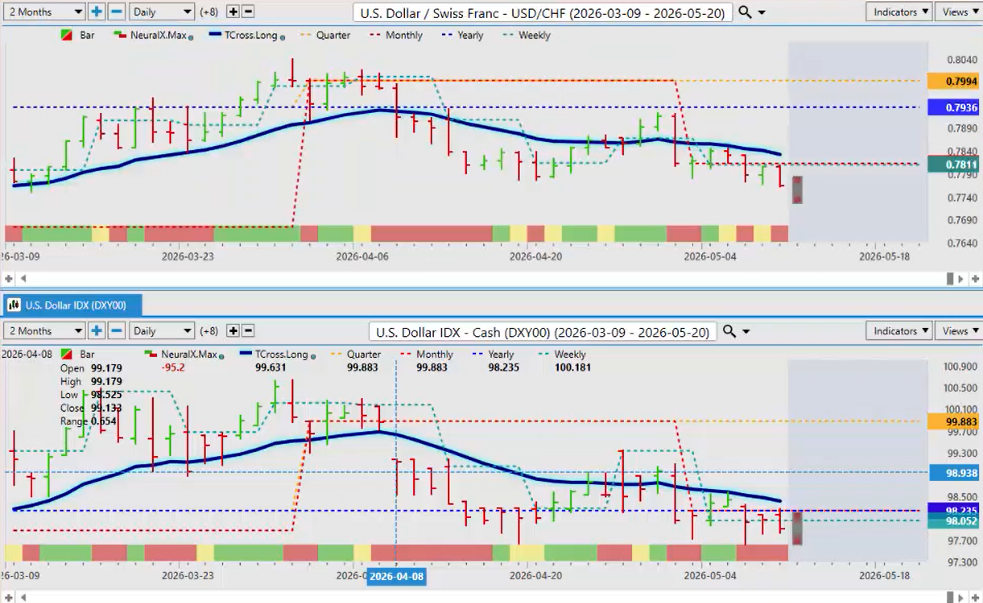
And now the US Swiss Franc again structurally, guys, the structural bias of this is down.
We’ve got our quarterly opening price up here at $79.94. I’ll just put that on there so everybody can see it. 79.94.
The yearly opening price at 7936. The tross long which is coming in at 7832.
So we’ve closed down now below the monthly opening price also at 7814.
So again, going into next week guys, all of your resistance is coming in at that monthly opening price 7814 and of course that all critical trross long at 7832. Shorts heavily favored on this. Okay.
US Canada
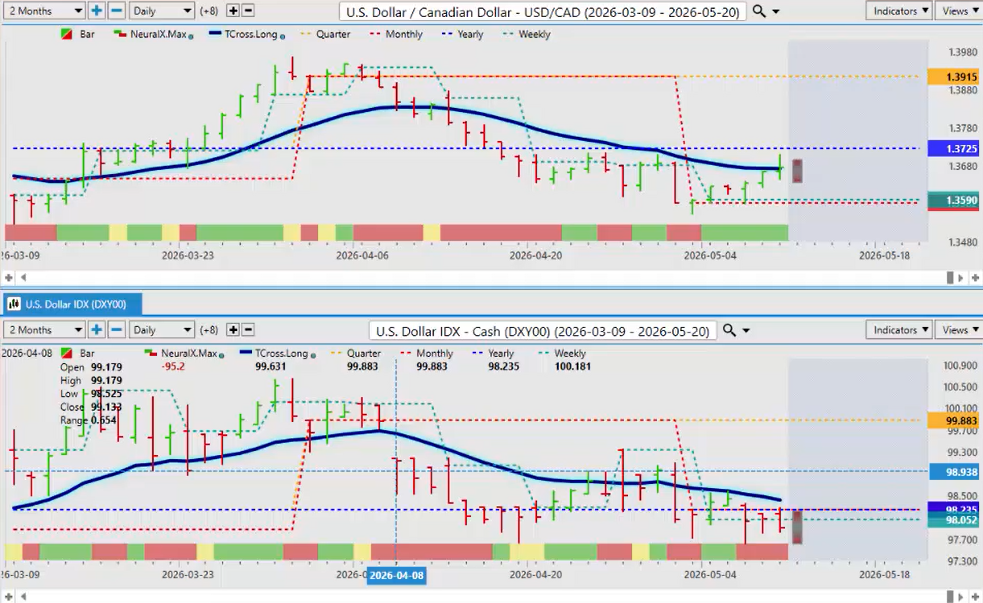
Now the final pair, US Canada.
Now again the Canadian economy under uh uh the the current administration in Canada with Governor Carney or Prime Minister Carney, excuse me. Uh not going well.
Very very horrible terrible job number came out of Canada again on Friday.
So uh the elbows up crew are really struggling here. There’s no question about that.
So, uh, I’m not sure what the next move here, but the trade the, uh, the free trade agreement that’s coming up for renewal, I don’t know if the car tariffs are going to stay on. I assume they are.
None of that is very good for the Canadian dollar.
And if oil prices sink, then there’s an even bigger problem for the Canadian dollar and the Canadian economy.
So, again, right now, we have been able to come right off the monthly opening price down here this past week, and this one is just very difficult to call.
We’re right on the tross long 13673. We’re closing by the spread 13677.
But that’s your critical number, guys. The the yearly opening price 13725.
This pair is notorious for whatever it does on Monday, it does the exact opposite on Tuesday. Okay.
So again, uh I believe that one of the few currencies that will do good uh that will do very poorly, excuse me, against the US Dollar will be the Canadian Dollar based on the policies, the the last decade with the Liberals in Canada.
It’s it’s a difficult uh environment to say the least, and the tariffs are putting a lot of pressure on and that jobs number on Friday out of Canada clearly demonstrated that that things are not going well.
So, I do expect uh another choppy week, but it sounds like things are improving a little bit between the US and Iran, but I’m still a little unclear if there’s an agreement there or not.
But if there is, that will also help boost uh some of your risk on assets.
So with that said, this is the Vantage Point AI market AI market outlook for the week of May the 11th, 2026.