

Register for a Free Live Training
The Hot Stocks Outlook uses VantagePoint’s market forecasts that are up to 87.4% accurate, demonstrating how traders can improve their timing and direction. In this week’s video, VantagePoint Software reviews forecasts for Centene ($CNC), Humana ($HUM), Kopin ($KOPN). Nucor ($NUE), AMD ($AMD), On Semiconductor ($ON), Pilgrim’s Pride ($PPC), TJX Companies ($TJX), Wabash National Corp ($WNC)
VantagePoint AI Hot Stocks Outlook for May 15, 2026
Hot Stocks Outlook – May 15, 2026
Hello again traders, and welcome back to the Hot Stocks Outlook for May 15, 2026.
I hope you all have had an excellent week out there in the financial markets.
And as always, we are here to cover the most recent Vantage Point AI predictive forecast. So, if you haven’t already, be sure to go ahead and click the link down in the description below and get signed up for a live demonstration where you can learn all the specifics about how these predictive indicators and technologies are helping traders make much better trading decisions out in the marketplace.
We have a whole lot of different markets opened up here, but there’s actually a lot of correlation across the broader stock market. So, there’s a really great example of how all of these predictive tools work together regardless of if you’re trading healthcare stocks, tech stocks, or the broader indices.
Centene ($CNC)
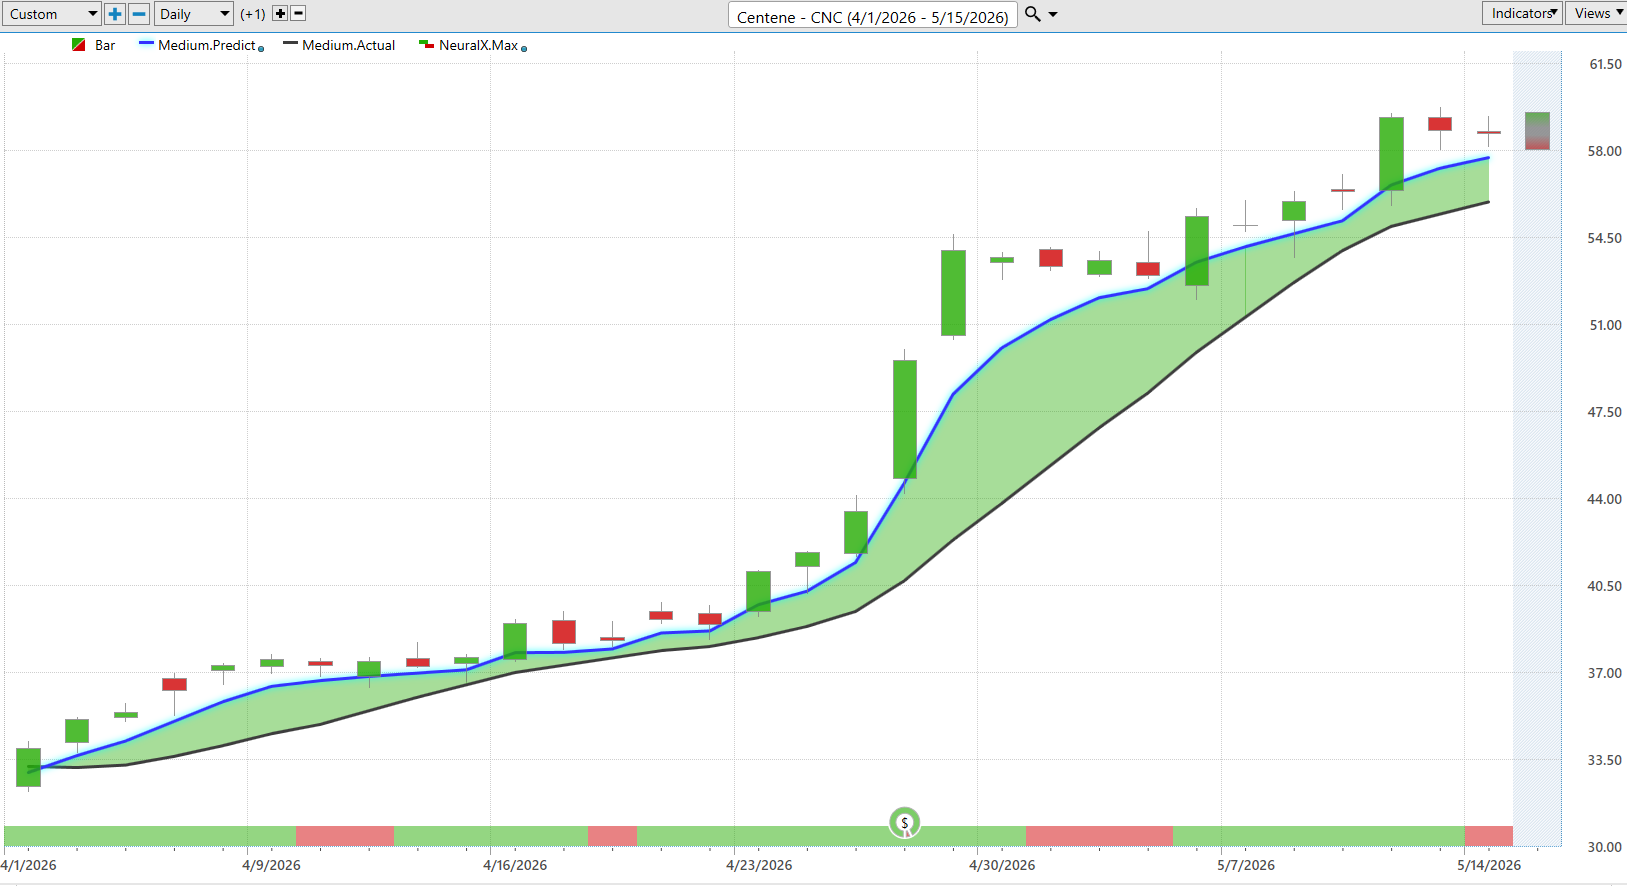
And so what we’re looking at here in shares of Centene is, of course, daily bars and candles. That means each one of these candles is going to represent a full and complete trading day.
And so it’s right up against all of that daily price action. You’ll first notice that there is a black line, but also a blue line value. And so what the black line is, is actually a simple moving average. So, this is a very common technical analysis indicator. In this instance, what it is is a 10-period simple moving average. So, it looks at the previous 10 closed prices, adds those all together, and then divides by that value.
This is what VantagePoint traders can use as a baseline. Right? So, this has no predictive capability. All of the data that generates that black line value comes from the past, and it really just summarizes what’s already occurred.
And so what VantagePoint traders are able to do is compare what we might call that lagging or actual moving average to this proprietary predicted moving average. And so for this number, essentially a price for it to get calculated and plotted and placed on the chart every evening, this is where the technology of artificial neural networks comes into play.
They’re performing what we would call intermarket analysis. And so what that means is that rather than just using traditional technical indicators that simply look at past prices, VantagePoint’s technology is looking at dozens of other markets that are known to drive and influence future price.
Now, this can be things like other individual stocks. It can be ETF groups that are going to wrap up a wide swath of the broader stock market. It can be those broader indices, but it’s even going to look at things like global currencies or interest rates or even particular commodities where applicable.
So, it really takes this global approach, looking at whether these relationships are leading or lagging relationships, how they affect future price action, and then Vantage Point produces a forecast.
So, whenever this blue line gets above the black line, what’s suggesting that these average prices are going to start moving up, and traders may want to look to take a long position.
Now, what we recognize is that there were a whole lot of markets starting to turn higher at the beginning of April. So, this has been going on for about a month and a half here where we see the tech space and a lot of individual stocks really performing quite well. You see Centene up about 71% in just 30 trading days.
But VantagePoint’s able to really train these predictive neural networks to solve different problems for the trader. So, while we get the overall trend direction here with our predicted moving average, if you look at the bottom of the chart, you see this bar that goes from green to red and back to green. And this gets updated every single trading day.
This is also utilizing that neural network technology, but to solve a different problem for the trader. In this case, it’s short-term strength or weakness over the next 48 hours, or you can think of that as just a couple of candles on the chart.
Now, in addition to that short-term forecasting, you even have an intraday predicted high and predicted low. This is where we can train these different neural networks to solve these different problems, that being the overall trend of the market, short-term strength or weakness over those very short periods, and also intraday price levels where traders can look to take positions.
What this does is really collectively work as an overall forecast, and we can see just how accurate this all is. You see as the neural index goes bearish, the overall momentum really calms down a little bit for the next couple of days, quickly gets back up to a green configuration, and we see that momentum and strength entering into the market again.
Here you see the neural index bearish. A couple days of selling, market running sideways, but very quickly that neural index gets bullish and we see that momentum enter into the marketplace.
So, really nice opportunity here in Centene. Again, about a 70-plus% move just in the past 30 trading days.
Humana ($HUM)
We’ve really seen a lot of this via features like the VantagePoint IntelliScan. Now, this is a scanning feature which really allows us to scan with these predictive indicators and identify where these situations are starting to shift, where the trend is starting to get bullish.
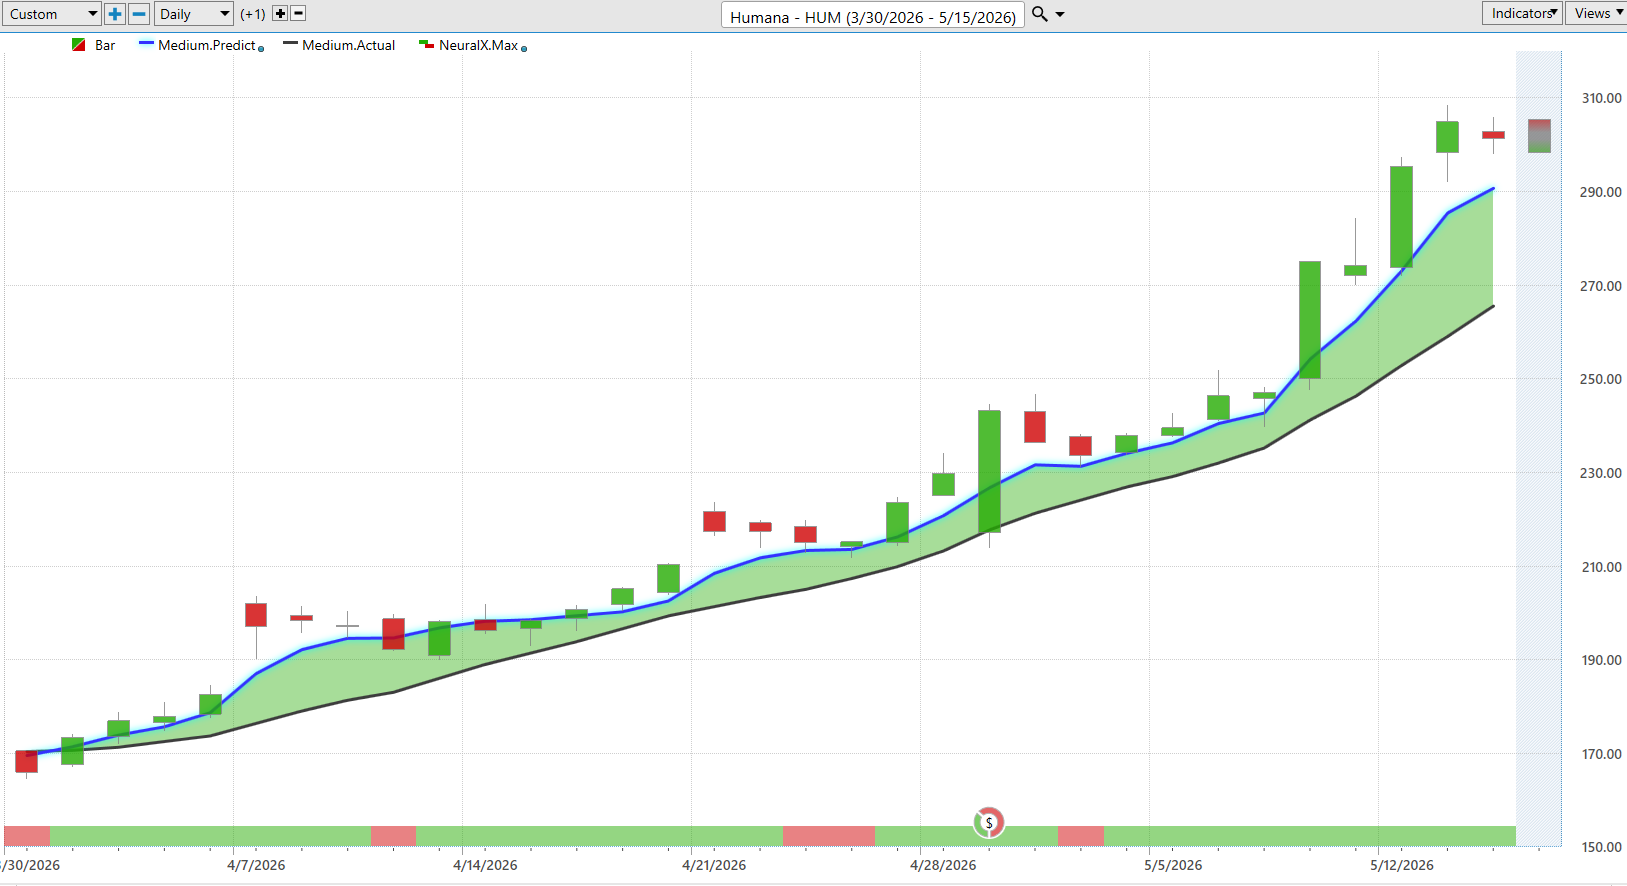
Here, shares of Humana, we see a very similar forecast. Right? Blue line getting above the black line. You’ll certainly have these dips where the neural index gets bearish and you see these lower lows over the next 48 hours, but the trend, right, that blue line still very much above the black line, and the overall trend is bullish.
You see again here neural index gets bearish, bearish again here, but overall the trend is up. And you see when the trend and the neural index are both bullish, you really see a lot of bullish momentum and price accelerating to the upside.
So overall, Humana now over the past month and a half, again, up 73% in just the past 31 trading days. And healthcare has been one of those spots. It’s been a really strong spot of the broader economy and doing well.
Kopin ($KOPN)
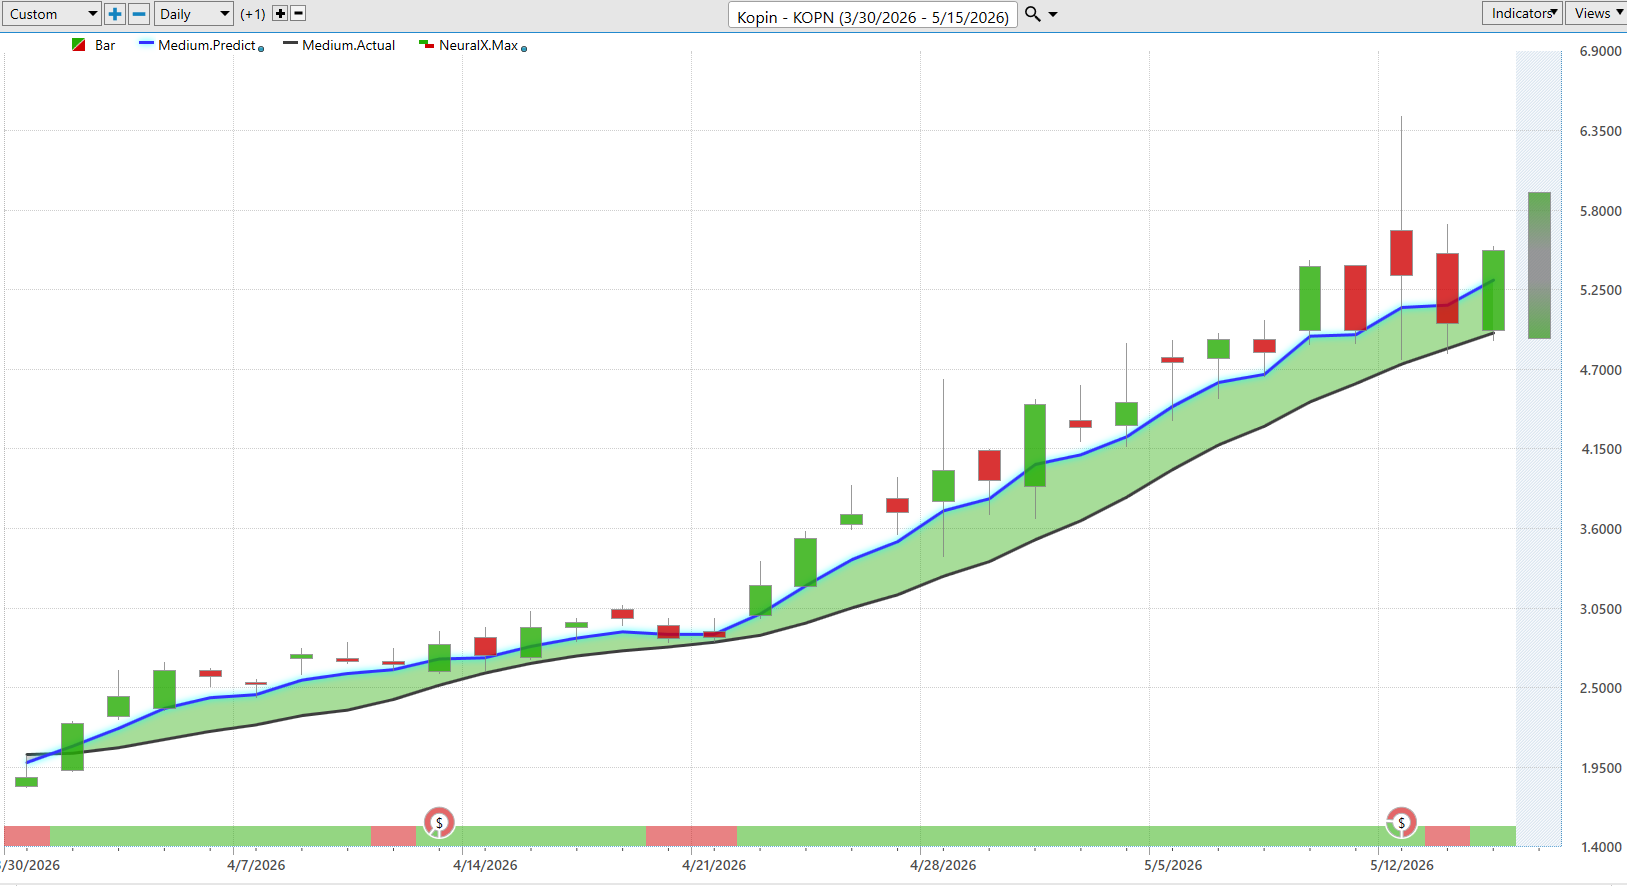
Here’s Kopin ($KOPN). This is actually a stock we looked at over a couple of weeks ago, and it’s a great example to highlight how traders can manage opportunities.
We can identify that the broader market’s moving higher. It makes sense to get some long positions in the portfolio at the beginning of April. But, of course, you want to manage those positions effectively.
When you can add to a position strategically, well, that really makes a big difference in maybe how much you’re able to pull out of that particular opportunity.
So, we see here with shares of $KOPN, this being a very low-priced stock, up about 142% just over the past 31 trading days. But maybe more importantly is how are these short-term forecasts adapting for traders that are already in the market.
You see how you get these predicted levels before each and every trading day, and that’s very important.
We see just this past week, this being Monday through Thursday, these last four trading days indicating, “Hey, look down towards these predicted lows if you want to be a buyer.”
You actually see that neural index goes bearish, potentially indicating, “Look, go ahead, look to take a little bit of profit here, take some off.”
A really nice move for the week here in a very cheaply priced stock, about a 14% rally just over the past three trading days. Of course, this has been a 140% to 150% move over the past month and a half here as we’ve seen a lot of these stocks turn up at the beginning of April.
Nucor ($NUE)
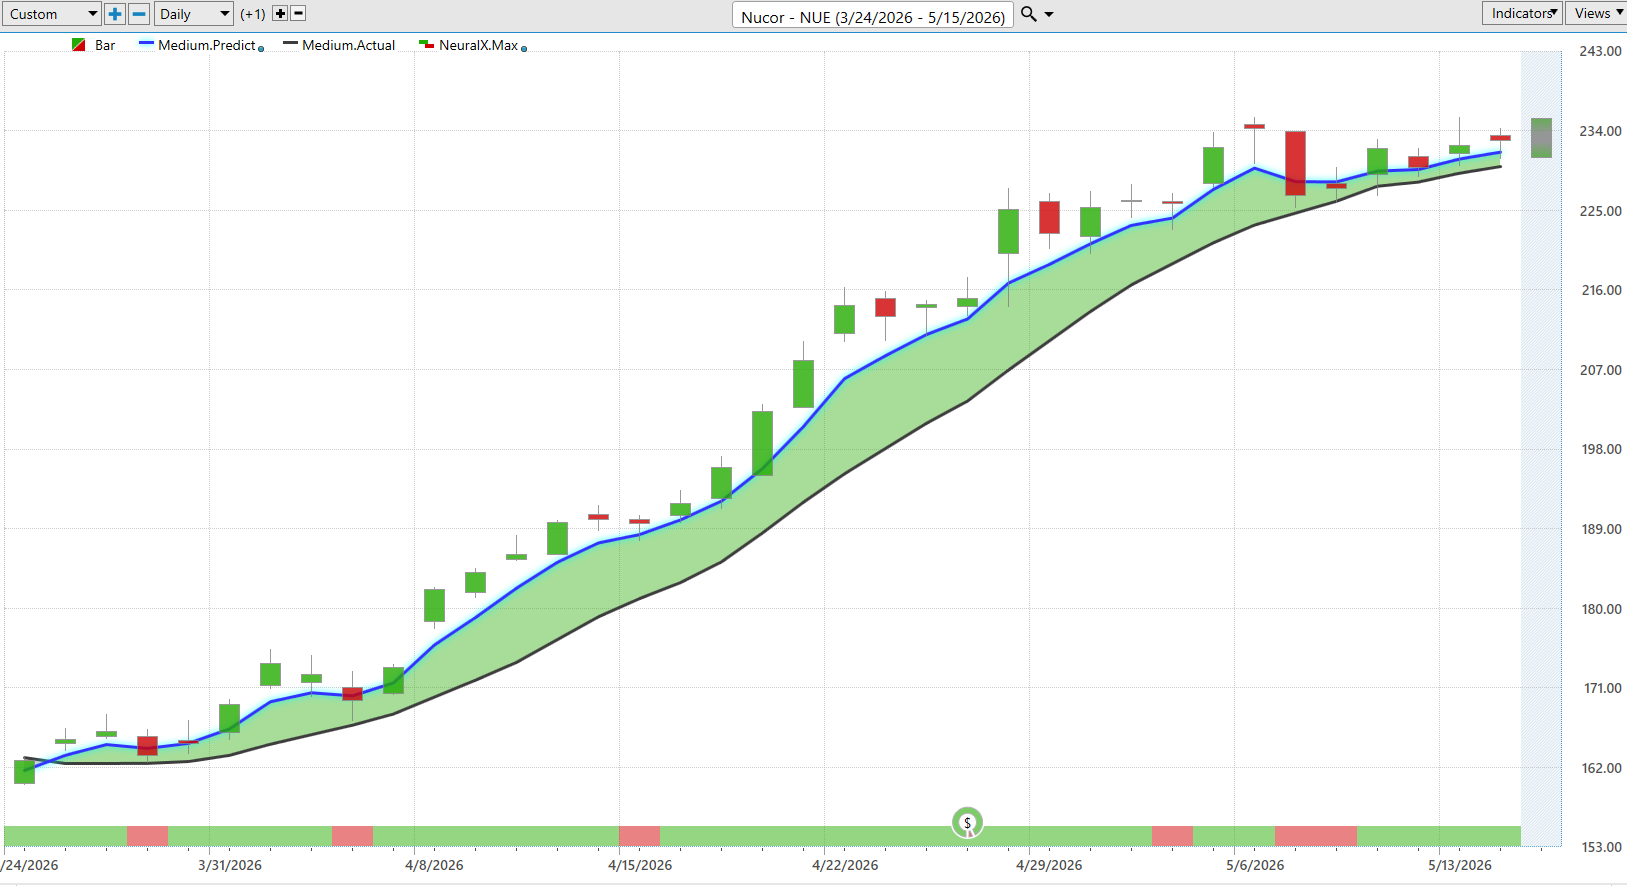
Here’s Nucor, another stock that we looked at quite a bit here in the steel manufacturing space. Cleveland-Cliffs doing well, Reliance Steel & Aluminum, all these steel stocks as a sector starting to move higher.
But we see again this started all the way back really at the end of March, seeing that blue line cross above the black line. There’ll be these little dips where that neural index goes bearish, but when you take a step back, the neural index has a very high level of accuracy, upwards of 86% accuracy, and that’s through earnings reports, Fed announcements, just maintaining that very high level of accuracy.
So, traders can really rely on these tools. Again, you’ll see these periods where neural index gets bearish. You run a little sideways, but the overall trend very bullish, and you see a lot more bullishness out of these forecasts than bearishness.
So again, we look at Nucor, very nice move here over the past month and a half, couple of months here, about a 41% rally. But, of course, we can look more and really fine-tune this with those predicted highs and lows and just numerous opportunities on the rally higher to accumulate a position, take some profits potentially as the shares move higher.
Again, even this week as far as a forecast goes, saying, “Hey, look, buy down toward these predicted lows on Tuesday.” You see moving up towards all of these predicted highs in pretty quick order here in shares of Nucor.
AMD ($AMD)
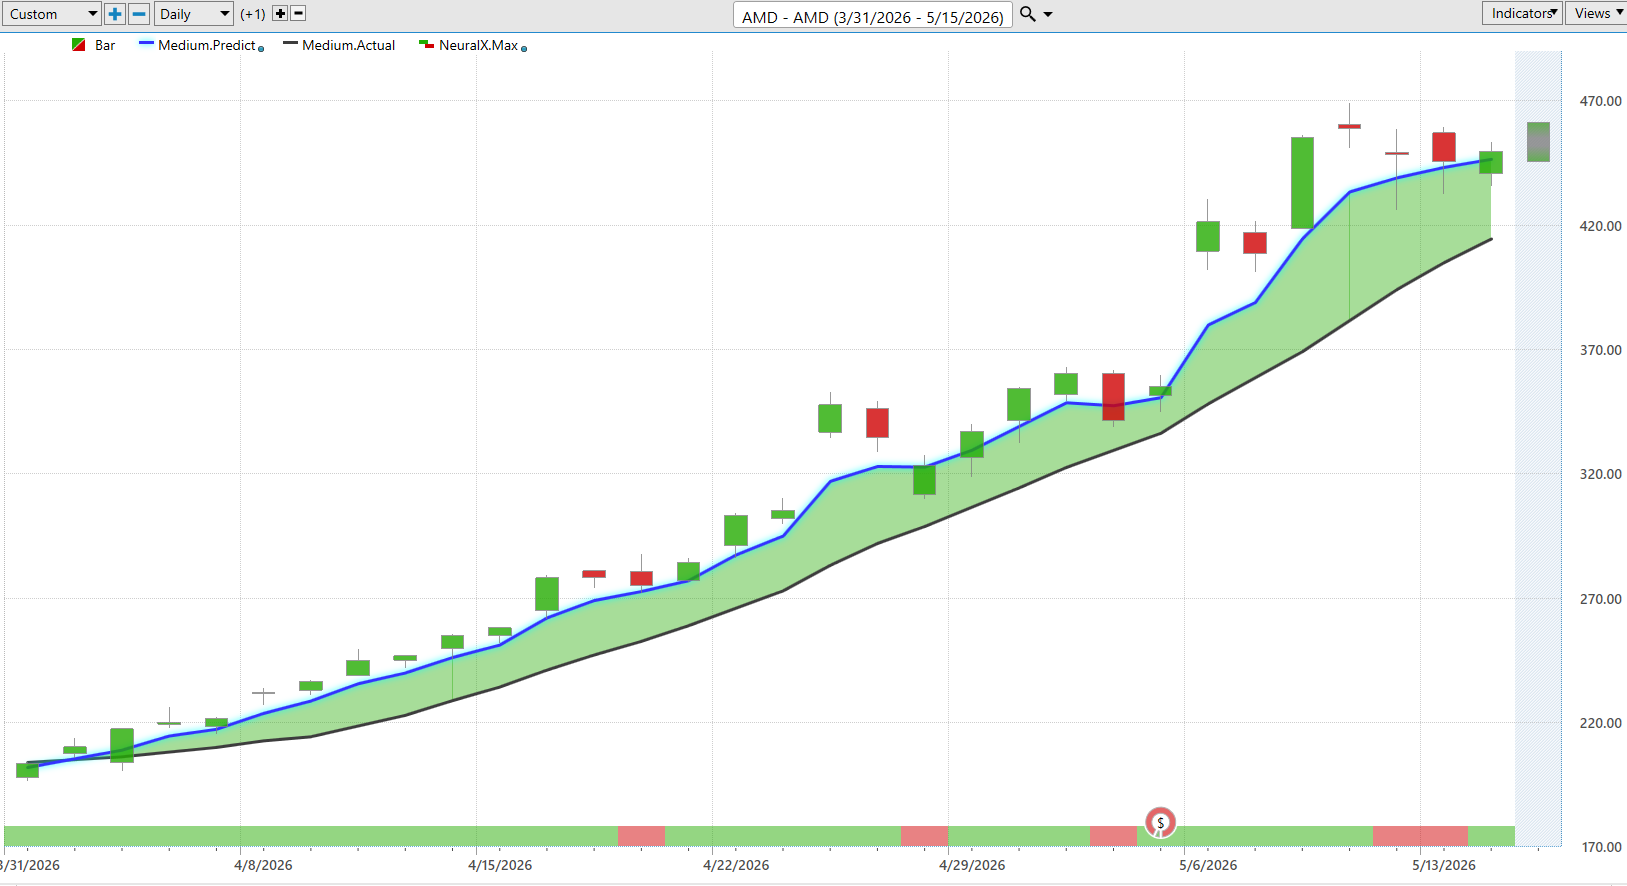
Here’s AMD. Just wanted to stop back in with some of these tech stocks, which again really all turned higher in April.
So, when you have a feature like that IntelliScan, you see that we’re getting a lot of these bullish forecasts coming through, these fresh one or two day old crossovers from the predicted moving average, and that really indicates that something’s going on here.
You see shares of AMD up 115% just in the past 31 trading days.
On Semiconductor ($ON)
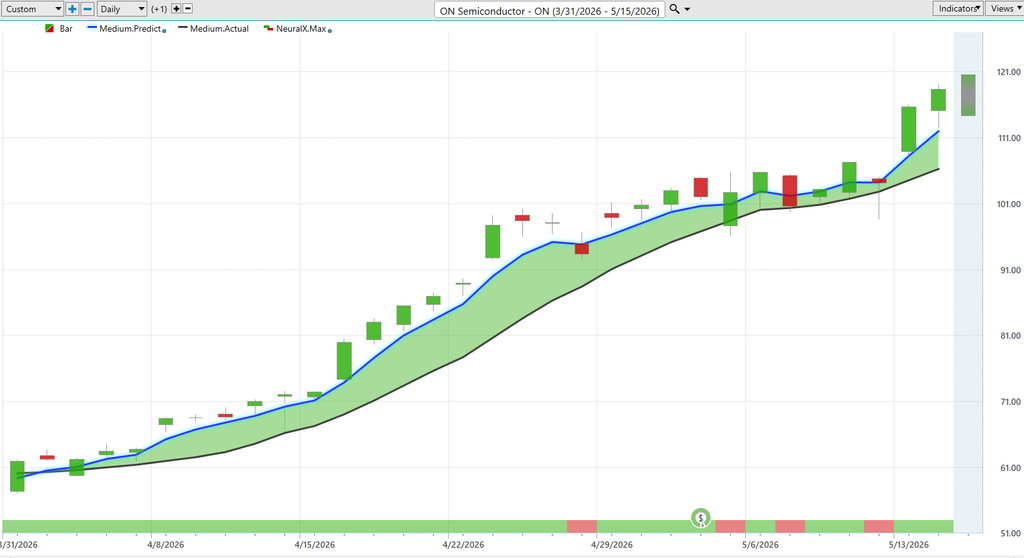
ON Semiconductor, another stock that we took a close look at, really having a very good couple of weeks. I mean, we looked at this probably three or four weeks ago. Up about 93% now over just the past 30 trading days.
Again, a good example to say, okay, well, if this is a stock where you’re trading, you’ve got that really nice entry early on in the market. Well, you want to keep managing that opportunity, but you’re able to do that with profits, and that’s very valuable for the trader.
You again see here Tuesday getting a move towards the predicted low and pretty immediately intraday getting above that predicted low and continuing the rally, another 15% now in just the past three trading days in shares of ON Semiconductor.
Pilgrim’s Pride ($PPC)
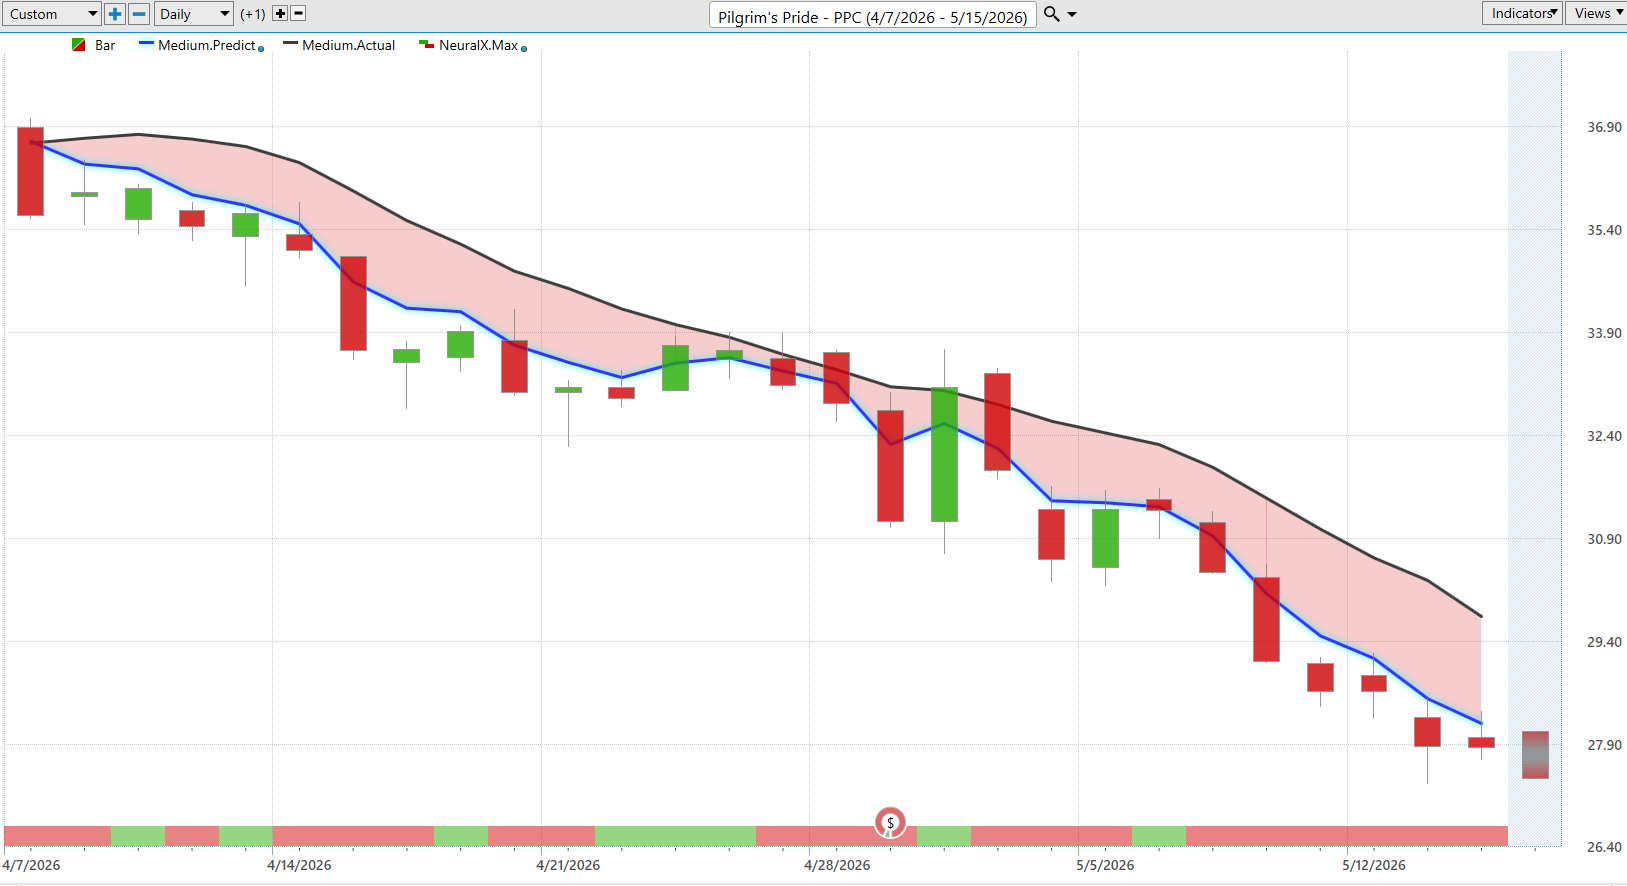
Now, a few markets looking bearish here, and so you really understand where are these areas where we want to actually avoid positioning in the market or potentially short and balance out the portfolio.
Here we see Pilgrim’s Pride in a very strong downtrend. So, this entire month as the market’s been moving higher, very clear forecast here that says Pilgrim’s Pride is really not one of those markets where we want to be on the bullish side.
If anything, looking up towards these intraday predicted highs to short and take profits on short positions. Again, you see just this week really the opposite of those previous examples. We’re on Tuesday moving up to the predicted high and then starting to go lower.
As we see a lot of volatility kick into the markets, as you get so extended in price, well, as the broader markets see that volatility, it can only drag down some of these areas. We’re already seeing some weakness in the market.
TJX Companies ($TJX)
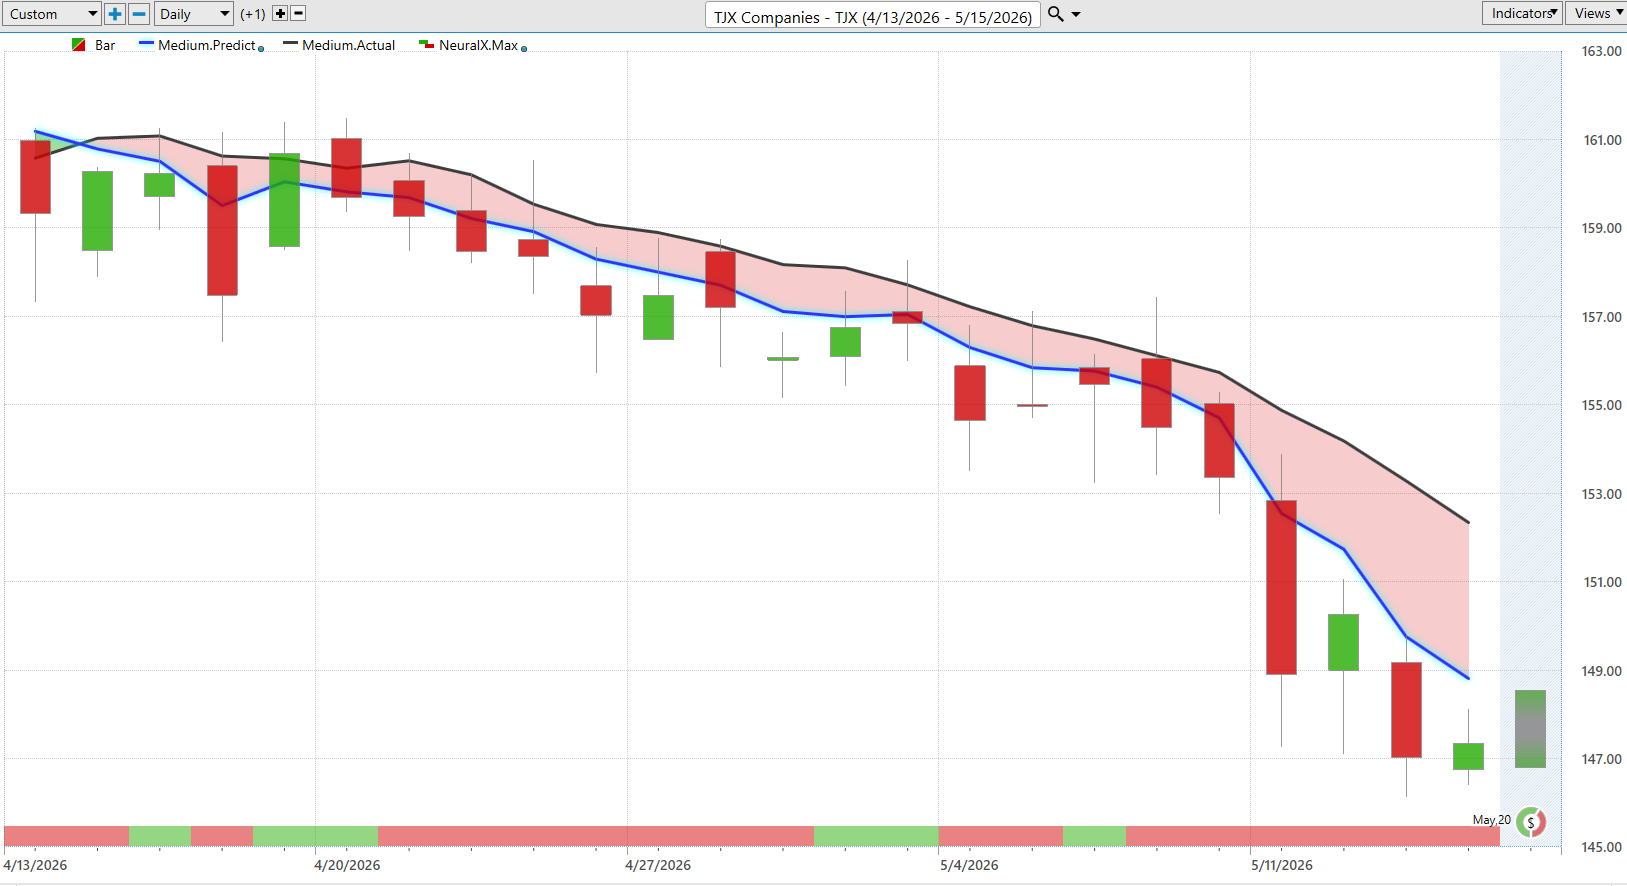
TJX blue line below the black line. Often a very strong stock here, but you see this neural index going bullish a couple times, but very clearly the trend is down.
Really this roadmap from the predicted highs and lows guides the trader moving forward that says, look, another area where if we’re trading here, want to short, take profits on short, seeing a lot of weakness here moving into earnings next week.
So, really nice opportunity again on the bearish side here. Overall, seeing about a decline of about 8%. Again, pretty strong stock, not a huge move, but very clearly this is not a place you want to be positioned as we see tech stocks and healthcare stocks performing extremely well.
Wabash National Corp ($WNC)
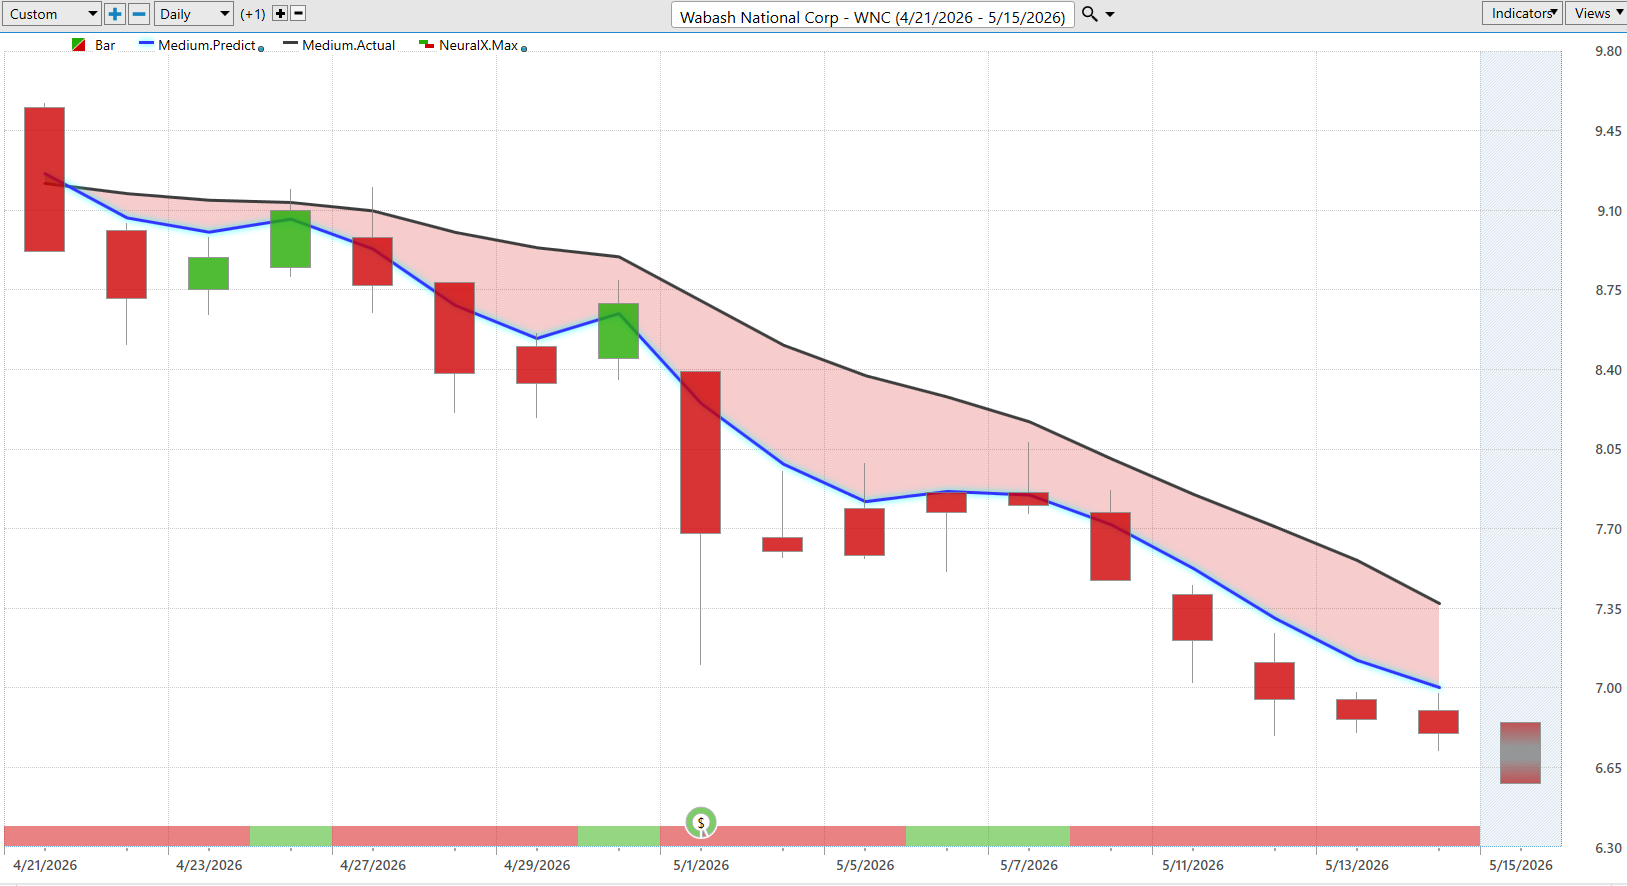
Lastly, we’ll just go ahead and end on Wabash National. Here you see this blue line below the black line. Couple periods again around earnings where that neural index gets bullish.
Here you see again getting those higher highs over that subsequent trading day, but very clearly it’s easy to identify which markets are in downtrends.
So, when you’re getting ready for the trading day, you really understand very quickly, look, where are my levels as far as trading goes? Which markets do I want to focus on the bullish and potentially the bearish side?
Then you get this roadmap that really just guides you moving forward day after day to really stay in the positions that are working and potentially add to those positions with profits so you can stay ahead in that trade and really make the most of those opportunities.
You see shares down about 25% here in just the past 17 trading days.
So, a lot going on out there. We’ll go ahead and leave it there for today. But once again, this has been the Hot Stocks Outlook for May 15th, 2026.
Have a great rest of your week. Thanks again, and bye for now.