


Register for a Free Live Training
The Hot Stocks Outlook uses VantagePoint’s market forecasts that are up to 87.4% accurate, demonstrating how traders can improve their timing and direction. In this week’s video, VantagePoint Software reviews forecasts for Vishay Intertechnology ($VSH), Chewy ($CHWY), Insight Molecular Diagnostics ($IMDX), Palo Alto Networks ($PANW), MarketAxess Holdings ($MKTX), Datadog ($DDOG), Boston Beer ($SAM), On Holding ($ONON)
Hello again, traders, and welcome back to the Hot Stocks Outlook for May 22nd, 2026. I hope you all have had an excellent week out there in the financial markets. And as always, we’re here to take a look at the most recent VantagePoint AI predictive forecast.
So if you haven’t already, be sure to go ahead and click that link down in the description below and get signed up for a live demonstration. You’ll be able to learn how all of these predictive tools and technologies are helping traders make much better trading decisions out in the marketplace.
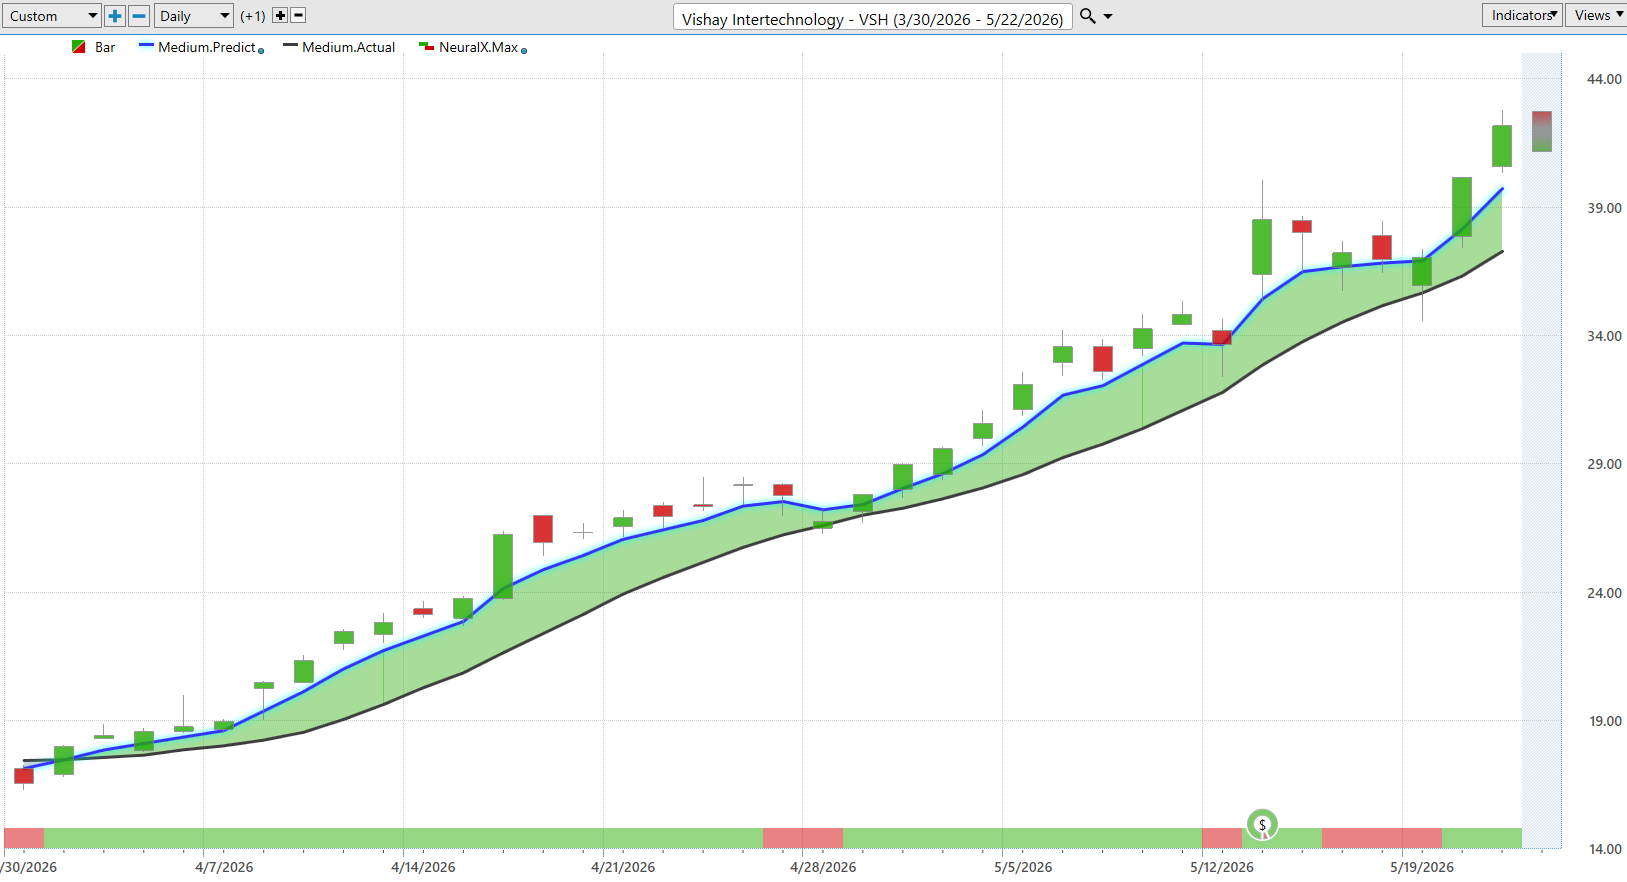
And so we can start out here with shares of VSH. And this is a very good proxy for what we’ve seen out of the broader stock market, where we identified things like the QQQ and the SPY, those broader indices turning up really at the beginning of last month. So be sure to go ahead and watch those previous Hot Stocks Outlooks. But once we understand how the forecast works for VSH, we can apply that to all of these subsequent predictive markets.
And so what we have with VSH here is of course daily bars and candles. So each one of these candles would represent a full and complete trading day. And the first thing we want to understand from VantagePoint’s output is this black line and blue line value.
And so what the black line is, is actually a simple moving average. So this is a very common technical analysis indicator. And in this case, it would be a 10 period. So it would look at the previous 10 closed prices, add them all together, and then divide by that number.
And the real weakness with traditional technical analysis like this is that all the data comes from the past. So it is known information and has no predictive capability. And so this really acts as a baseline for VantagePoint traders who are looking for signals from our VantagePoint predicted moving average.
And so for this blue line value, for it to get calculated and plotted on the chart every evening, well, this is where that technology of artificial neural networks comes into play and is performing what we would call intermarket analysis to forecast accurate future prices.
So rather than just looking at those past prices and reconfiguring what’s already occurred, VantagePoint looks at dozens of other markets that are known to drive and influence future prices. So this can be things like ETF groups throughout the tech space and potentially not in the tech space. This can be individual stocks.
And so what’s important about this is understanding that some relationships can be leading or lagging, some can be positive or inverse correlations. So this is where VantagePoint’s technology is able to look globally at dozens of other markets that it’s determined affect future price movements and incorporate that into the forecast.
So it’s going to look at things like the interest rate market, the bond market, global currencies, and even potentially global commodities where applicable as it weighs into that forecast.
And so when VantagePoint traders see this blue line value start to move above the black line value, or that lagging moving average, it’s a signal that average prices are going to start moving higher and traders may want to look to take a long position in agreement with their trading style, whether that be a swing or position trade or just short-term day trading, recognizing that the trend is now up.
And we see since that forecast came through, the market’s up over 130% just in the past 36 trading days really since that onset at the beginning of April.
But that’s not the entirety of VantagePoint’s predictive tools and indicators. If we look at the very bottom of the chart, you see this bar that goes from green to red, back to green. Well, this also gets updated every single trading day for the trader and it’s forecasting short-term strength or weakness over the next 48 hours.
Now this is very important because we can really fine tune these indicators to match the problem at hand. So once we know the overall trend direction is up, but when that Neural Index goes bearish in this case where we might have a bullish directional bias on the market, it’s a warning sign that we’re likely going to see some lower lows over just that next 48-hour period.
So traders can understand that when that Neural Index goes bearish, expect some weakness over the next 48 hours. You see it happens here through earnings. So you get that earnings catalyst really propelling the stock here. But again, you see the Neural Index goes bearish, some weakness over that 48-hour period, but in a market where the trend is clearly bullish and on the upside.
And so once you’re really armed with that information, you understand when to buy on the dip, when to look for lower prices, but also you’re provided an intraday predicted high and low forecast for the next trading day.
So what’s happening here is there’s separate neural networks solving all of these different problems for the trader. The predicted moving average for trend direction, the Neural Index for short-term strength or weakness, and then intraday actually picking out individual levels, kind of exact price targets for the trader.
And again, as long as that blue line remains above the black line, traders would look towards these predicted lows to accumulate a position. And what’s so important about this is it’s not just about recognizing that the markets are shifting higher at the beginning of April, but how you’re able to manage that and add to a position effectively without taking on too much risk.
And so you see here, even just this past week, this would have been Friday last week, this would have been Tuesday this week, and you see just about a picture-perfect opportunity to buy on that trading day. And the market has continued up about 17% just this past week, just over the past three trading days.
So really exciting stuff here. Again, about a 130% rally and just another clue that tech stocks and semiconductor stocks are performing well here. Like I said, we looked at things like ON and AMD in many of these previous Hot Stocks Outlooks over the previous four or five weeks.
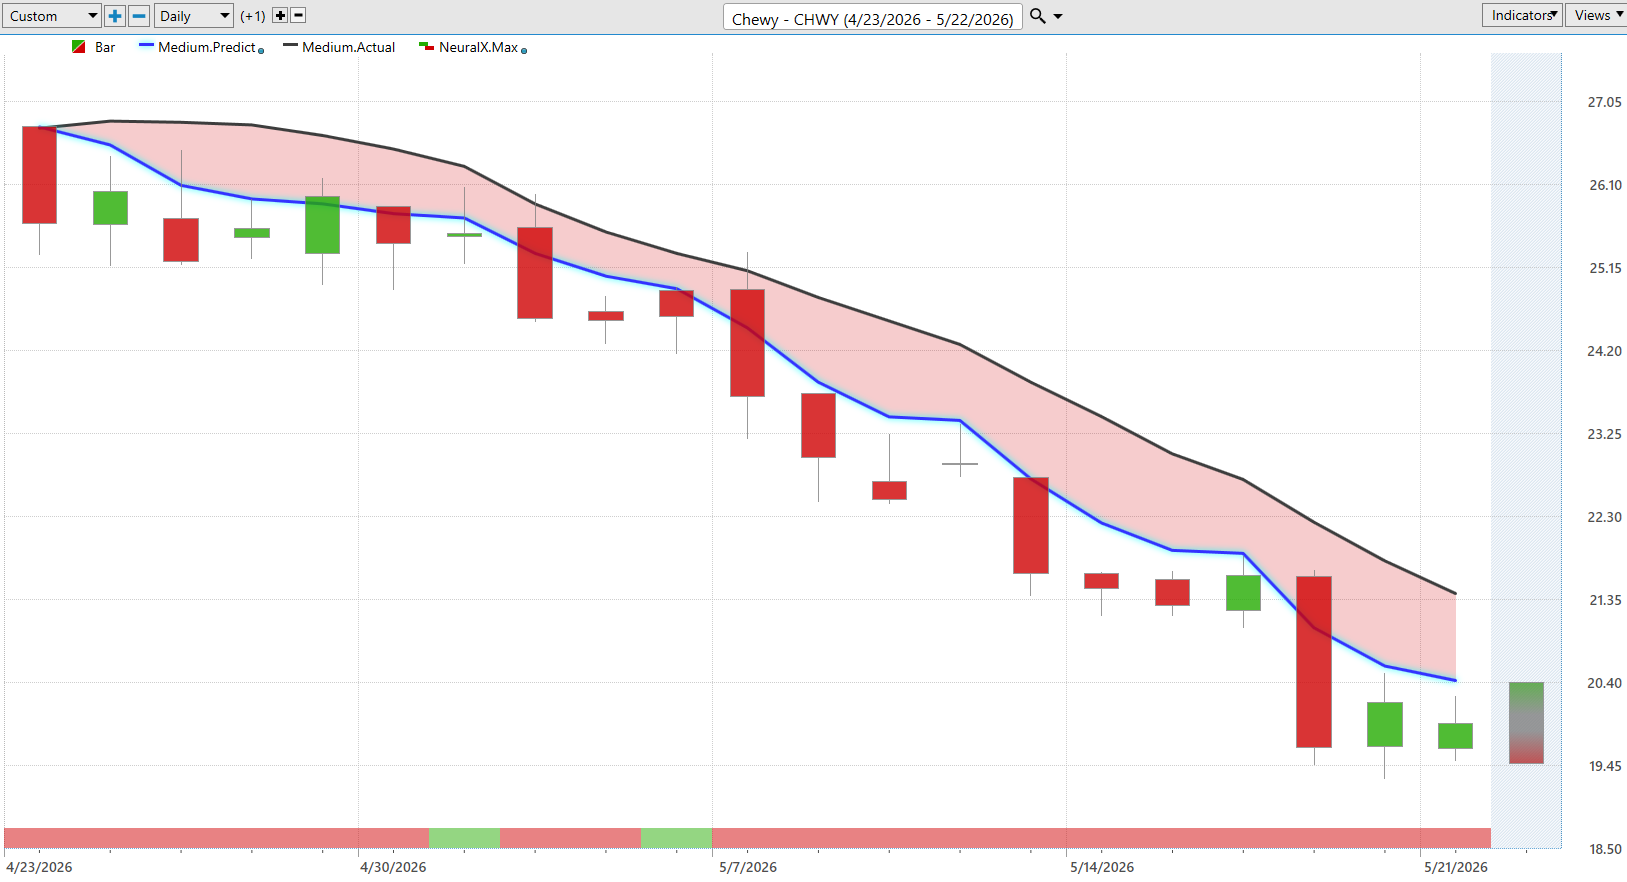
Now here’s CHWY, and I just wanted to bring this through that it doesn’t matter whether we’re on the bullish side or the bearish side. These forecasts are consistently accurate regardless of the markets you’re trading.
And so here we see this blue line moving below the black line, a lot of weakness from the Neural Index. You see when we get bullishness from the Neural Index, you actually do get some higher highs over that next trading day, but clearly the overall trend is bearish here.
And so regardless, again, if markets are moving higher or lower, traders can use this information to their advantage, but also potentially just avoid markets that are in downtrends.
So instead of focusing on the wrong things, just recognizing where VantagePoint is actually showing a bullish forecast. Here in CHWY in a very strong market, where the SPY and QQQ are hitting new highs day after day after day, we see one, two, three, four, five, six, seven, eight, nine, ten entries here as this market for CHWY goes lower.
And we can see overall the move here of about 25% in just 20 trading days. So clearly you want to be focused on the right things in markets that are moving higher.
Insight Molecular Diagnostics ($IMDX)
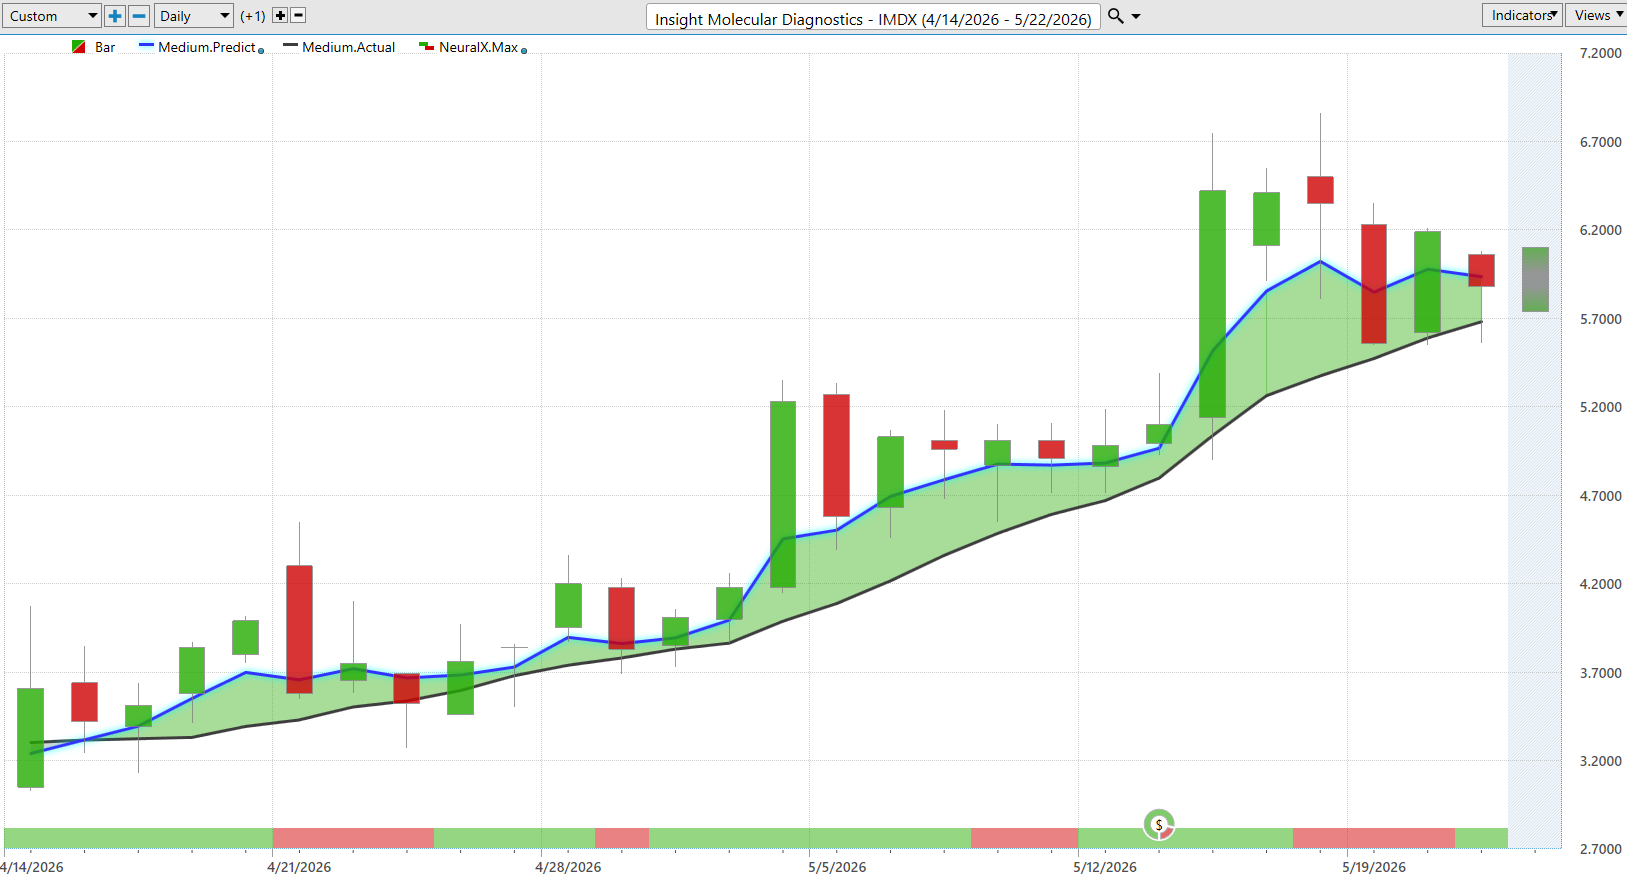
Here’s IMDX, and again, a great example of even a low-priced stock where there may be some sort of illiquidity day-to-day moving in the market and not a whole lot of shares traded.
Well, VantagePoint is a price forecasting tool. So it’s going to do a good job at forecasting where price is likely to move. We see this blue line getting above the black line here. The Neural Index goes bearish, and you’ll notice that you get these subsequent 48-hour periods of weakness moving forward.
But of course we have those VantagePoint predicted highs and lows. And now mind you, these levels are known before each and every trading day. So the trader understands that if this trend is up, that’s a prime location to start a position.
Here’s another nice opportunity to buy at this price level. And notice that it’s letting you know to expect price to go lower over the next 48 hours. The trend is still up, but if you want to be a buyer or hold onto your position, expect the market to trade down at these levels.
You just see how effective this is at pretty much every few days moving down towards that predicted low and another opportunity to participate in the uptrend here.
So overall we see a little bit of a choppy market as you run sideways for a while, but very clearly the blue line is well above the black line, the trend is up, and a 75% move here out of a very cheaply priced stock.
So easily a thousand shares there has you up about $2,600 just over about a month’s time here.
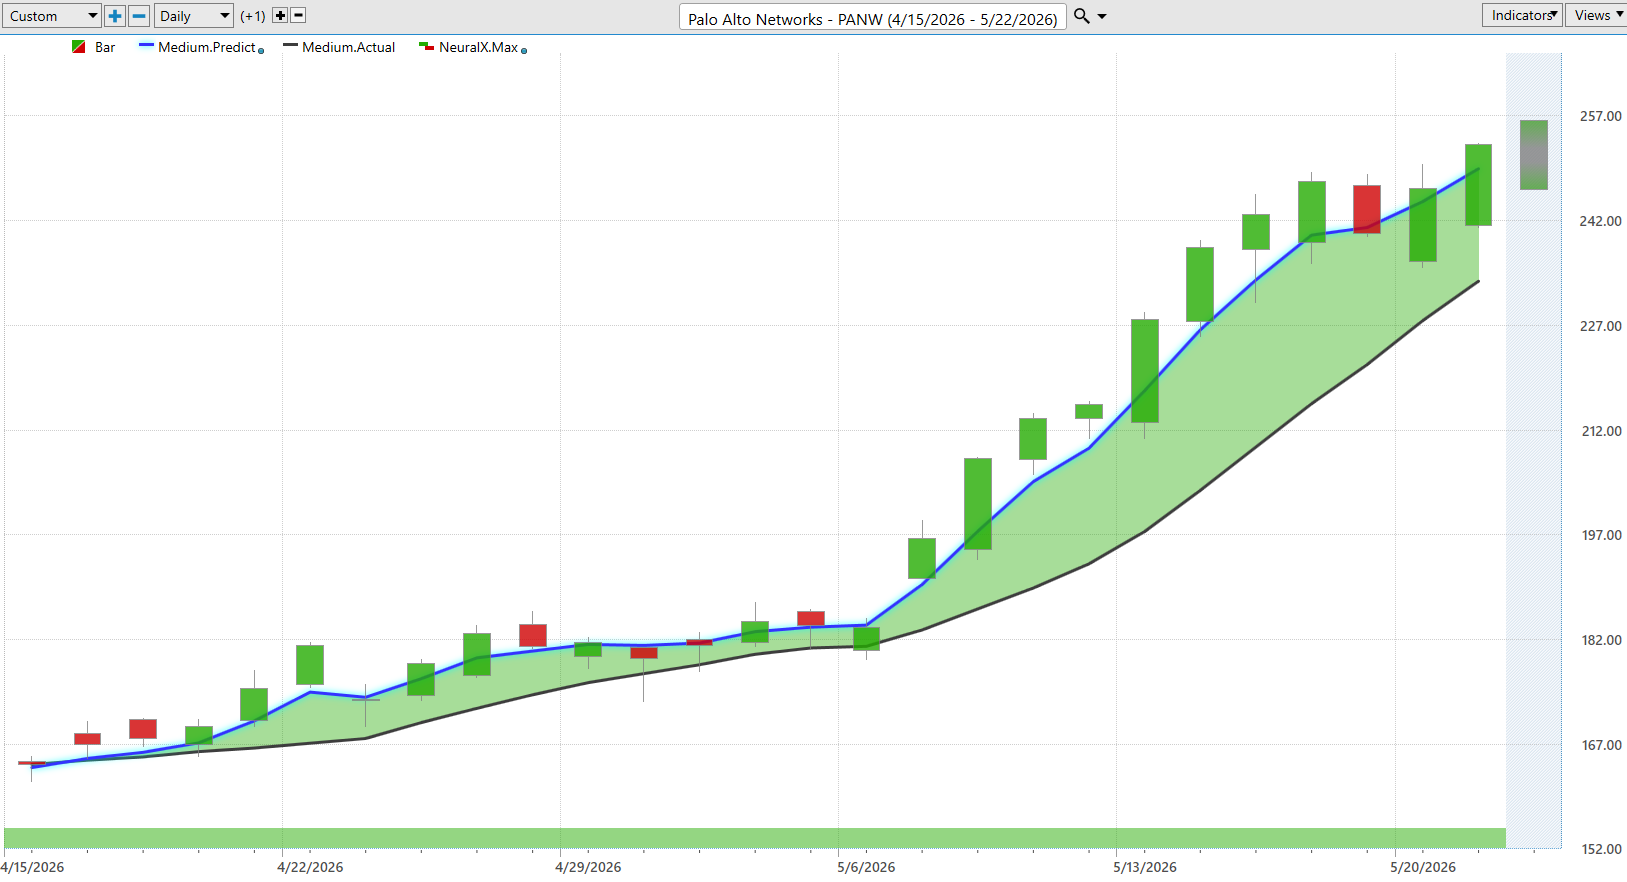
Now here’s PANW, a much more popular tech stock. But again, you see what the forecast has been indicating in these areas of the market that you might be trading.
Well, as far as PANW goes, every single day it’s forecasting consistent strength. So even in the market as it runs sideways here, the Neural Index is bullish every single day as we creep higher over those subsequent 48-hour periods.
And then look at these predicted highs and lows. So having this roadmap here, we do point out that on these days where all the price action is bullish one day, look for that predicted low level to potentially get hit the next trading day.
And you see how this works again, getting everything back online and adjusting and saying, okay, how have things shifted? Where is the technology expecting these predicted highs and lows to fall for the next trading day?
And you see here, this has been maybe five days in a row where you’ve almost perfectly hit that predicted low and continued on in the uptrend.
So really exciting stuff. And again, for day traders, when you understand buy at the market down here, look to take profit, buy down here, look to take profit, buy down here, look to take profit, and sort of rinse and repeat.
And having this roadmap that can help you make better decisions in line with your trading style and approach, whether that be a position or swing trade or day-to-day trading with the levels from the predicted highs and predicted lows.
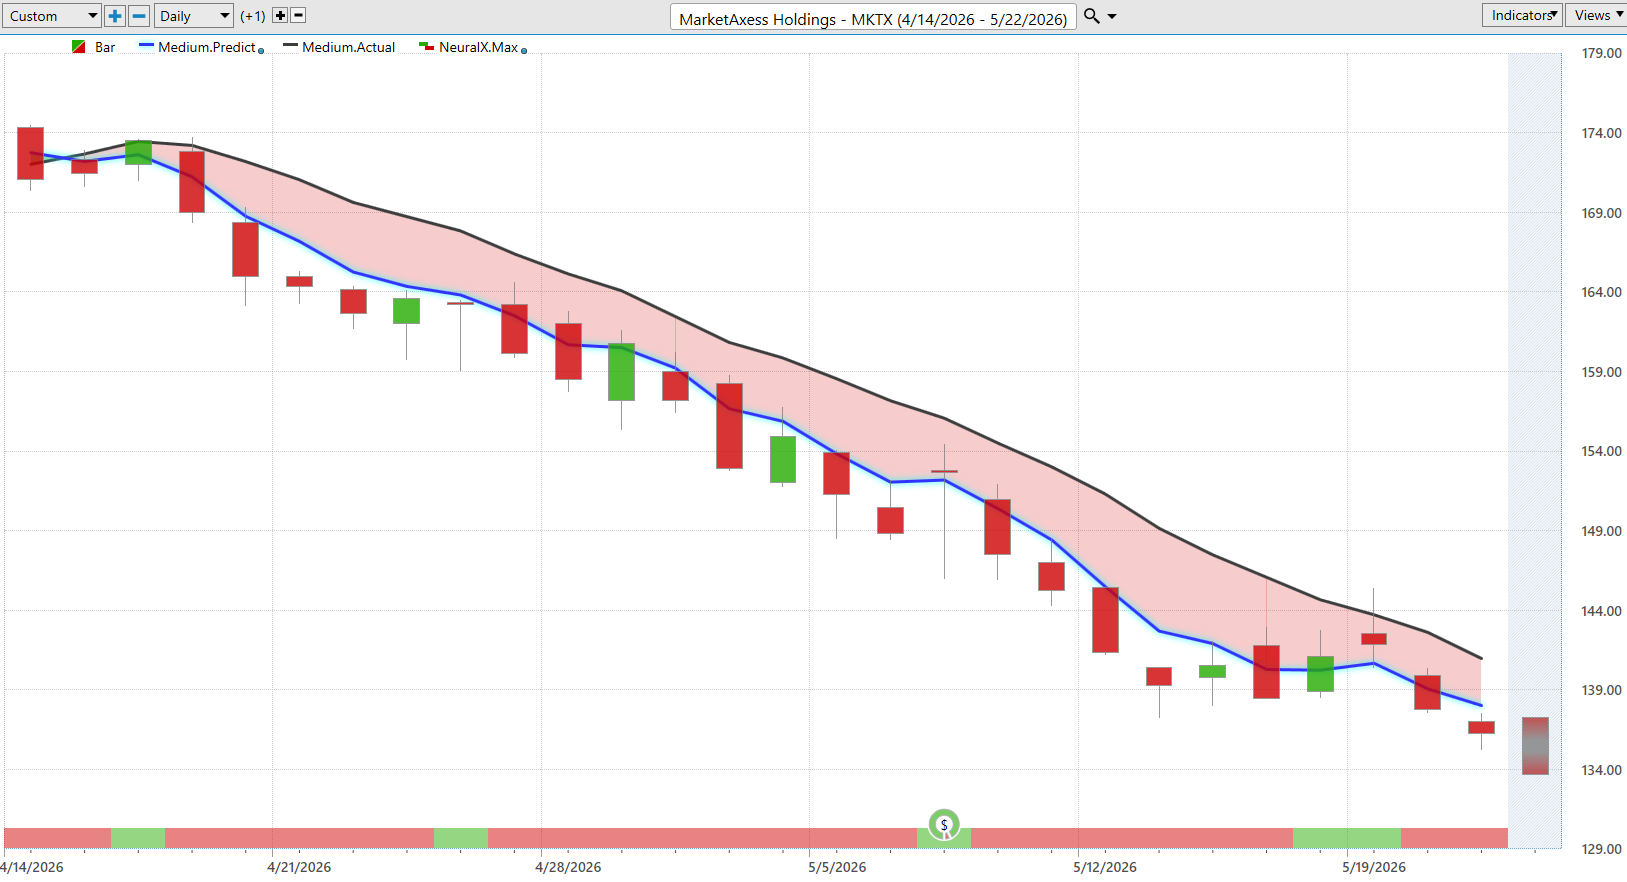
Switching back to some weakness, here we see MKTX, blue line below the black line, and a lot of weakness from the Neural Index with little blips in between where that Neural Index goes bullish.
But just another area where we see that the broader markets and certain stocks are doing really well. But the last thing you want to do is be positioned in an area where we’re clearly in a downtrend.
It’s less likely you’re going to benefit off of that risk-on behavior coming into the market. And you see shares off about 21% here just in the past 27 trading days.
And of course those predicted highs and lows, again, just this really adaptable roadmap that every single day is making those adjustments so you can be prepared for the next trading day and really focus on the absolute best opportunities for your style and approach here.
So again, numerous entries on the bearish side. And you see within about 48 hours that market’s continuing trend and moving in the expected direction.
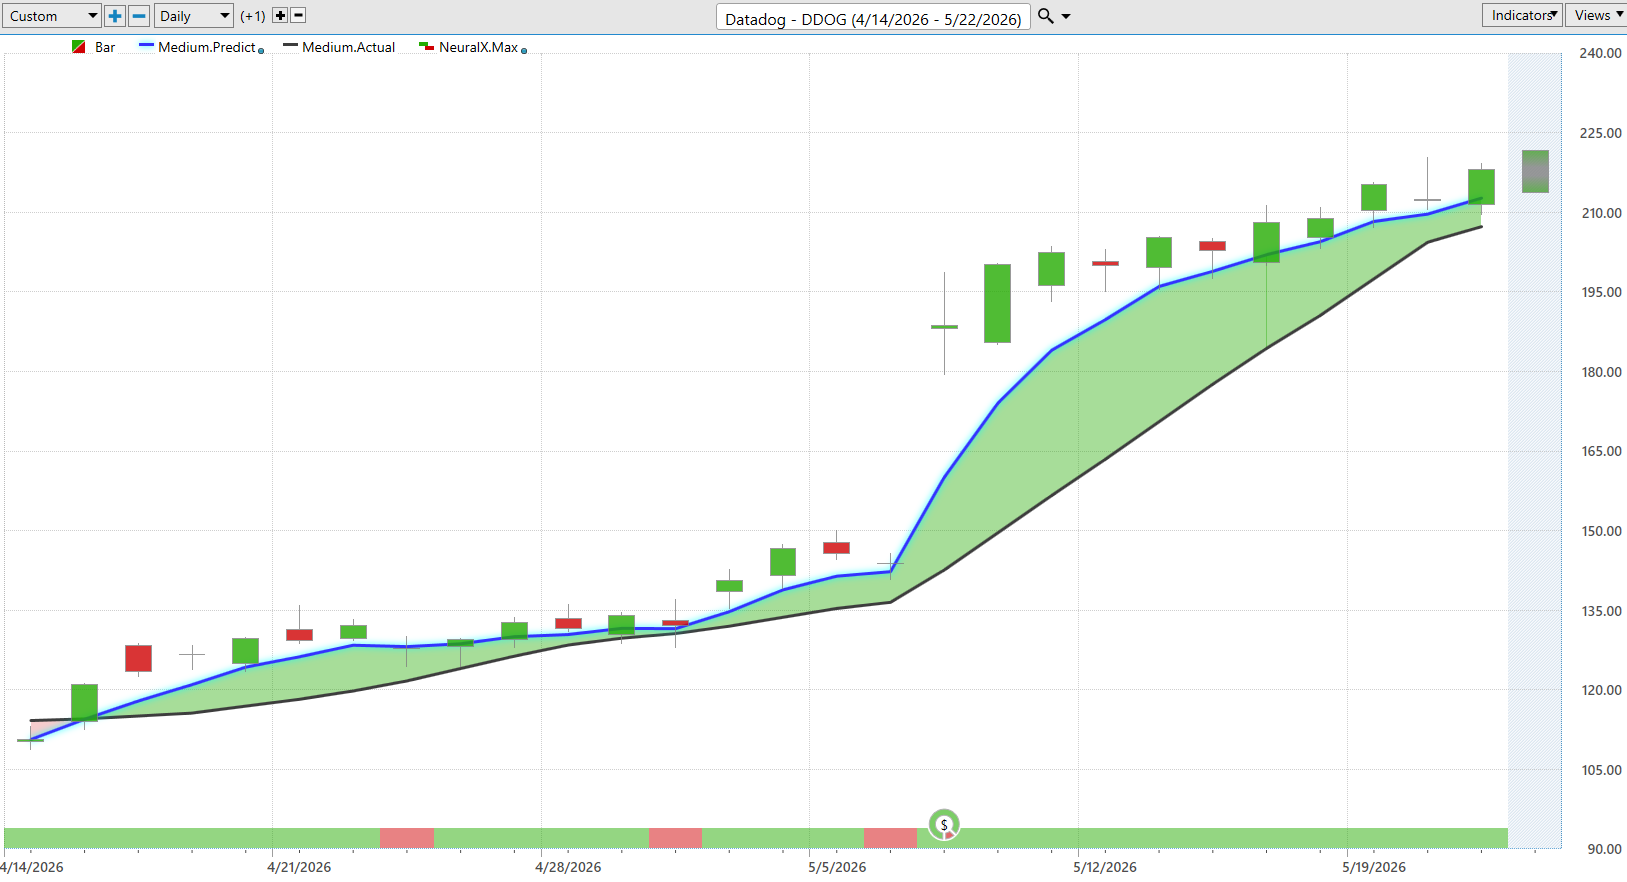
DDOG here, blue line over black line. Couple of periods where the Neural Index goes bearish. Again, earnings is always one of those things where you want to factor that in, that there’s going to be a high-volatility catalyst there.
But notice how after earnings, even after all that noise, what happens is the VantagePoint tools take that into account. They look at those intermarket relationships, and then they get back to forecasting highly accurate short-term predictions.
And so we see the overall forecast here from VantagePoint very clearly saying, buy down at these predicted lows and potentially target the predicted highs for profit targets.
We really see how this works over the last couple of weeks, every single day getting a very solid forecast. And even before earnings, multiple areas to accumulate a position so that you can take on that earnings risk.
So if we have earnings coming through, you may want to take on that risk, but obviously if your entry is several dollars in profit, that’s going to be helpful in dealing with some of that volatility.
So again, DDOG, really exciting opportunity here, shares up quite a bit. Overall again, up about 86%.
So that’s the thing. A lot of these markets that turned up in April, you’ve just seen monster moves out of these tech stocks. So 100-plus percent moves in many areas of the market.
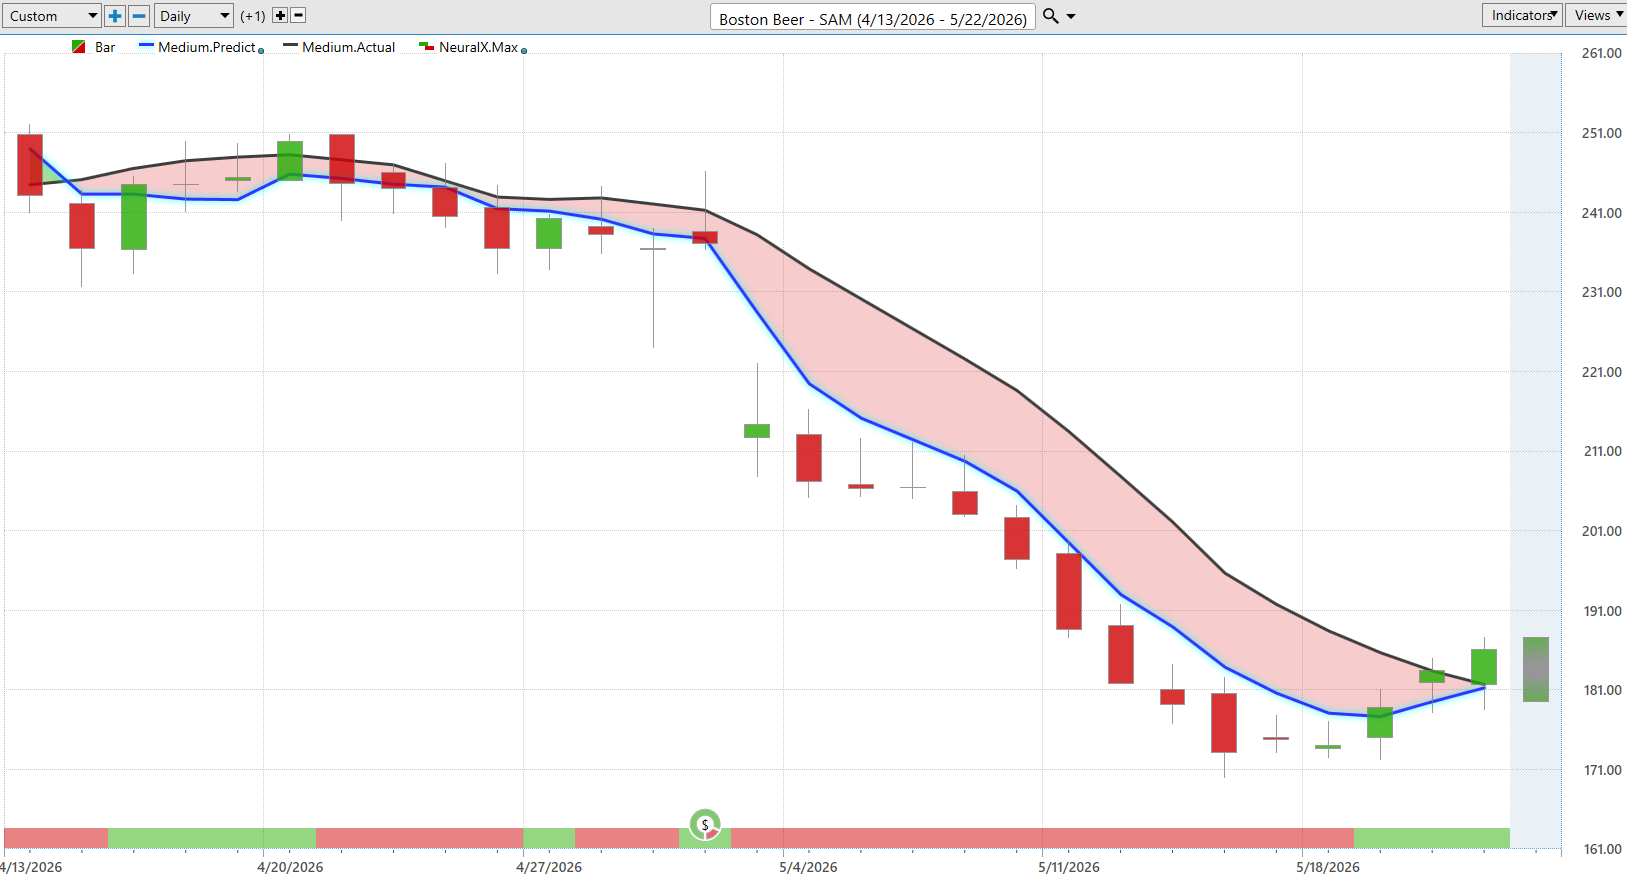
But not so much here in SAM. Very clearly a lot of these consumer staple stocks and dividend payers are actually not performing well. They may look cheap, but prices can still go lower here.
So you see the Neural Index bullish, you’re running sideways, but it’s very clearly that the trend is down here. So you don’t want to get fooled into any of this strength thinking that the market’s recovering.
Very clearly, you only want to short and take profits on shorts. And again, that daily roadmap gets updated every single evening at 6 p.m. before the trading day.
And so we see coming into earnings acting as that catalyst and then the technology very quickly factoring that in, readjusting these forecasts. And then again, we see recently actually seeing some strength come into the market in the short term moving up towards those predicted highs.
But clearly a very dangerous place to be, especially around that earnings report and that catalyst that just drives the stock lower in this case, off about 26% in about 27 trading days.
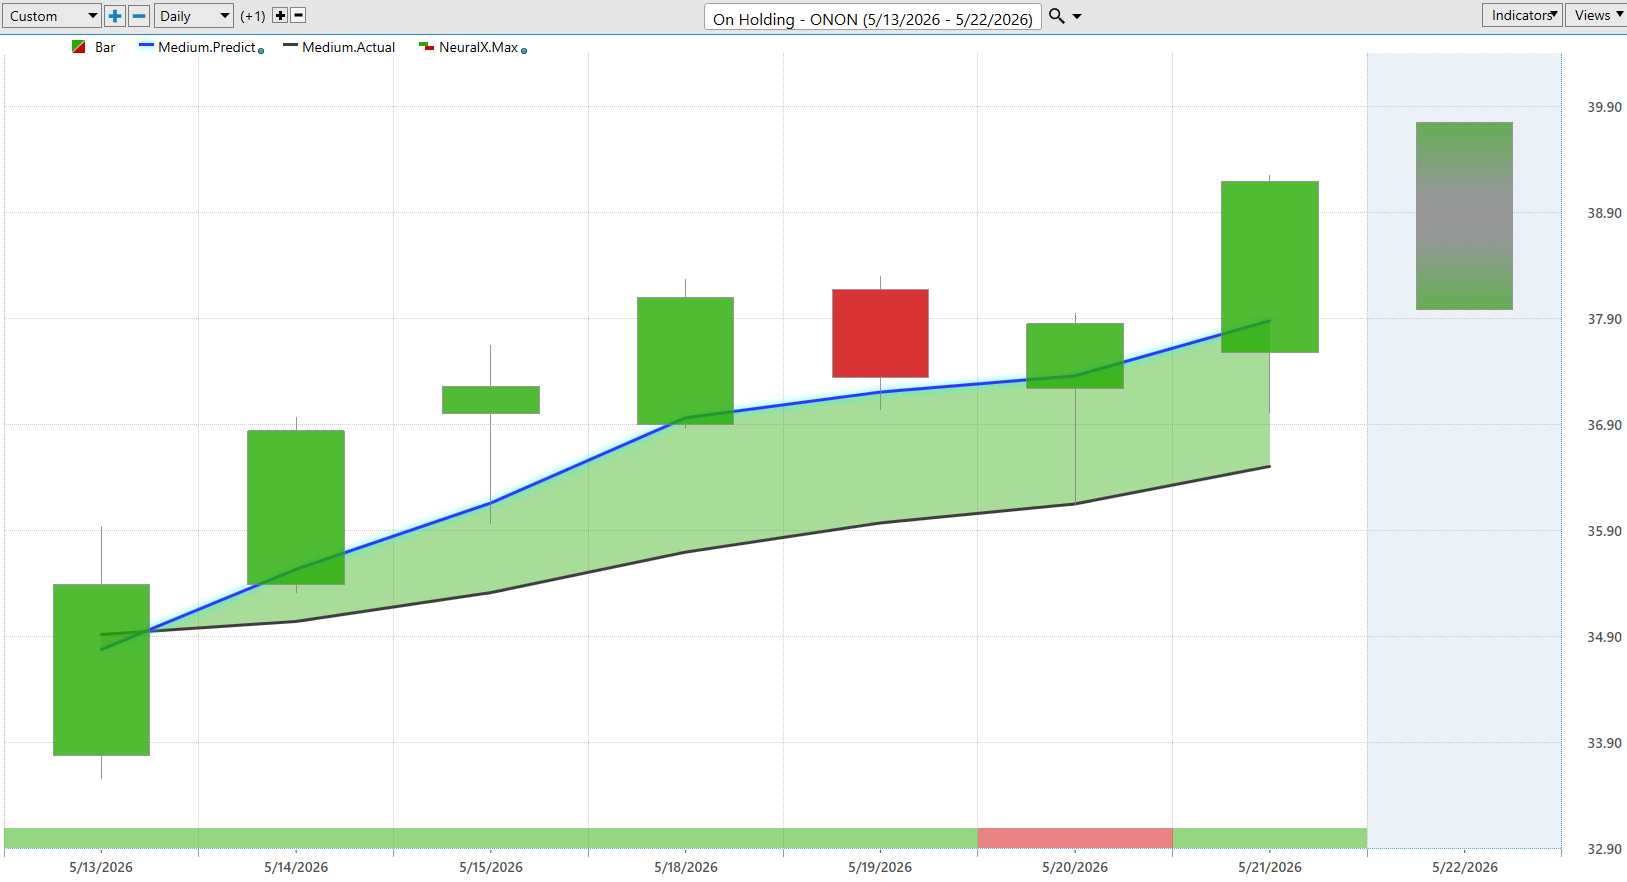
And lastly here, just a more recent opportunity. So we actually have seen a lot of markets shift to the bullish side. IBM is one of those examples.
Here’s ONON, blue line getting above the black line. And again, just very clearly going into the week, where do you want to be looking to accumulate a position? Well, down at these predicted lows.
And we see the market continuing on in that uptrend. So again, just really exciting stuff in many different areas of the market.
But this has been going on for a while. So when traders understand that this is a broader market that’s flipped really back in April, you can identify those markets that are performing well, that have stayed in those uptrends.
And that’s where we see the accuracy of the short-term forecast doing a good job navigating these markets as things trade moving forward here.
So we’ll go ahead and leave it there for today. Once again, this has been the Hot Stocks Outlook for May 22nd, 2026. Thank you all for watching. Best of luck out there and bye for now.

